Small area NCMP data: short interpretation guidance: June 2021
Published 2 June 2021
Applies to England

© Crown copyright 2021
This publication is licensed under the terms of the Open Government Licence v3.0 except where otherwise stated. To view this licence, visit nationalarchives.gov.uk/doc/open-government-licence/version/3 or write to the Information Policy Team, The National Archives, Kew, London TW9 4DU, or email: psi@nationalarchives.gov.uk.
Where we have identified any third party copyright information you will need to obtain permission from the copyright holders concerned.
This publication is available at https://www.gov.uk/government/statistics/child-obesity-and-excess-weight-small-area-level-data-june-2021-update/small-area-ncmp-data-short-interpretation-guidance-june-2021
1. New in this update
The June 2021 update of the Obesity Profile provides an update to the geographic boundaries for wards and clinical commissioning groups (CCG) to use 2020 codes and boundaries. This update does not include a new year of National Child Measurement Programme (NCMP) data. The profile displays small area data from NCMP for reception (age 4 to 5 years) and year 6 (age 10 to 11 years) children from 2008 to 2009 through to 2019 to 2020 academic year data for Middle Super Output Area (MSOA), electoral ward, and CCG areas.
The following indicators have been updated in the NCMP small area data topic and show data for MSOAs, electoral wards and CCGs, together with local authority and England figures for comparison.
- Reception: Prevalence of obesity (including severe obesity), 3-years data combined
- Reception: Prevalence of overweight (including obesity), 3-years data combined
- Year 6: Prevalence of obesity (including severe obesity), 3-years data combined
- Year 6: Prevalence of overweight (including obesity), 3-years data combined
The small area data is presented by area of child residence using rolling 3-year combined NCMP data to show small area trends from 2008 to 2009 up to 2019 to 2020. This data will assist planning and delivery of services for children and the targeting of resources at a local level to help reduce the prevalence of excess weight and obesity.
2. Main findings
The main findings were that:
- there is variation in child obesity and excess weight prevalence at small area level throughout England
- obesity prevalence is highest among children living in the most deprived areas of England
3. Summary
This data publication provides trend data on the prevalence of excess weight (overweight including obesity) and obesity (from NCMP 2008 to 2009 up to 2019 to 2020). The data presented is based on area of child residence, for 2011 MSOAs, 2020 electoral wards, 2020 CCGs, 2021 local authorities and England.
This update of the Obesity Profile synchronises with the update to the PHE Local Health tool.
To produce as robust an indicator as possible at small area level, the prevalence estimates use 3 years of NCMP data combined; the latest data is presented for 2017 to 2018 up to 2019 to 2020 combined. The comparator data provided at local authority and England level also uses 3 years of NCMP data combined.
School closures, in March 2020, due to the COVID-19 pandemic meant that in 2019 to 2020 the number of children measured was around 75% of previous years. Analysis by NHS Digital shows that national and regional level data is reliable and comparable to previous years. The data at local authority level and below is not as robust; as a result a small number of areas do not have published data for 2019 to 2020 and data for some areas have a reliability flag indicating that figures need to be interpreted with caution. Further information is available in the reliability and data quality flags in the Obesity Profile and in the NHS Digital 2019 to 2020 annual report
In the 3-year grouped NCMP data for small areas we would expect around 33% of data from each contributing year. Values for areas where less than 20% of data is from 2019 to 2020 is flagged with an asterisk (*) and the following note ‘Data for 2019 to 2020 is underrepresented due to measurements stopping in March 2020 - see metadata for details’. The percentage contribution of 2019 to 2020 data to the 3-year data for each geographic can be found in the reliability and data quality flags in the Obesity Profile. The obesity, and excess weight prevalence indicators at small area level for 2017 to 2018 up to 2019 to 2020 are still considered to be reliable even with a small amount of data from 2019 to 2020.
4. Interpreting the data
Prevalence of child obesity and excess weight varies across England. Analysis of national data in the National Child Measurement Programme and local authority data in the Public Health England, Obesity Profile shows that children resident in the most deprived areas in England are at the highest risk of being overweight and obese.
In England 9.7% of children in reception were obese in the combined 3-year period 2017 to 2018 up to 2019 to 2020, varying from 4.5% to 14.3% at lower tier local authority level. Among children in year 6 in England 20.4% were obese in the same period, varying from 9.9% to 29.4% between lower tier local authorities. There is often considerable variation between neighbourhoods within each local authority.
This variation within local authorities can be examined using data for MSOAs and wards. The data published in the Obesity Profile will help to identify pockets of high child obesity and excess weight and enable changes in prevalence to be monitored over time. This may help to assist planning and delivery of services for children.
Figures 1 and 2 show examples of how the data can be examined to identify local patterns and trends in child obesity prevalence using the data at ward level.
When interpreting this small area level data it is important to consider the 95% confidence intervals for the values as they show the level of uncertainty in the prevalence estimates and provide a range in which we can be 95% confident contains the true value.
In general, the greater the number of children measured within any analysis, the more reliable the resulting statistics (for example the England and local authority figures). Analysis based on small areas (such as MSOA and ward level) may show more natural variation due to changes in the school year cohort, and therefore the prevalence figure may not always provide a reliable estimate of the true value in the population.
Figure 1 shows an example of the prevalence of obesity among year 6 children in Milton Keynes local authority by ward of child residence. Obesity prevalence varies between 9.5% up to 26.3% across all wards in Milton Keynes. In Figure 1, Central Milton Keynes ward has the highest prevalence value in the local authority of 26.3% and the 95% confidence intervals range from 22.6% to 29.8%. We can be confident that year 6 obesity prevalence in Central Milton Keynes ward is higher than the England and Milton Keynes LA values as their confidence intervals do not overlap with that for Central Milton Keynes ward.
When making comparisons with other wards however, we can only say with some certainty that prevalence in Central Milton Keynes ward is higher than the prevalence in 8 wards with the lowest prevalence as in only these cases the confidence intervals do not overlap. For the other wards the confidence intervals do overlap so we cannot be confident that the prevalence in Central Milton Keynes ward is higher than the prevalence in any of these wards.
The bars on Figure 1 are shaded red (higher), amber (similar) and green (lower) to help compare the ward value to the England value.
Figure 1: A chart from the Fingertips profile showing prevalence of obesity among year 6 children (aged 10 to 11 years) in Milton Keynes local authority by ward of residence, NCMP 2016 to 2017 up to 2019 to 2020 with 95% confidence intervals
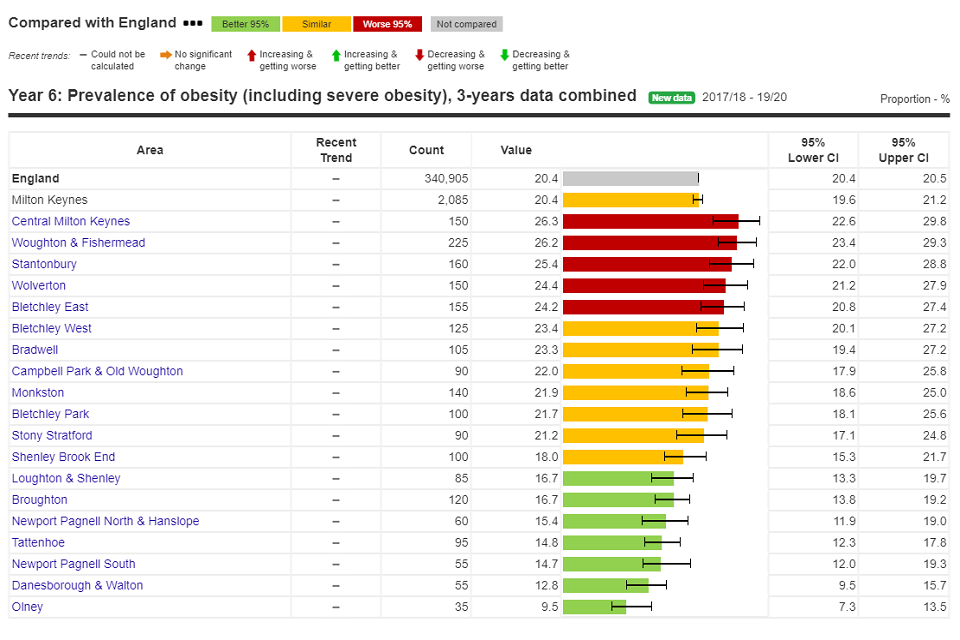
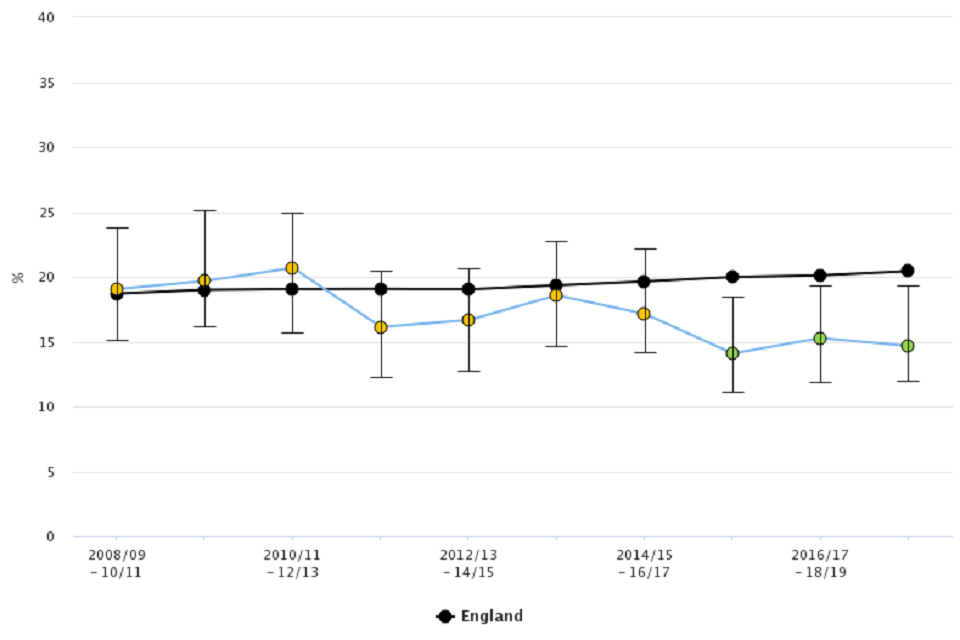
Figure 2 shows the trend in obesity prevalence among year 6 children for Newport Pagnell South as an example ward. Obesity prevalence in this ward has been lower than the England value since 2015 to 2016 up to 2017 to 2018.
Figure 2: A chart from the Fingertips profile showing the trend in prevalence of obesity among year 6 children (aged 10 to 11 years) for Newport Pagnell South ward in Milton Keynes local authority, NCMP 2008 to 2009 up to 2019 to 2020 with 95% upper and lower confidence intervals (UCI and LCI) around Ward data (benchmark is England)
5. Background
The NCMP annually measures the height and weight of over one million children in England and provides robust data on the prevalence of overweight and obesity. Children with a body mass index (BMI) greater than or equal to the 95th centile of the British 1990 growth reference (UK90) BMI distribution have been classified as obese, and children with a BMI greater than or equal to the 85th centile have been classified as overweight including obese (excess weight).
The statistics were produced using the national analysis dataset provided to Public Health England by NHS Digital. Detailed metadata for each indicator is available in the definitions tab of the Obesity Profile. The NCMP data for year 6 children from 2006 to 2007, 2007 to 2008, and 2008 to 2009 needs to be treated with caution as low participation levels in these years led to underestimation of obesity and excess weight prevalence.
These indicators can also be examined in the Public Health England (PHE) Local Health tool.
Responsible statistician, product lead: Caroline Hancock
For queries relating to this document, please contact: ncmp@phe.gov.uk