State of the Nation 2022: Chapter 2 – Mobility outcomes
Updated 21 July 2022

© Crown copyright 2022
This publication is licensed under the terms of the Open Government Licence v3.0 except where otherwise stated. To view this licence, visit nationalarchives.gov.uk/doc/open-government-licence/version/3 or write to the Information Policy Team, The National Archives, Kew, London TW9 4DU, or email: psi@nationalarchives.gov.uk.
Where we have identified any third party copyright information you will need to obtain permission from the copyright holders concerned.
This publication is available at https://www.gov.uk/government/publications/state-of-the-nation-2022-a-fresh-approach-to-social-mobility/state-of-the-nation-2022-chapter-2-mobility-outcomes
1. Key insights
The dominant view in politics and the media has been that social mobility in the UK is in decline and that the UK compares very badly with other countries. But the evidence is not as gloomy as the popular narrative.
The UK’s total occupational mobility rate has remained stable for many decades. This is an absolute measure that gives the percentage of people in a different occupational class from their parents.
In the late 20th century, there was a large surplus of upward over downward mobility, but this surplus is now shrinking, as growth in professional and managerial jobs slows. But this is a sign of success – it is because the professional class has grown so much in the last 70 years.
Relative rates of occupational mobility – the relative chances of people from different backgrounds reaching a particular destination – are not in decline, and may even have improved over decades.
There is less consensus on mobility in other outcomes such as income, wealth, housing and education. Trends in these mobility outcomes may be different. For example, there probably has been a decline in absolute and relative income mobility for people born in the late 1970s and beyond.
2. Introduction
We want to be as clear as possible in our definition of social mobility, and about what the different mobility measures are telling us. Previous versions of our annual report did not include the social mobility outcomes that are most common in the academic literature – instead, we focused on some of the drivers of social mobility, together with a selection of outcome measures. But we believe that it is vital to put the public debate about social mobility in the context of an accurate scientific understanding of the issue, so that we can understand where our focus should be.
For this reason, our new Social Mobility Index includes the standard academic measures of occupational and income mobility, such as the total occupational mobility rate.[footnote 1] We plan to supplement these with similar measures for other life outcomes like wealth, housing and education. By using these standard measures, we can make more meaningful comparisons over longer time periods, drawing on previous academic work.
This year’s report will use a limited version of the index, consisting only of the intermediate outcomes and the drivers of change. In 2023 and beyond, we will use the index more fully, using a range of mobility outcomes. In the meantime, in this chapter, we will examine the existing academic work on mobility outcomes. This will help us to understand how mobility has been evolving in the UK, and where it might be heading.
Figure 2.0: Mobility outcomes
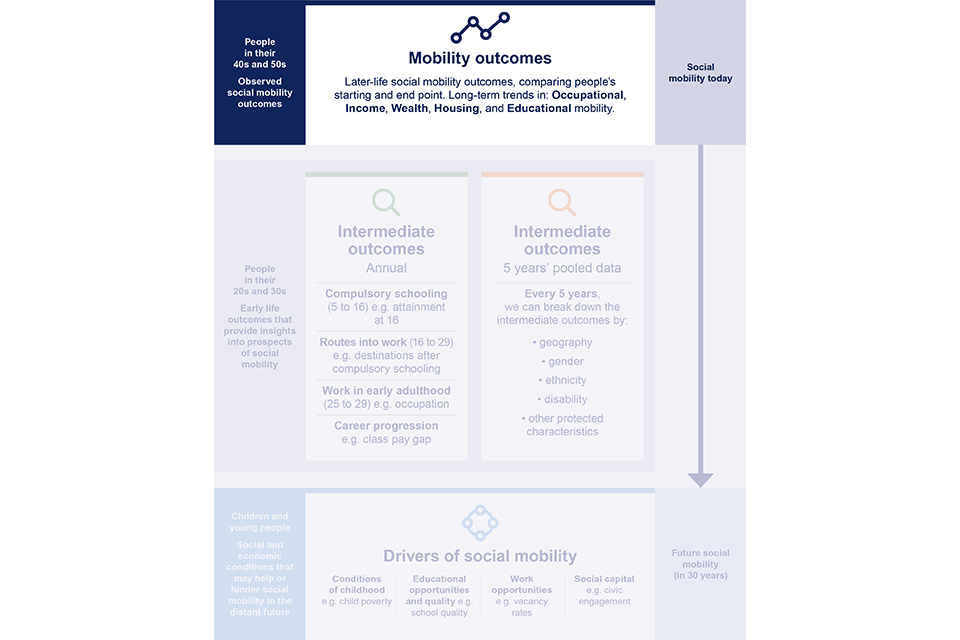
3. What are mobility outcomes?
An individual experiences intergenerational social mobility when their life outcomes, such as their type of occupation, differ from their parents’. Change across generations, and the link between parents and children, are the core of social mobility. Change can be upwards or downwards.
When there is a strong link between parents’ outcomes and their children’s, or when few people have different outcomes from their parents, social mobility is low. When the link is weaker, or many people have different outcomes from their parents, social mobility is higher. So in our index, mobility outcomes look at where people end up, typically in their 40s or 50s. We then compare that with where they started out as children, for example, what their highest-earning parent’s job was.
3.1 Occupational mobility and other outcome measures
Mobility research has historically focused on occupational mobility. This is the link between parents’ occupational class and their children’s.[footnote 2] Occupations are associated with a wide range of important life outcomes, including income, employment conditions and security, risks of unemployment, and health and wellbeing. We also have readily-available data on the occupations that people’s parents had. For these reasons, we have included the standard occupational mobility measures found in the academic literature.
We also recognise that other life outcomes are important, such as income, education, wealth and housing. So we have included discussion of income mobility in this report, and in the future, we want to supplement our measures of occupational mobility with some of these other mobility outcomes – for example, looking at cases where children end up with a higher (or lower) level of education than their parents.
3.2 Absolute versus relative mobility measures
Absolute measures simply capture the number of people who have experienced mobility. They are usually expressed as percentages of the population. For example, the total occupational mobility rate is the percentage of people who are in a different occupational class from their parents. For income mobility, a common absolute measure is the percentage of people whose income is higher than their parents’ income was, at the same age.
Relative measures compare the chances that at least 2 groups have of reaching, versus avoiding, a particular outcome. It is this element of comparison that makes such measures “relative”. A relative mobility measure tells us that one group has better chances than another, rather than telling us the total number of mobile people.
Both types of measures matter, because they tell us different things. For example, upwards absolute occupational mobility – the proportion of people ending up in a higher occupational position than their parents – might rise. This would be an improvement in an absolute measure. But if people from advantaged backgrounds are still more likely to get the top positions than those from lower socio-economic backgrounds, relative mobility would stay static.
Think of it like queuing for escalators to go to the top floor of a building. If more escalators become operational, more people can get up to the top floor (absolute mobility). But where you are in the queue matters – the ones at the front will benefit most from more escalators (relative mobility). Relative mobility captures this latter idea of people’s positions in the queue, while absolute mobility focuses on the proportions who have actually moved.
We all want a good life. But there are a limited number of jobs and opportunities out there. How far we can move up in life depends partly on our efforts, and partly on our starting point, or background.
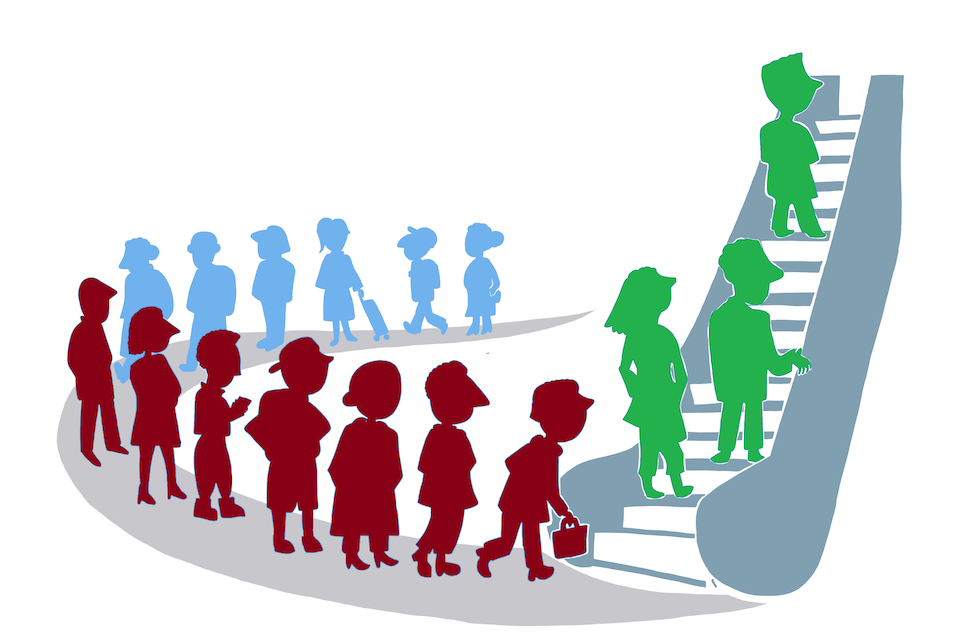
By removing barriers and creating opportunities and jobs, we increase absolute mobility. Now more people can move up in life. But our starting point still makes a difference.

Our choices and effort should determine where we end up, not our background. If we give those who started further back a helping hand, we increase relative mobility, making opportunity more equal.

Research suggests that absolute occupational mobility is often driven by changes in the shape of the occupational workforce structure, while absolute income mobility is driven by changes in the rate of growth of real household income.[footnote 3] For example, during a period of rapid economic growth, such as the 1950s, there tend to be more higher-level vacancies to be filled – increasing “room at the top”. If there are more higher-level vacancies than there are children from professional families to fill them, then more of these high-level vacancies are filled by people from working-class families. So higher percentages of the population will experience upward mobility (and a lower percentage will experience downward mobility).
For a real-world example, as more people went into higher education in the latter decades of the 20th century, there was a large increase in the number of first-generation university students. But the children of wealthier parents were at the front of the queue, and took even more advantage of the new opportunities than did the children of less wealthy parents. So while children from poorer families did improve their chances of getting to university, children from wealthier families did even better. As a result, the higher education participation gap between rich and poor children actually widened. This is equivalent to a decline in relative mobility. But at the same time, absolute upward educational mobility increased.[footnote 4]
4. Mobility outcomes in the UK
There have been many debates on absolute and relative mobility, the merits of income and occupational class measures, and choices of terminology and methodology. This has created some confusion in the discussion and understanding of social mobility.
There has been a considerable amount of sociological research investigating patterns and trends in occupational and income mobility. This work covers different time periods, uses a range of different data sources, and employs different statistical approaches and methods. As a result, there are some differences in the results and interpretations reached by different researchers, especially on relative mobility.
5. Occupational mobility
5.1 How do we define occupational class?
We distinguish 3 categories of occupational background, based on the occupation of the main earner in the respondent’s household when the respondent was aged 14. The 3 categories – ‘professional and managerial’, ‘intermediate’ and ‘working class’ – are from the National Statistics Socio-economic Classification (NS-SEC) which is the official socio-economic classification of the UK, as set by the Office for National Statistics (ONS).[footnote 5] This classification is used widely to understand the structure of socio-economic positions in society.
The way that occupational class is defined affects the level of occupational mobility that we measure. The larger the number of occupational groups, the greater mobility will inevitably be, as each group is smaller.
Table 2.1: The National Statistics Socio-economic Classification (NS-SEC)
What are the occupational classes?
| NS-SEC | Examples | Class |
|---|---|---|
| 1 – large employers, higher professional or managerial | CEO of large firm, doctor, clergy, engineer, senior army officer | Professional and managerial |
| 2 – lower professional or managerial, higher technical or supervisory | teacher, nurse, office manager, journalist, web designer | Professional and managerial |
| 3 – intermediate occupations | clerical worker, driving instructor, graphic designer, IT engineer | Intermediate |
| 4 – small employers, own-account workers[footnote 6] | shopkeeper, hotel manager, taxi driver, roofer | Intermediate |
| 5 – lower supervisory, lower technical | foreman, mechanic, electrician, train driver, printer | Working class |
| 6 – semi-routine occupations | shop assistant, traffic warden, housekeeper, farmworker | Working class |
| 7 – routine occupations[footnote 7] | cleaner, porter, waiter, labourer, refuse collector, bricklayer | Working class |
| 8 – never worked or long-term unemployed | – | Not analysed in 2022 |
‘Class’ here refers to ONS’s 3-part scheme (or model) of occupational class, used by the Social Mobility Commission.
The NS-SEC was developed from a classification known as the Goldthorpe Scheme.[footnote 8] It emphasises aspects of occupation such as labour-market situation, relationship to the employer, job security and advancement, rather than salary. So people in lower occupational classes can sometimes earn more than people in upper occupational classes. There can also be great variation in earnings within a class.
Despite certain ambiguities of the existing scheme, particularly in terms of the hierarchy of occupations and definition of those ‘long-term unemployed’, the NS-SEC has been available for use in all official statistics and surveys since 2001.
In this report, we follow ONS’s guidance on categorising NS-SEC into a 3-part schema. In the future, we may further subdivide the 3-part schema for a more granular analysis, allowing us to see short-range mobility and differences within the existing professional and working classes. For more detail, see the technical annex.
The midwife and the pipe-fitter
Occupational class is not about salary, nor does it provide the full story. People in lower occupational classes can sometimes earn more than people in upper occupational classes. There can also be great variation in earnings within a class. The point in a person’s working life at which peak earnings are reached also varies, with the peak typically coming later for professional jobs.

Midwife: NS-SEC 2 – professional. Average salary £25,000[footnote 9]

Pipe-fitter: NS-SEC 7 – working class. Average salary £41,000[footnote 10]
5.2 Absolute occupational mobility
As we noted, absolute mobility rates capture the percentage of people who are doing either better or worse than their parents. For example, the total occupational mobility rate is the percentage of people who have different occupational class positions to those of their parents at a similar stage of life.
Occupational structure, participation in education and in the labour market, living standards, and ethnic diversity have all changed significantly in the UK over the past few decades. In particular, the proportion of professional and managerial jobs has greatly increased in the decades since World War 2. This has allowed more people to improve their circumstances (experience upward occupational mobility). The composition of the labour force has also changed, with a dramatic increase in the number of women in professional occupations. The increase in the number of families where both parents hold professional and managerial jobs also means an increase in the proportion of children brought up in those homes. However, the expansion has slowed since 1991, so this ‘room at the top’ has been growing more slowly recently.[footnote 11]
Recent research provides a reasonably clear picture of the trends in these absolute rates of occupational mobility over the 20th and early 21st century. Throughout this period, the total occupational mobility rate in the UK has been stable, with a majority of men moving to different social classes from those in which they grew up. Although international comparisons can be difficult, the absolute rates in the UK are similar to those of other European countries that are at a similar stage in the evolution of their labour markets.[footnote 12] We have summarised the trends in figure 2.1, which show the intergenerational mobility patterns experienced by successive cohorts of men born throughout the 20th century.[footnote 13]
Figure 2.1: Total occupational mobility for men aged 35 to 65 years remained stable throughout most of the 20th century
Total occupational mobility rate, and its upward and downward components, for men across birth cohorts, aged 35 to 65 years.

Source: The General Household Survey, (from 1972 to 2005); the British Household Panel Survey, 2005; the UK Household Longitudinal Study, (from 2010 to 2012).
Note: Men aged 35 to 65 in the UK, current or last main job. Years represent the birth cohort of respondents (in other words, respondents are grouped by their year of birth). Weighted analysis, with weights provided by the data providers. 6-class class schema used, as the 7-class schema was not available in the General Household Survey.
The total rate has remained stable: “men and women who were born in the 1980s are no less likely to have moved to different class positions to those of their parents than men and women who were born at any time earlier in the 20th century.”[footnote 14] There are some differences of detail between men and women (and also between data sources).[footnote 15] However, within this stable total rate, the balance between upward and downward mobility has shifted.
Men born in the 1930s had particularly favourable mobility chances. Here, nearly 40% experienced upward mobility at or after the age of 35 and just less than 20% experienced downward mobility. This gave a net surplus of 21 points. This has been called the ‘golden age’ of social mobility. As a consequence, the working classes have steadily decreased over time. In 1951, around 11% of economically active people were in professional and managerial jobs. By 2011, this had risen to 30%. Meanwhile, the percentage in working-class jobs fell from around 69% to 39%.[footnote 16]
There are now fewer people at the bottom of the social ladder to make big leaps in social status, and more people starting life higher up, with less room to climb. Together, these changes mean that, although the total mobility rate has stayed the same, younger generations of men and women are more likely to experience downward mobility and less likely to experience upward mobility than their parents or grandparents. The surplus of upward over downward, though, is still positive. It had declined to 14 points in the youngest cohort, born in the 1970s.[footnote 17]
Upward and downward occupational mobility
Upward occupational mobility refers to moving from a lower class of origin into a higher class destination. Downward mobility refers to the opposite. The absolute upward and downward mobility rates reflect two factors: changes in the labour market, creating more or less room for people to move up and down; and social fluidity, or people’s relative chances of reaching a destination given different starting points.
It is not clear that there will continue to be a surplus of upward over downward mobility. Recent findings suggest that the generation born in the early 1980s is just as likely to move down as up.[footnote 18]
We also find trends for increasing upward mobility for men from working-class family origins over 5 decades. We can see from figure 2.2 that, over the 5 decades, working-class sons were increasingly likely to move into professional and managerial jobs. Immobility was declining at roughly the same pace as long-range (large) upward mobility was rising, with short-range (small) upward mobility staying constant. For example, only 13% of men from working-class backgrounds showed long-range upward mobility in the 1972 to 1980 period, but roughly 31% did in the 2011 to 2020 period.
Figure 2.2: Increased long-range (large) upward mobility from working-class backgrounds over 5 decades
Rates of short-range and long-range upward mobility for men aged 16 to 65 years from a working-class background, UK, from 1972 to 2020.

Source: The General Household Survey, (1972 to 2005); the British Household Panel Survey, (1991 to 2008); the UK Household Longitudinal Study (2009 to 2018); Taking Part (2005) and Labour Force Survey (2014 to 2020).
Note: Long-range and short-range upward mobility for men aged 16 to 65 from working-class backgrounds as defined by NS-SEC 7 origins in the UK. Years represent the periods in which the data was collected. Long-range and short-range upward mobility refer to whether mobility crosses the decisive line of professional/managerial class occupations. So upward mobility from lower origins into the professional/managerial class is called “long-range upward mobility”. If it does not reach professional/managerial class, such as from working class into intermediate class, it is called “short-range upward mobility”.
There was a considerable expansion of the middle class in the middle of the 20th century, with many more professional and managerial jobs becoming available. This meant that upward mobility rates had to increase: if there are more professional jobs than there are children from professional families to fill them, then the jobs have to be filled by children from other backgrounds. If we want to consider mobility rates with the effects of labour-market changes taken out, then we need to look at relative mobility.
5.3 Relative occupational mobility
Relative mobility compares the mobility chances of people coming from different social origins. It focuses on the question: how does people’s social class background affect their chances of obtaining one class position rather than another? Measures of relative mobility can be thought of as describing the strength of the intrinsic link (or “stickiness”) between parents’ and adult children’s positions.
Figure 2.3: Mosaic plot of example numbers illustrating odds ratios
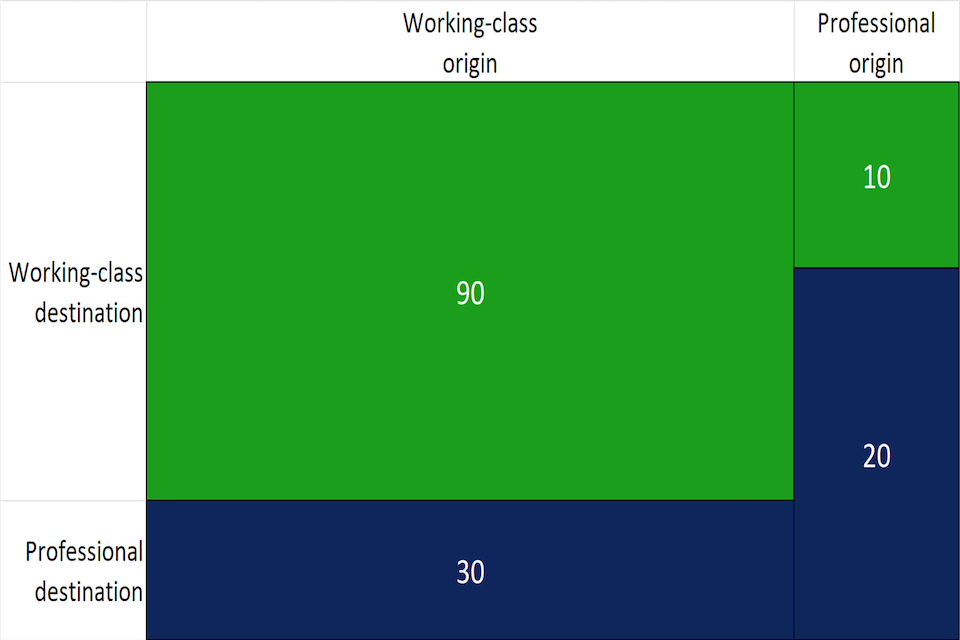
Note: Numbers created for illustration.
In figure 2.3, looking at those of professional origin (the right-hand column), we can see that, for every 2 people who ended up in a professional destination, one ended up in a working-class destination. This gives odds of 2/1 in favour of reaching a professional rather than working-class destination. Among those of working-class origin, for every one who ended up in a professional destination, 3 ended up in a working-class destination. This gives odds of 1/3 (or 3/1 against).
This means that, if you come from a professional background in this example, your odds are 6 times better, since 2/1 divided by 1/3 is 6. This figure of 6, known as an odds ratio, is an example of a relative occupational mobility measure. It does not tell us about rates of mobility in society as a whole. It just says that one group has more favourable chances than the other.
Relative measures are important precisely because they highlight differences. They show us where we might concentrate our efforts if we want opportunities to be equalised. Tracking relative measures over time is also useful, because it can show whether such efforts have been successful or not. In addition, relative measures are more independent of changes in the structure of the labour market than absolute measures. Thinking back to the metaphor of the escalator, relative measures tell us about the ordering of the queue, which may remain the same even if the escalator becomes wider.
There is some disagreement about whether or not there has been any change over time in relative occupational mobility, with some analysts finding no change and others a modest improvement.[footnote 19] [footnote 20] [footnote 21] Contrary to much of the popular discussion, declining relative occupational mobility is not in evidence, and relative rates in the UK compare well to those in other European countries.[footnote 22] There is clearly a relationship between class of origin and class of destination. For example, a man with NS-SEC 1 origins (a higher-professional family background) has 20 times better odds than a man with NS-SEC7 origins (a routine-working-class background), of reaching an NS-SEC 1 destination, rather than an NS-SEC 7 destination. But such disparities, while large, have not worsened over time. They may even have slightly narrowed.
Figure 2.4: Relative occupational mobility (the gap in occupational mobility chances) has slightly improved over time.
Estimates of the log uniform difference (UNIDIFF) parameter from 1972 to 2020, respondents aged 35 to 54 years.

Source: Internal estimates based on the General Household Survey (1972 to 1992, 2005, except 1977, 1978), the British Household Panel Survey (1991 to 2008), the UK Household Longitudinal Study (also called Understanding Society, 2009 to 2020), the Taking Part Survey (2005) and the Labour Force Survey (2014 to 2020).
Note: The UNIDIFF (uniform difference) model assumes that all odds ratios are changing by a common percentage between years. This common percentage is expressed in log form, the log UNIDIFF parameter shown above. When it is zero, there has been no change in the odds ratios – relative mobility has stayed constant. But when it is negative, the link between origins and destinations has weakened – odds ratios have decreased, and relative mobility has improved. For example, at -0.1, then wherever the odds used to be 10 times better for one group than another, they are now only roughly 9 times better. And at large negative values, there is almost no link at all between origins and destinations. Everyone, from all class origins, would have a roughly equal chance of reaching any occupational destination.[^23] No data was available for 1977 or 1978 – the trend is interpolated.
The discussion up to this point has focused on occupational mobility, since this is where we have the most evidence in the academic literature. Of course, occupation is not the only important life outcome. There has been work on income, wealth, housing and educational mobility. To get the fullest picture, we will supplement our measures of occupational mobility in future years with some of these other mobility measures, where data and analytical techniques allow.
6. Income mobility
6.1 Measurement challenges
As with the proportion of professional jobs in the labour market, there are upward trends in economic growth and standards of living, but economic trends tend to be more volatile than the trends in occupational structure. For example, living standards dropped after the 2007 to 2008 financial crash, and poverty rates and unemployment rates have also been quite volatile since 1980.[footnote 24] Accordingly, trends in income mobility can be more volatile, at least in the short term, than trends in occupational mobility.
Measurement of income mobility can also present very different challenges from occupational mobility. While people might be expected to remember their parents’ occupation when they were growing up, it is unlikely that many people could accurately recall their parents’ income. This means that large-scale surveys like the Labour Force Survey (LFS), which rely on recall for data about childhood conditions, are not generally used for income mobility. Instead, panel surveys are preferred, with the same people tracked over time. A second method involves combining the results of panel studies with regular cross-sectional surveys like the LFS. Unfortunately, a key data gap in the UK is linked parent-child tax records, which exist in the US, which would allow more accurate estimates of income mobility.
Analysis of these surveys has tended to show that, in contrast with the picture on occupational mobility, Britain has below-average levels of both absolute and relative income mobility when compared with other developed countries.[footnote 25]
6.2 Absolute income mobility
The most common measure of absolute income mobility is the percentage of people whose income is higher than their parents’ was at the same age. This is a measure of upward mobility and is strongly influenced by the growth of real household income.
Recent British research has combined results from the 1970 British Cohort Study with annual data from the series of Family Resources and Family Expenditure surveys. This gave an estimate of the absolute income mobility of adult children at age 30 years across birth cohorts born from 1964 to 1987 (reaching age 30 years from 1994 to 2017).[footnote 26] The results showed that there was an increase in absolute upward income mobility among the earlier cohorts. This peaked among those born in the mid-1970s. It then declined among the most recent birth cohorts.
A recent major comparison of absolute mobility rates across countries found that the US and Canada had relatively low rates of around 50% for recent cohorts. Countries like Norway and Finland saw much better rates of above 70%. Rates in the UK were well above 70% for mid-1970s birth cohorts, but have declined since then to below 70%. The analysis further showed that the variation in these upward mobility rates was driven by differing levels of income inequality.[footnote 27]
Figure 2.5: Absolute income mobility in the UK was good for those born in the mid-1970s, but has since declined
Estimates of upward absolute income mobility by country and birth cohort from 1960 to 1987.

Source: Manduca and others (2020). Trends in absolute income mobility in North America and Europe.
Note: The upward absolute mobility rate is the percentage of children in each birth cohort whose pre-tax, post-transfer family income at age 30 years, adjusted for inflation, was higher than their parents’ family income at age 30 years. Incomes are measured using a combination of register and survey data in each country.
6.3 Relative income mobility
Relative mobility for income is most commonly measured through the correlation between parents’ and children’s incomes. This is done either by taking logs of the income (which yields a correlation of proportional change in parents’ and children’s incomes, known as intergenerational income elasticity), or by using a rank correlation.
The main data sources that have been used in the UK are the 1956 National Child Development Study and the 1970 British Cohort Study. The most recent study has been able to estimate sons’ lifetime economic mobility by drawing on the income data reported by sons from ages 26 to 42. This study showed that the correlation was greater among sons in the 1970 birth cohort (a rank correlation of around 0.31) than it had been in the 1956 birth cohort (a rank correlation of 0.20). In other words, the link between fathers’ and son’s income became stronger, so there is greater “stickiness”, or less mobility, between generations.[footnote 28] The study focused on sons because daughters often have intermittent careers due to maternity leave and caring responsibilities. This analysis confirmed findings from earlier analyses of the data by Blanden and colleagues.[footnote 29] Similar results were also found for the intergenerational persistence of poverty.[footnote 30]
A second study by Nicoletti and Ermisch used a different data source, the British Household Panel Study (BHPS). But this had to proxy (use an indirect measure of) parental income, since this was not directly measured in their data source. However, the study does cover a rather longer period – cohorts born from 1950 to 1972.[footnote 31] It found little evidence for an increase in the intergenerational association over the full period, with estimates hovering around 0.20. However, it did find some variations over time with an increase in the later cohorts, and so is not inconsistent with the findings of Blanden and colleagues. This raises the possibility that trends in relative income mobility might be rather volatile, perhaps reflecting transitory labour market conditions.[footnote 32]
A more recent study by Friedman and colleagues covers later birth cohorts (born 1979 to 1986) but, like Nicoletti and Ermisch’s study, had to proxy parental income from father’s occupation. This study obtained a much higher estimate of intergenerational persistence of 0.45.[footnote 33] Recent work by Bertha Rohenkohl using a more robust dataset (a combination of the BHPS and Understanding Society) produced estimates around 0.25, and slightly higher estimates using rank-rank correlation.[footnote 34] This work also found a north-south divide, with the south being more mobile.
Figure 2.6: Income mobility in the UK is slightly worse than the Organisation for Economic Co-operation and Development (OECD) average
Intergenerational income persistence: the estimated number of generations it would take for those born in low-income families to approach the mean income in their society.
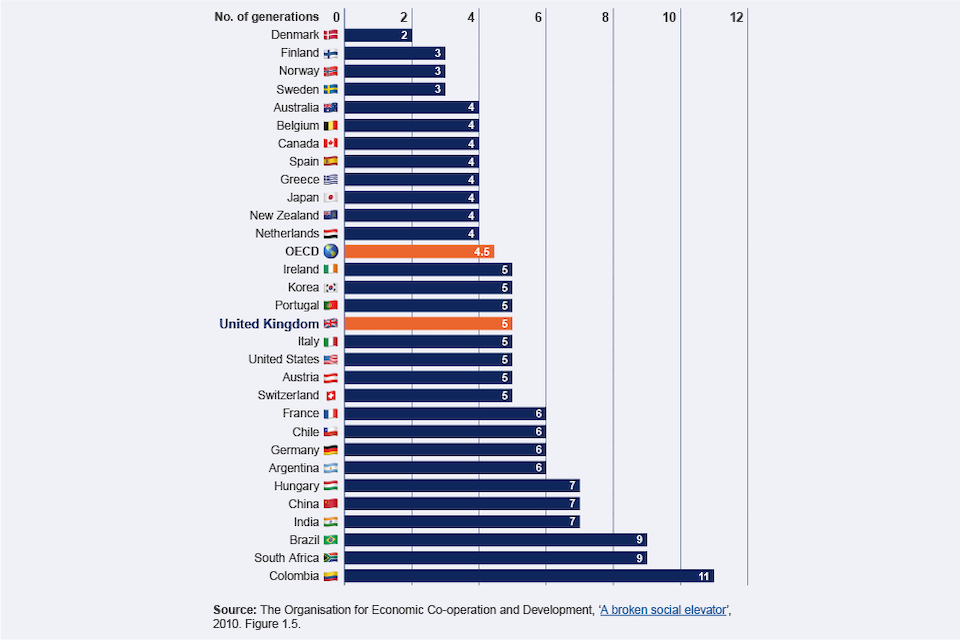
Source: The Organisation for Economic Co-operation and Development, ‘A broken social elevator’, 2010. Figure 1.5.
7. Mobility outcomes in the future
7.1 Occupational mobility in the long term
Given the slowing of growth in the proportion of professional and managerial jobs, the surplus of upward over downward occupational mobility is set to decline further. John Goldthorpe argues that “a situation is emerging that is quite new in modern British history, and one that could have far-reaching socio-political consequences… younger generations of men and women now face less favourable mobility prospects than did their parents, or their grandparents: that is, are less likely to experience upward mobility and more likely to experience downward mobility.”
Yet this could be seen not as a failure, but rather as a sign of success. There is less absolute upward mobility at least partly because the working class has shrunk and the professional class has grown. There is simply a smaller pool of people available to experience upward mobility, because more are already at the top. So in the future, we will look at the feasibility of a conditional absolute measure, which would concentrate on absolute upward mobility rates from the bottom.
As we noted in the section on relative occupational mobility, there is no good evidence that the relative chances of different groups are worsening. People from professional backgrounds have better chances, but this gap does not seem to be widening. It may well be shrinking.
7.2 Short-term prospects for mobility
The COVID-19 pandemic has impacted particularly harshly on young people from poorer backgrounds. These effects of COVID-19 are likely to have long-term consequences both in education and work.[footnote 35] In the short term, we can expect that its effects may adversely affect the social mobility chances of young people currently entering the labour market, and possibly in years to come.[footnote 36] However, as we report in C
chapter 4, recent unemployment rates for young people aged 16 to 24 years have decreased from what they were in 2020.
We also anticipate that, at least in the short term, the challenging set of economic circumstances we face in the UK may widen existing inequalities. This includes between:
-
different areas of the country
-
the majority and ethnic minority groups
-
disabled people and those without disabilities
-
the highly-educated and those with low qualifications
This is because recessions typically have greater adverse effects on more ‘marginal’ groups of workers, since they tend to be the first to lose their jobs, with consequent damage to their mobility prospects.[footnote 37] However, there is no clear sign of this yet.
To give a clearer short-term picture, the next chapter focuses on social mobility outcomes for those moving through education and the workforce. It looks at intermediate outcomes, such as young people’s educational attainment and transitions into work. This will help us to detect where things are currently getting better or potentially getting worse.
8. Case studies
8.1 Case study: Rodolfo Barradas, 30, from Leeds, Yorkshire

We moved to England from Portugal when I was 14. My dad worked in a food manufacturing factory and my mum worked as a hotel housekeeper. Because they both did minimum wage jobs with long, anti-social hours, and hadn’t been to university, their priority was to ensure that we focused on school and got a job with more long-term financial security.
Back in Portugal, my parents were really involved in my schoolwork but once we moved to England the language barrier meant that wasn’t possible. Instead, it was more often my brother and I helped out with translating in situations like at the bank or doctor’s.
I was thrown into year 10 at the local sixth-form school which was a bit of a shock, but the way I see it, you sink or swim. Luckily, I was incredibly fortunate with some of the teachers I had. In particular I remember 2 English teachers who were exceptional. They saw the language barrier not as something to overcome but as evidence of potential, and realised that if I could speak 2 languages it meant there was talent there.
Gradually, all the English I had learned in Portugal started to come back. After about a year, there was a big jump in my ability and things started to make sense. In year 10, when we were being taught English grammar, I realised that a lot of English grammar terms are Latin-based and very similar to Portuguese, so I recognised them instantly. My English teacher realised this and continued to help me push myself.
The head of science was an absolute star. She would take the time to stay behind with me after school and help me catch up. In the end, I got some really good GCSE and A-level results. That enabled me to study history and Italian at a Russell Group university.
After university, I did a mix of working in hospitality to pay the rent and doing projects in my free time. There were definitely lots of 7-day weeks, working 5 days in my waiter job, then doing arts marketing experience and job applications on my days off, and there were lots of rejections.
Because of my background, I had to really find the language to talk about my skills and experience by trial and error. Some of my friends could send their CVs and statements to their parents and get them to proofread and advise. I didn’t have that luxury.
I ended up getting a marketing assistant job at a theatre. I threw myself wholeheartedly into it and by the time I was 25, I was a marketing manager. Then I decided to leave the sector for the Civil Service. First, I moved into a communications role and now I am a policy advisor in the Department for International Trade.
The 15-year-old me would think it’s a bit wild. I work on things like the G7, trade negotiations and legislation. As an immigrant, I think you are sometimes more at ease with uncertainty. I don’t have an issue with change. I think that builds the confidence to know you can try things you haven’t tried before. I’ve always thought, “if that doesn’t work, I can try something else.”
For me, it’s about being okay with being uncomfortable and just really going for it, and perhaps faking that confidence to get you out the door!
8.2 Case study: Jordan Coulton, 27, from Bootle in Merseyside

I grew up in a town called Bootle in Merseyside. My parents didn’t go to university. My mum works for the National Health Service and my dad works at the supermarket Sainsbury’s. I always say I owe my life to my mum and dad because they taught me the most important thing is hard work and knowing that things don’t get handed to you on a plate.
They instilled in us that education is the gateway to success. You work hard, you revise. My mum was looking after 3 children. She’d put us in nursery, then go to work, and my dad was working nights. Seeing that engine running as a child, you realise hard work and getting up and doing something with your life are key.
I loved school. In sixth form, I had a psychology teacher who was an inspiration. She always said: “the only barriers you have are the ones you create in your mind.” I remember thinking, you’re so wise!
I had a place to study law at university but I remember going to visit and it just didn’t feel right. I also felt uncomfortable going into all that debt and having no guarantee of a job.
I deferred for a year, volunteered and worked part-time. Then I stumbled across this new apprenticeship in Liverpool in legal services at the law firm Weightmans, with training provided by Damar Training. I researched the company and thought, ‘you know what, I’m going to apply.’
As soon as I got the job, it felt right and I cancelled my place at university. Within 3 months, I started handling files and assisting on substantive legal work. Knowing the law is about 40% of being a lawyer. The rest are those practical skills: communication, negotiation, public speaking. That’s what being an apprentice teaches you.
I got a job on the regulatory team in November 2017 and qualified into this department. For the past 14 months, I’ve been working on the undercover policing inquiry, which is investigating the work of a covert unit based in the Metropolitan Police from 1968 to 2008. Who would have thought it! Little old Jordan from Bootle!
In the future, I want to go all the way to partnership at Weightmans. I feel like there is more security in doing an apprenticeship with a law firm. You know its ethos, you know its values, and if the company takes you on, you know you’ll be able to move up and progress quickly.
8.3 Case study: Daniel Dipper, 19, from Oxford

Neither of my parents went to university. My dad works as a computer software tester. My mum used to be a charity shop manager, but she gave up work when she had me. My family struggled financially a bit. When I needed books my parents would buy them for me. But the roof was falling down for a number of years. We put little buckets out! It wasn’t the most luxurious lifestyle.
I wasn’t really stretched in primary school. Academically I did really well. Socially I didn’t have many friends. The expectations were really low. I’d do all the work for the day in an hour and then they’d say read a book. Fortunately the council helped by paying for us to join Potential Plus, which assists children with high learning potential who may need extra support.
At secondary level, the school I went to – Sir Harry Smith Community College in Peterborough - was a regular comprehensive. Mr Royal was a standout case in terms of how far a teacher could go. It was a class where you knew there would be high expectations and that you’d be pushed. He was very responsive in terms of feedback and setting targets. I was predicted to get a level 7 in GCSE English language and literature but I walked out with an 8 and 9. He’d share ideas and challenge us to think in new ways.
He ran the school debating club. It encouraged me to think on my feet, and build skills. Confidence, style, using well-targeted examples; these are all things I’ve had to use at Oxford University.
When it came to writing my personal statement for my university application, he helped me reshape it. The mini-tutorial he gave me helped me change my personal statement from something bog-standard into something that reflected my passions. I thought of my own ideas, but he pushed me to find a theme.
Now I’m a second-year history and politics student at Magdalen College, Oxford. I’m the undergraduate president at my college and the vice-president of the Oxford Union. I’ve recorded speeches that are on YouTube that have tens of thousands of views. I’m using many of the debating skills I developed at school.
Mr Royal played a crucial role in that. Oxbridge is all about flexible thinking and he really encouraged that process.
Adam Royal, 41, from Peterborough in Cambridgeshire

The ethos of Sir Harry Smith Community College is “aspiration for all”. One of the misconceptions is that students in state comprehensive schools aren’t motivated to become high achievers whereas my experience is that the majority of my students want to learn, want to be engaged, and want to have cultural capital.
I heard about Daniel before I taught him as he would sometimes mark his own books. He was very single-minded at a young age. I thought, I’d better be ready for this student!
With high ability students, I think the key is thorough preparation. They will often ask you to justify your thoughts on a text.
It’s also important they can see you think through a problem. When you go for interviews at Russell Group universities, they’re not looking for you to blurt out an answer, they’re looking for you to demonstrate your thought process. It’s about having a dialogue with the student, rather than spoon-feeding them. Letting them know it’s okay for them to disagree with what you’re saying and make a compelling case for their own thoughts.
Daniel was very good at speaking in front of people and you could see that sort of confidence and ability to perform rhetorically would be suitable for the Debate Society, which I ran with a colleague. Debate societies are probably more de rigueur in fee-paying schools. But if you pick up that a student is ambitious it’s helpful to find a place where they can find their voice so that when they go to university they’re not intimidated.
With regards to Daniel, we always knew very early on he was going to apply to Oxford University. I read his personal statement and gave him some tips as part of a larger group of people working with him.
What I admire about Daniel is he was always very independent and for a student to go from a comprehensive school to an institution like Oxford and be vice-president of the debating society, it’s clearly stood him in good stead.
8.4 Case study: Jordan O’Sullivan, 21, from Uxbridge in west London
Two weeks after I was born, I was diagnosed with cerebral palsy. While being in a wheelchair is often seen as negative, if anything I feel empowered. When I was born, I wasn’t supposed to make it through the night. Now I’m doing things I never thought possible.
My dad passed away shortly after I was born. He was not a nice person and social services were involved at one point. My mum left school at age 18 and gave up her job as a retail manager to look after me. I’m very grateful to her for that and how she’s shaped me as a human being.
As a child, my mum helped me with homework. She would take me to tutors at Explore Learning where I could go and further develop my skills. She was a key person in my education and she gave me the confidence to learn what I wanted. Without her, I wouldn’t have been able to go to West Herts College.
I stayed with my mum in the week and my nan at the weekend. My nan was the one who taught me life skills. How to cook, clean, manage money, how to use public transport.
In 2012, my mum got diagnosed with cancer. When I was first looking at West Herts College she wasn’t well enough to go and view it, so I went on my own. But she had given me the skills I needed to decide if it was the right place for me.
She passed away just as I was finishing my GCSEs and I was put in the foster care system.
During my second year of studying music at West Herts College, it all hit me. Luckily I was very well supported. My teacher Jason was very easy to approach and easy to talk to. He would sit down and give one-to-ones, give me recommendations for universities and did extra lunchtime lessons once our workload increased.
I was inspired by what he had achieved. He has gone on tour with some pretty big names. Being around someone like Jason who has achieved so much, but they’re just a normal person, not wealthy or connected. It made me think if he can achieve it, I can as well.
I’m now in my second year of a degree in music at Brunel University. To be honest, without Jason’s support I don’t know if I’d be here. There were times when I just wanted to quit. Jason said: “If you want to do that, I can’t stop you, but I think you’d regret it.”
When my mum first passed away it was difficult to find the motivation to get out of bed each morning. But to have overcome all these barriers and now be sitting here in my own flat studying at university? I’m proud of myself and what I’ve done.
Jason Houlihan, from Watford in Hertfordshire

I attended West Herts College as a student and met a teacher who was the father figure I never had. He had this method of being brutally honest but in a way that allowed you to build back up. It was a life-changing experience for me and I knew my goal was to come back and carry on that tradition.
When Jordan arrived, I knew a bit about his background and I wanted to make sure he was getting the support he needed. I think he picked up on that and trusted me because he knew it was about more than the work.
At first, he was very shy. We worked on smiling and connecting with people, as I often do with students who are particularly nervous. I might challenge them to go out in their lunchbreak and smile at 5 people and tell me what happened. The music industry is all about teamwork and you need those small interactions to build the social skills that help you connect with the people who matter.
Jordan was interested in being a presenter, so I suggested that he start a YouTube channel. He reviewed disabled access on the underground, started a social media account and began putting up pictures and videos. Over time he started going out more on his own. I would ask him for a debrief on where he’d been. We called it “Jordan’s adventures”.
His confidence built and over time he got quite sassy! We worked on performance techniques in lessons and I gave an example from my working life of an occasion when a PA system blew up and I had to improvise.
Coincidentally the same thing happened at Jordan’s end-of-year gig. He was put in a really vulnerable position, decided to roll with it and started busting out some jokes. He realised he could put himself in vulnerable situations and come out of them confident.
With all students, we have target, progress and attainment sessions. If they’re not planning on applying to university, I’ve made it a mandatory requirement to work on a 5-year development plan as I have seen too many students leaving without knowing where they are going.
Initially Jordan was unsure about university but I encouraged him to apply anyway, as his mindset might change. He accepted a place, but didn’t know if he was going to go.
I think when he did the end-of-year performance he was like, “yeah, I think I can do this and I have the strength to cope.”
-
The proportion of people who have reached a different occupational class from their parents. ↩
-
David Glass, ‘Social mobility in Britain’, Published on ACADEMIC.OUP.COM; John Goldthorpe, ‘Social Mobility and Class Structure in Modern Britain’,1980. Published on SEMANTIC SCHOLAR.COM; Anthony Heath, ‘Social Mobility’, 1981. Published on CAMBRIDGE.ORG. ↩
-
Richard Breen and Walter Müller, Education and intergenerational social mobility in Europe and the United States, 2020. Published on stanford.universitypressscholarship.com; Erzsébet Bukodi and John Goldthorpe, Social mobility and education in Britain: research, politics and policy, 2019. Published on cambridge.org; Robert Manduca and others, Trends in absolute income mobility in North America and Europe, 2020. Published on iza.org. ↩
-
Jo Blanden, Paul Gregg and Stephen Machin, ‘Educational inequality and intergenerational mobility,’ in Stephen Machin and Anna Vignoles (editors) What’s the good of education? The economics of education in the UK, 2005. Published on press.princeton.edu. ↩
-
ONS collects, analyses and shares statistics about the UK’s economy, society and population. ↩
-
Self-employed and doesn’t have employees. ↩
-
Many occupations that would be classified as NS-SEC 7 can instead fall into NS-SEC 4 if the worker is self-employed. ↩
-
Oxford Reference, Goldthorpe class scheme, Published on oxfordreference.com. ↩
-
The Office for National Statistics, ‘Earnings and hours worked, occupation by four-digit SOC: ASHE table 14’, 2021 provisional data. Published on ONS.GOV.UK. ↩
-
The Office for National Statistics, ‘Earnings and hours worked, occupation by four-digit SOC: ASHE table 14’, 2021 provisional data. Published on ONS.GOV.UK. ↩
-
Erzsébet Bukodi and John Goldthorpe, Social mobility and education in Britain, 2019. Published on cambridge.org. ↩
-
Erzsébet Bukodi and John Goldthorpe, Social mobility and education in Britain, 2019. Published on cambridge.org. ↩
-
Historically, more occupational mobility data was available for men than for women. This largely reflects social and economic conditions of the early 20th century. However, others report on both men and women, as their data sources differ from those used here. We recognise this is a really interesting area of social mobility studies and one we want to look at in more detail in future. ↩
-
Erzsébet Bukodi and John Goldthorpe, Social mobility and education in Britain, 2019. Published on cambridge.org. ↩
-
The story is complicated, however, by the different patterns of intragenerational mobility that men and women experience. While gender differences are quite small during early career stages, women are less likely than men to experience upward mobility later in their careers and they are more likely to experience downward mobility: Erzsébet Bukodi and John Goldthorpe, Social mobility and education in Britain, 2019. Published on cambridge.org; Erzsébet Bukodi and Marii Paskov, Intergenerational class mobility among men and women in Europe: gender differences or gender similarities?, 2020. Published on. academic.oup.com. ↩
-
Erzsébet Bukodi and John Goldthorpe, Social mobility and education in Britain, 2019. Published on cambridge.org. ↩
-
Erzsébet Bukodi and John Goldthorpe, Social mobility and education in Britain, 2019. Published on cambridge.org; Erzsébet Bukodi and others, The mobility problem in Britain: new findings from the analysis of birth cohort data, 2015. Published on Department of Social Policy and Intervention, OUP, UK; Franz Buscha and Patrick Sturgis, Declining social mobility? Evidence from five linked censuses in England and Wales 1971-2011, 2018. Published on eprints.soton.ac.uk. ↩
-
Erzsébet Bukodi and others, The mobility problem in Britain: new findings from the analysis of birth cohort data, 2015. Published on Department of Social Policy and Intervention, OUP, UK ↩
-
Economists have suggested that there has been rising within-class income inequality (such as Jo Blanden and others, Intergenerational persistence in income and social class: the impact of within-group inequality, 2013. Published on ROYAL STATISTICAL SOCIETY ONLINELIBRARY.WILEY.COM. Although this has been disputed by Erzsébet Bukodi and John Goldthorpe, Social mobility and education in Britain: research, politics and policy, 2019. Published on CAMBRIDGE.ORG. ↩
-
Robert Erikson and John Goldthorpe, The constant flux: a study of class mobility in industrial societies, 1992. Published on ACADEMIC OUP.COM; John Goldthorpe and Colin Mills, Trends in intergenerational mobility class mobility in Britain in the late twentieth century, in Richard Breen (editor), Social mobility in Europe, 2004. Published on UNIVERSITYPRESSSCHOLARSHIP.COM. ↩
-
Anthony Heath and Geoff Payne, Social mobility, in Albert Halsey and Josphine Webb (editors), ‘Twentieth-century British social trends’, 2000. Published on SEMANTIC SCHOLAR.COM; John Ermisch and Marco Francesconi, ‘Intergenerational mobility in ‘Britain: new evidence from the British Household Panel Study’, 2004. Published on CAMBRIDGE.ORG; Paul Lambert and others, ‘By slow degrees: two centuries of social reproduction and mobility in Britain’, 2007. Published on SOCRESONLINE.ORG.UK; Yaojun Li and Fiona Devine, ‘Is social mobility really declining? Intergenerational class mobility in Britain in the 1990s and the 2000s’, 2011. Published on SOCRESONLINE.ORG.UK; Erzsébet Bukodi and others, ‘The mobility problem in Britain: new findings from the analysis of birth cohort data’, 2015. Published on DEPARTMENT OF SOCIAL POLICY AND INTERVENTION.ACADEMIC.OXFORD UNIVERSITY PRESS.UK; Franz Buscha and Patrick Sturgis, ‘Declining social mobility? Evidence from five linked censuses in England and Wales’, 2018. PUBLISHED ON EPRINTS.SOTON.AC.UK.;. Bell and others, ‘Where is the land of Hope and Glory? The geography of intergenerational mobility in England and Wales’, 2019. Published on CENTRE FOR ECONOMIC PERFORMANCE LSE.AC.UK. ↩
-
Erzsébet Bukodi and John Goldthorpe ‘Social mobility and education in Britain: research, politics and policy’, 2019. Published on CAMBRIDGE.ORG; Geoff Payne, ‘The new social mobility: how the politicians got it wrong’, 2017. Published on BRISTOL UNIVERSITY PRESS.CO.UK. ↩
-
Anthony Heath and others, ‘Social progress in Britain’, 2018. Published on OXFORDUNIVERSITYPRESS.COM. ↩
-
The Organisation for Economic Co-operation and Development, ‘A broken social elevator’, 2010. Published on OECD.ILIBRARY.ORG. Erzébet Bukodi and others’ findings based on the ESS. ↩
-
Raj Chetty and others, ‘The fading American dream: trends in absolute income mobility since 1940’, 2017. Published on PUBMED.GOV. ↩
-
Institute of Labor Economics, ‘Trends in Absolute Income Mobility in North America and Europe’, 2020. Published on IZA.ORG. ↩
-
Gregg, Macmillan and Vittori (2017). This study presents a range of estimates in order to take account of various biases, such as attenuation bias, life-cycle bias, and spells of worklessness. We report the rank correlations, rather than the elasticity, because rank correlations appear to be much less affected by these biases. The correlations reported here are from table 6. ↩
-
Jo Blanden and others, ‘Changes in intergenerational mobility in Britain’, in Miles Corak (editor) ‘Generational income mobility in North America and Europe’, 2004. Published on CAMBRIDGE.ORG. Respondents not in employment at the re-interview date were excluded from the analysis. See also Jo Blanden and Stephen Machin, ‘Up and down the generational income ladder in Britain: past changes and future prospects’, 2008. Published on CAMBRIDGE.ORG; Paul Gregg and others, ‘Moving towards estimating sons’ lifetime intergenerational economic mobility’, 2017. Published on ONLINELIBRARY.WILEY.COM for further analyses and revised estimates using essentially the same data. ↩
-
Jo Blanden and Steve Gibbons, ‘Persistence of poverty across generations: a view from two British cohorts’, 2006. Published on JOSEPH ROWNTREE FOUNDATION.ORG.UK. ↩
-
Cheti Nicoletti and John Ermisch, ‘Intergenerational earnings mobility: changes across cohorts in Britain’, 2007. Published on DEGRUYTER.COM. The study was confined to men (and their fathers) only and estimated income from data on father’s occupation, employment status, education and age. ↩
-
A comparable study in the US also found hard-to-explain temporal variations in the strength of association – Susan Mayer and Leonard Lopoo, ‘Has the intergenerational transmission of economic status changed?’, 2005. Published on JSTOR.ORG. ↩
-
Sam Friedman and others, ‘Social mobility, the class pay gap and intergenerational worklessness: new insights from the Labour Force Survey’, 2017. Published on GOV.UK. However, the study obtained a lower estimate of 0.27 when using a rank-rank estimator, which is now generally preferred to the log-log estimator previously used to measure the association (termed ‘elasticity’ by economists). However, Friedman and others’ higher estimate is in line with estimates from later analysis of British Cohort Study data, using average parental income and later sons’ earnings to reduce effects of measurement error and life-cycle bias, see Paul Gregg and others, ‘Moving towards estimating sons’ lifetime intergenerational economic mobility’, 2017. Published on ONLINELIBRARY.WILEY.COM. ↩
-
Bertha Rohenkohl Intergenerational income mobility in the UK: new evidence using the British Household Panel Survey and Understanding Society, ‘Sheffield economic research paper series’, 2019. Published on SHEFFIELD.AC.UK. ↩
-
Richard Blundell and others, ‘COVID-19 and inequalities’, 2020. Published on ONLINELIBRARY.WILEY.COM; Monica Costa Dias and others, ‘COVID-19 and the career prospects of young people’, 2020. Published on IFS.ORG.UK. ↩
-
Wiji Arulampalam and others, ‘Unemployment scarring’, 2001. Published on ACADEMIC.OUP.COM; Paul Gregg and Emma Tominey, ‘The wage scar from male youth unemployment’, 2005. Published on SCIENCEDIRECT.COM. ↩
-
Tom Clark and Anthony Heath, ‘Hard times: the divisive toll of the economic slump’, 2014. Published on YALEBOOKS.CO.UK. ↩