NCARDRS statistics 2017: summary report
Updated 29 September 2021

© Crown copyright 2021
This publication is licensed under the terms of the Open Government Licence v3.0 except where otherwise stated. To view this licence, visit nationalarchives.gov.uk/doc/open-government-licence/version/3 or write to the Information Policy Team, The National Archives, Kew, London TW9 4DU, or email: psi@nationalarchives.gov.uk.
Where we have identified any third party copyright information you will need to obtain permission from the copyright holders concerned.
This publication is available at https://www.gov.uk/government/publications/ncardrs-congenital-anomaly-annual-data/ncardrs-statistics-2017-summary-report
This document summarises the National Congenital Anomaly and Rare Disease Registration Service (NCARDRS) congenital anomaly statistics 2017 report.
It is the third annual congenital anomaly statistics released by NCARDRS. The report contains information on congenital anomalies detected in babies delivered between 1 January and 31 December 2017.
1. About NCARDRS
NCARDRS is a comprehensive registration service that collects and quality assures data on congenital anomalies and rare diseases in England.
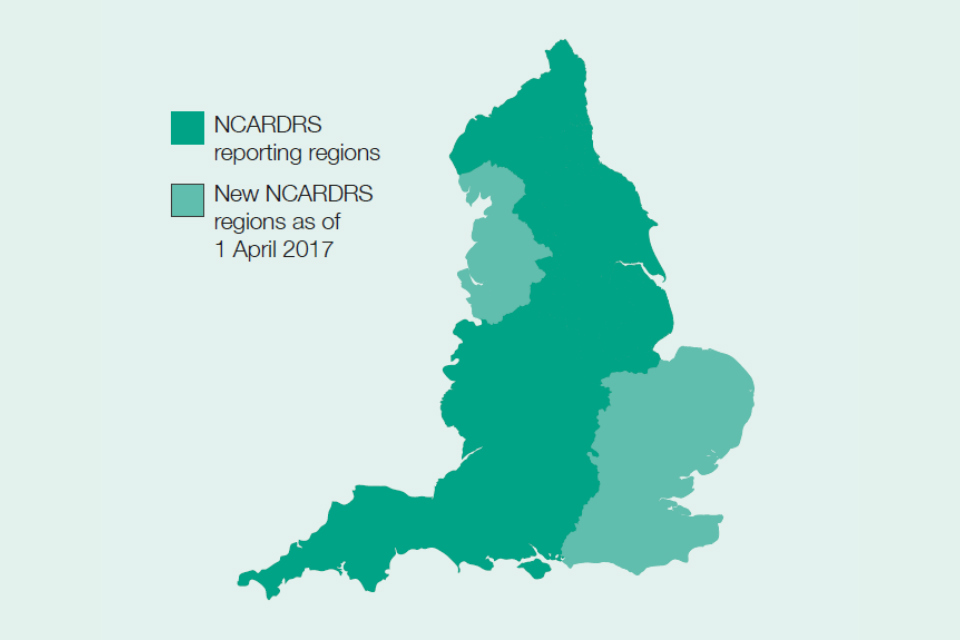
NCARDRS is made up of 10 regions, and information in this report is predominately based on data collected from the 7 existing reporting regions.
In addition, 3 new regions covering the East of England, London and the South East, and the North West were established and started data collection from 1 April 2017. Data on Down’s syndrome, Edwards’ syndrome and Patau’s syndrome is presented for the whole of England for 2015 to 2017.
NCARDRS looks forward to presenting, for the first time in England, national coverage of further congenital anomalies and will be able to report on this data in our 2018 report, due out in 2020.
This important and reliable information is available for clinicians, researchers, patients and their families thanks to the dedication of notifying healthcare professionals.
2. 2017 Prevalence
Congenital anomalies are defined as being present at delivery, probably originating before birth, and include structural malformations and chromosomal, genetic and biochemical conditions.
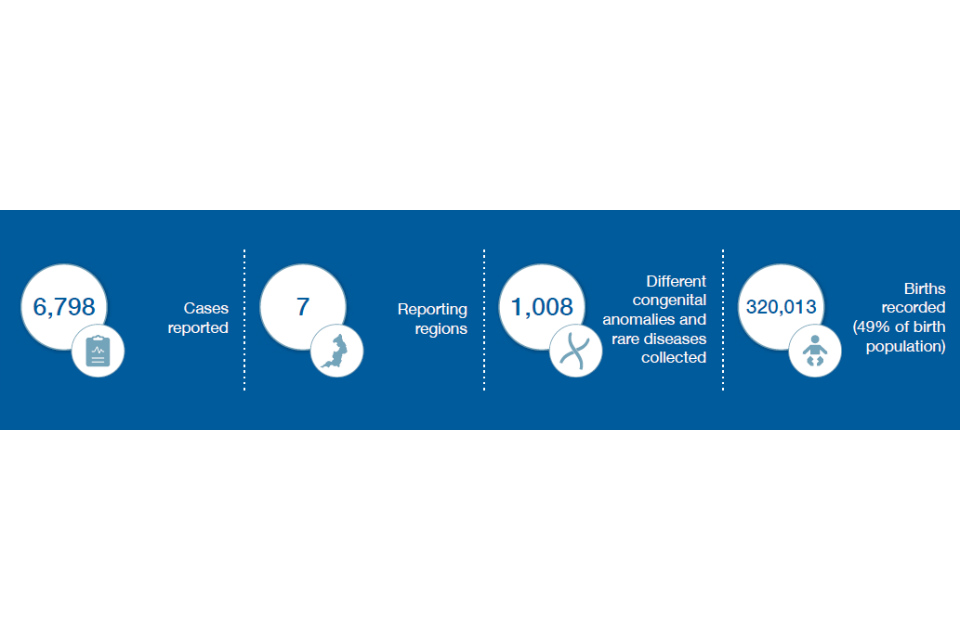
NCARDRS currently collects data on 1,008 different congenital anomalies and rare diseases. In 2017, there were a total of 6,798 babies with one or more congenital anomalies notified to the 7 NCARDRS reporting regions covering 320,013 total births (live births and stillbirths).
This gives an overall birth prevalence for these regions of 212.4 per 10,000 total births – or 1 in 47. A total of 72.6% of babies diagnosed with a congenital anomaly resulted in a live birth – or 1 in every 66 live births.
Some babies have more than one anomaly. A total of 63 babies delivered in 2017 had an additional structural anomaly, as well as a chromosomal anomaly, and a serious cardiac anomaly.
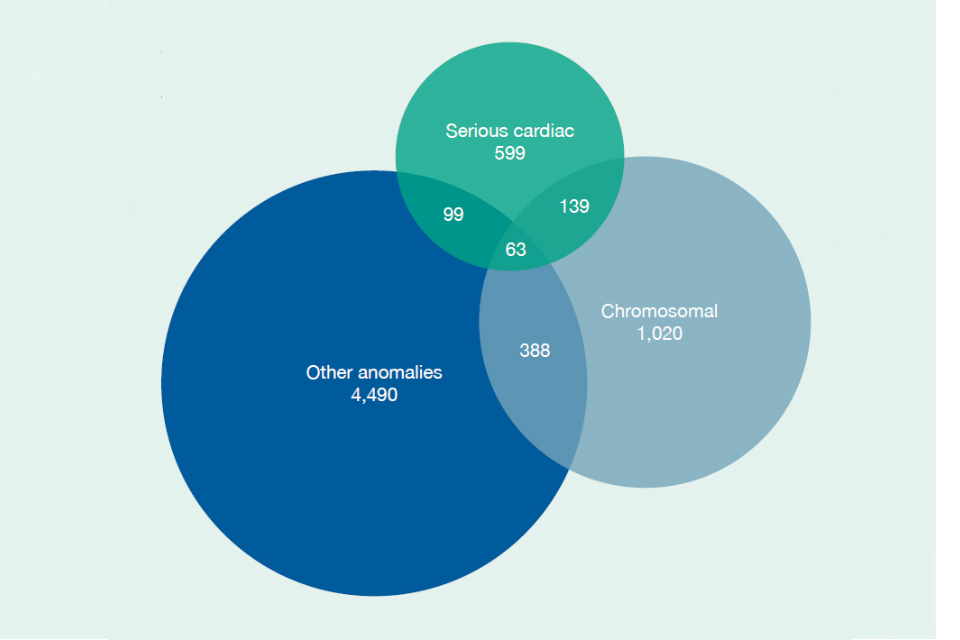
Figure 1: An example of the overlap of severe cardiac, chromosomal and other anomalies, in 7 NCARDRS reporting regions, 2017
3. Timing of diagnosis
Some congenital anomalies are detectable during pregnancy and others are not. Screening programmes are offered by NHS maternity services to maximise antenatal detection of specified conditions where women choose and present in time to have screening.
In 2017, the timing of first diagnosis was known for 6,211 babies (91.4%) and of these, 62.2% of pregnancies affected by congenital anomaly were detected antenatally. Abdominal wall (91%) and nervous system (83%) anomalies are the most likely to be detected antenatally.
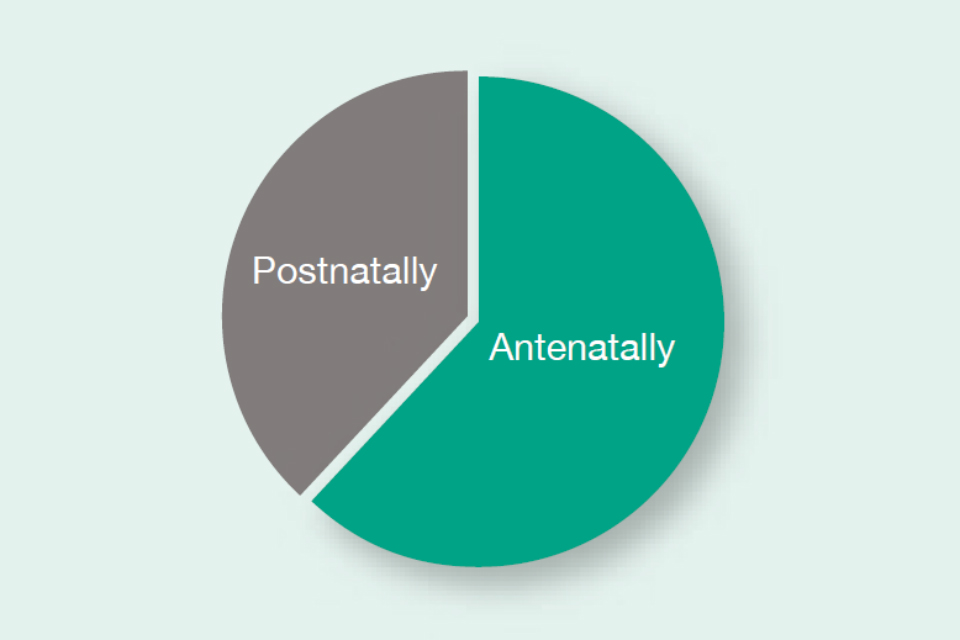
Figure 2: Timing of first diagnosis in 7 NCARDRS reporting regions, 2017
4. Perinatal and infant mortality
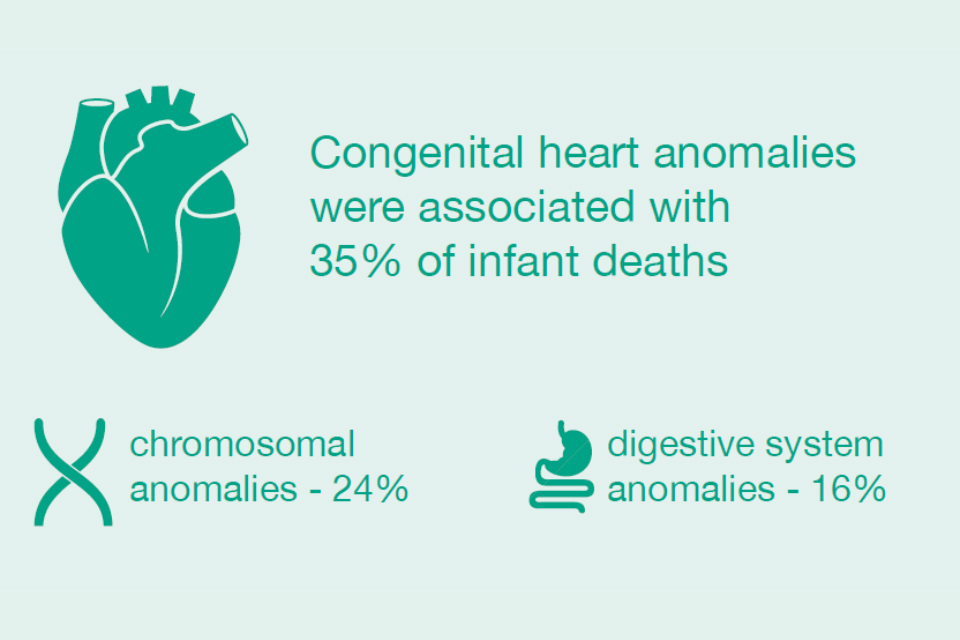
Of the 4,867 live-births diagnosed with a congenital anomaly, 310 died in infancy, giving an infant mortality rate of between 8.7 and 10.9 per 10,000 live births. Congenital heart anomalies accounted for 35% of infant deaths, followed by chromosomal anomalies (24%) and digestive system anomalies (16%).
5. Maternal age
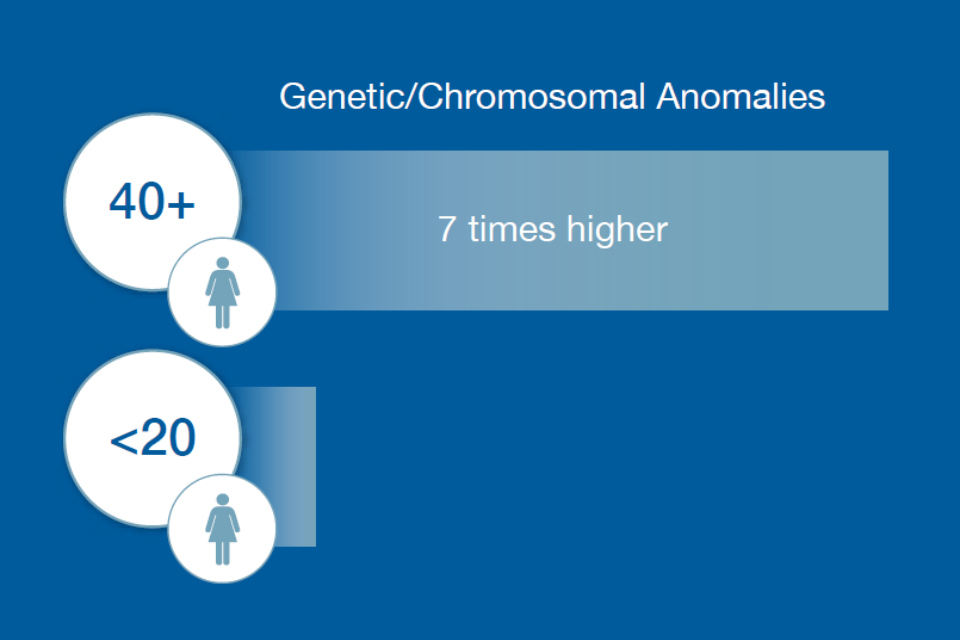
Lower and higher maternal age are linked with an increase in certain congenital anomalies. Data recorded in 2017 shows prevalence of genetic chromosomal anomalies was approximately 7 times higher in older mothers (women aged 40+) compared with younger mothers (women aged less than 20). Some structural anomalies are more common in younger women, gastroschisis is most common in women aged less than 20 years.
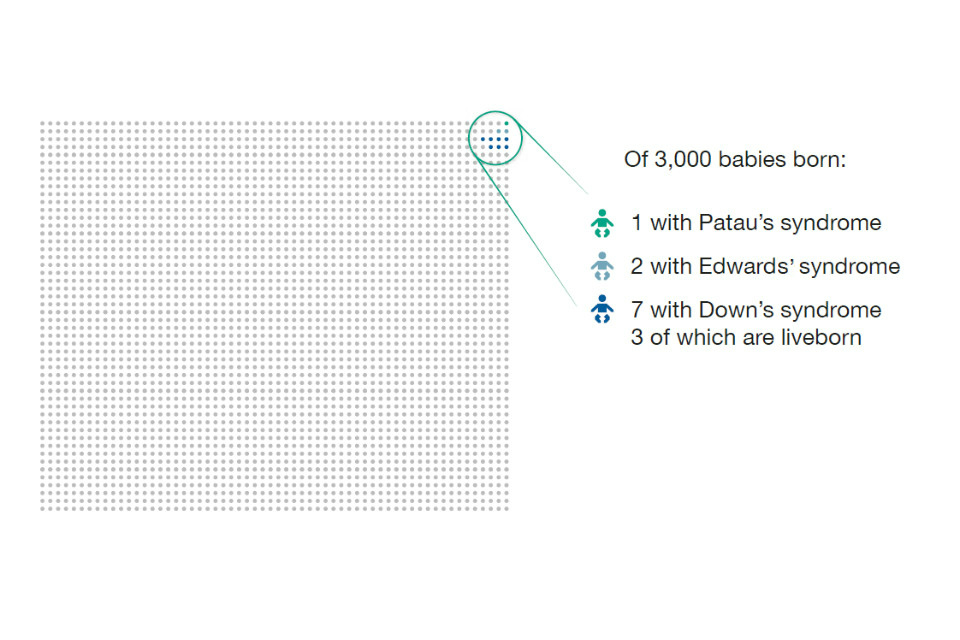
6. Down’s syndrome, Edwards’ syndrome and Patau’s syndrome 2017
This report demonstrates further progress toward achieving national data collection, the data on Down’s syndrome, Edwards’ syndrome and Patau’s syndrome is presented for England for 2015 to 2017.
The prevalence per 10,000 total births for Down’s syndrome was 28.3 (95% CI: 27.6-29.1), or 1 for 353 total births, 8.4 (95% CI: 8.0-8.8), or 1 for 1,190 for Edwards’ syndrome and 3.5 (95% CI: 3.2-3.7), or 1 for 2,857 total births for Patau’s syndrome respectively.