EMHP wastewater monitoring of SARS-CoV-2 in England: 1 June to 10 January 2022
Updated 31 January 2022

© Crown copyright 2022
This publication is licensed under the terms of the Open Government Licence v3.0 except where otherwise stated. To view this licence, visit nationalarchives.gov.uk/doc/open-government-licence/version/3 or write to the Information Policy Team, The National Archives, Kew, London TW9 4DU, or email: psi@nationalarchives.gov.uk.
Where we have identified any third party copyright information you will need to obtain permission from the copyright holders concerned.
This publication is available at https://www.gov.uk/government/publications/monitoring-of-sars-cov-2-rna-in-england-wastewater-monthly-statistics-1-june-2021-to-10-january-2022/emhp-wastewater-monitoring-of-sars-cov-2-in-england-1-june-to-10-january-2022
Data showing the concentration of SARS-CoV-2 RNA and variants of concern (VOCs) detected in wastewater and the number of Omicron variant detections in wastewater, as part of the Environmental Monitoring for Health Protection (EMHP) wastewater monitoring programme. New additions to this monthly publication include Omicron detections in wastewater from 22 November 2021 to 2 January 2022.
Please note that, due to a decrease in the number of wastewater samples taken over the Christmas period, concentration data for the period 21 December to 27 December 2021 and Omicron detection data for the period 20 December to 26 December 2021 are not included in this publication.
Background on the EMHP wastewater monitoring programme
People infected with coronavirus (COVID-19) shed the virus during daily activities such as going to the toilet and blowing their nose. The virus enters the sewer system through sinks, drains and toilets. Fragments of SARS-CoV-2 (the virus that causes COVID-19) can be detected in samples of wastewater (untreated sewage).
The EMHP programme is led by the UK Health Security Agency (UKHSA) and run in partnership with the Department for Environment, Food and Rural Affairs (Defra), the Environment Agency (EA), the Centre for Environment, Fisheries and Aquaculture Science (Cefas), academia, and water companies. It provides coverage of approximately 40 million people across England. The EMHP team coordinates with programmes in the devolved administrations to provide UK-wide wastewater monitoring. The programme tests sewage for fragments of SARS-CoV-2 RNA. Untreated influent samples are taken from approximately 275 sewage treatment works (STWs) in England, 3 times a week (see figures 1 to 9). EMHP also samples from sewer network sites (manholes). Untreated influent samples are taken from approximately 195 sewer network sites in England 4 times a week. Data from sewer network sites is not included in the concentration data in this publication as these sites generally fall within sewage treatment work (STW) catchments. Data from sewer network sites is included in the Omicron detection data in this publication. Further detail about EMHP wastewater coverage can be found in the publication Wastewater testing coverage data for the Environmental Monitoring for Health Protection (EMHP) programme.
The programme helps identify where the virus is circulating in England as well as detecting mutations of the virus, including those associated with known VOCs, and variants under investigation (VUIs). Findings are reported to national decision makers and local stakeholders on a regular basis, helping to inform national strategy and localised action. Wastewater analysis has the benefit of detecting the virus regardless of whether people have symptoms or whether they are tested. Wastewater monitoring complements other testing programmes and public health actions to help protect against the threat of new variants.
As the threat of variants has emerged, the programme has played a key role in the detection of mutations of the virus, including those associated with known VOCs and VUIs. This is achieved through genomic sequencing of wastewater samples, to provide an indication of where VOCs and VUIs may be present across England. Findings are reported to national decision makers and local stakeholders on a regular basis, helping to inform national strategy and localised action. Wastewater analysis has the benefit of detecting the virus regardless of whether people have symptoms or whether they are tested. Wastewater monitoring complements other testing programmes and public health actions to help protect against the threat of new variants.
Wastewater variant detection data (Omicron variant only) included in the Investigation of SARS-CoV-2 variants: technical briefings is now available in this month’s publication as experimental statistics. We are exploring the feasibility of adding more variant detection data in future releases. We continue to develop our approach for identifying variants and mutations in wastewater. The data presented in this publication is generated by non-accredited research laboratories and should be considered experimental. Formal validation of wastewater monitoring as a variant surveillance system is underway. EMHP advises caution when directly comparing data from STWs and concentration of SARS-CoV-2 RNA in wastewater with clinical testing data. Wastewater detections of a variant are reported as either confirmed or possible, based on the number of signature or unique single nucleotide polymorphisms (SNPs), and co-occurrence on the same amplicon. This describes the level of confidence EMHP has in the specificity of the detection; ‘confirmed’ status is assigned when there is a high degree of confidence the variant is present, ‘possible’ is assigned where there is some evidence that the variant is present. These definitions are different to the clinical case definitions and the 2 should not be compared. Lack of a positive sequencing result is not necessarily confirmation that no variant cases reside within a given geography, due to factors such as rainfall dilution impacting RNA recovery.
Interpretation of all data in this publication should be made with careful consideration of the points in the Uncertainty, data quality and revisions section.
EMHP sampling sites
EMHP samples at sewer network sites (manholes in the street which generally serve a local area) and STWs (which generally serve wider areas such as a city or town). Associated with every STWs and sewer network site is a catchment, the geographical area from which wastewater flows into the sampling location. EMHP SARS-CoV-2 RNA concentrations data from sewer network sites is not included in this publication as these sites generally fall within STW catchments. In addition, EMHP changes sampling strategy and locations of sewer network sites to meet epidemiological priorities (for example to support local public health responses). Further detail about EMHP wastewater coverage can be found in the publication Wastewater testing coverage data for the Environmental Monitoring for Health Protection (EMHP) programme.
Figures 1 to 9 show the location of STWs that EMHP samples at in each region.
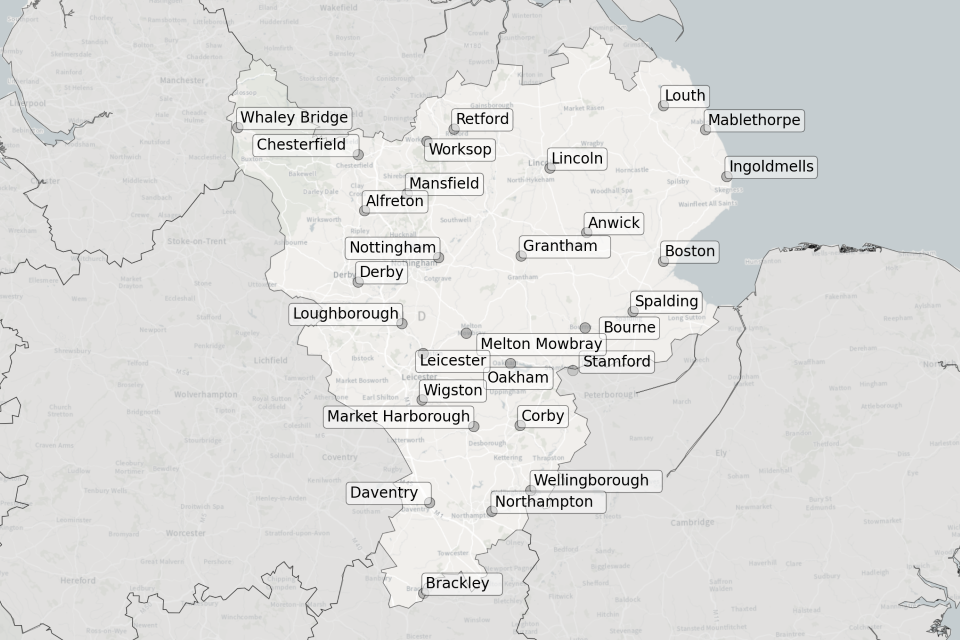
Figure 1. Map showing the location of STWs sampled in the East Midlands.
Location of STWs sampled in the East Midlands:
- Alfreton
- Anwick
- Boston
- Bourne
- Brackley
- Chesterfield
- Corby
- Daventry
- Derby
- Grantham
- Ingoldmells
- Leicester
- Lincoln
- Loughborough
- Louth
- Mablethorpe
- Market Harborough
- Mansfield
- Melton Mowbray
- Northampton
- Nottingham
- Oakham
- Retford
- Spalding
- Stamford
- Wellingborough
- Whaley Bridge
- Wigston
- Worksop
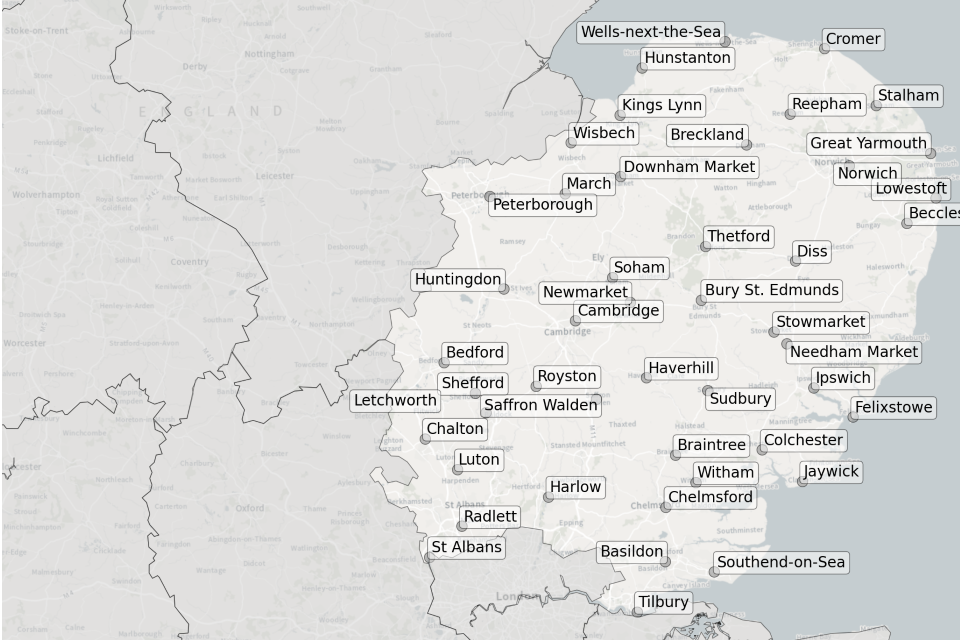
Figure 2. Map showing the location of STWs sampled in the East of England.
Location of STWs sampled in the East of England:
- Basildon
- Beccles
- Bedford
- Braintree
- Breckland
- Bury St Edmunds
- Cambridge
- Chalton
- Chelmsford
- Colchester
- Cromer
- Diss
- Downham Market
- Felixstowe
- Great Yarmouth
- Harlow
- Haverhill
- Hunstanton
- Huntingdon
- Ipswich
- Jaywick
- Kings Lynn
- Letchworth
- Lowestoft
- Luton
- March
- Needham Market
- Newmarket
- Norwich
- Peterborough
- Radlett
- Reepham
- Royston
- Saffron Walden
- Shefford
- Soham
- St Albans
- Stalham
- Stowmarket
- Sudbury
- Southend-on-Sea
- Thetford
- Tilbury
- Wells-next-the-Sea
- Wisbech
- Witham
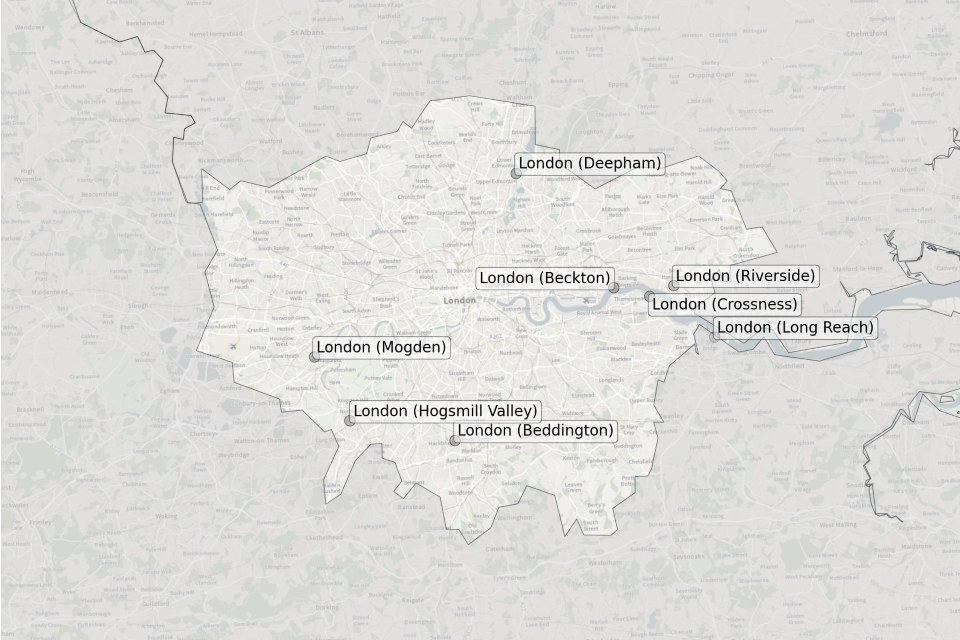
Figure 3. Map showing the location of STWs sampled in London.
Location of STWs sampled in London:
- Beckton
- Beddington
- Crossness
- Deepham
- Hogsmill Valley
- Long Reach
- Mogden
- Riverside
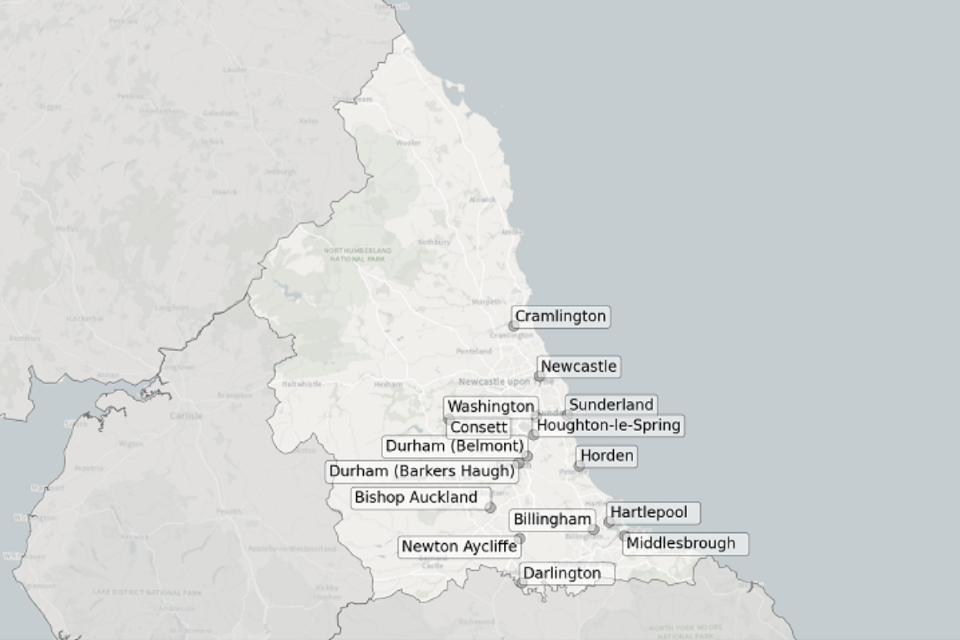
Figure 4. Map showing the location of STWs sampled in the North East.
Location of STWs sampled in the North East:
- Billingham
- Bishop Auckland
- Consett
- Cramlington
- Darlington
- Durham (Barkers Haugh)
- Durham (Belmont)
- Hartlepool
- Horden
- Houghton-le-Spring
- Middlesbrough
- Newcastle
- Newton Aycliffe
- Sunderland
- Washington
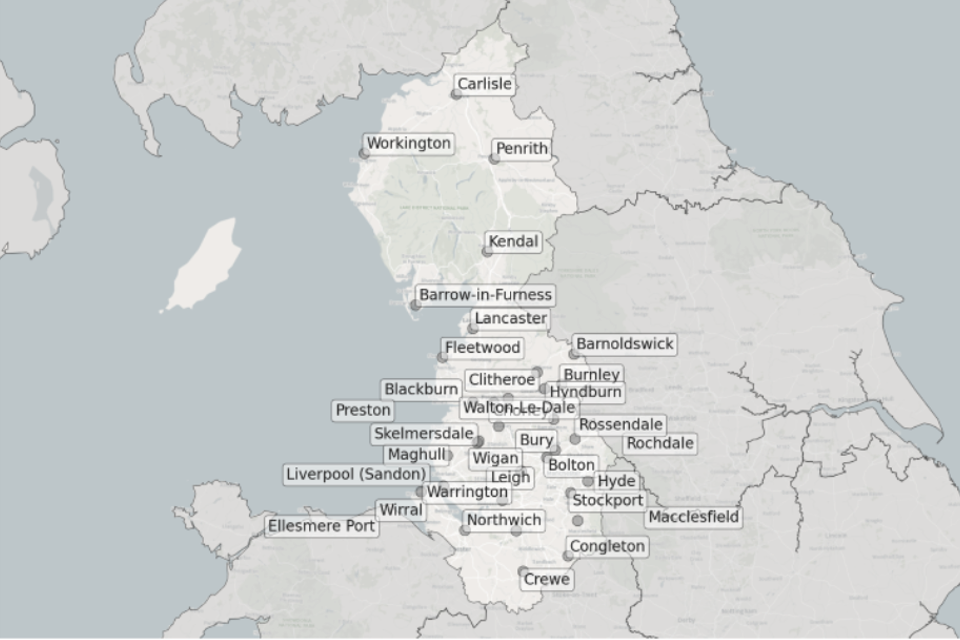
Figure 5. Map showing the location of STWs sampled in the North West.
Location of STWs sampled in the North West:
- Barnoldswick
- Barrow-in-Furness
- Blackburn
- Bolton
- Burnley
- Bury
- Carlisle
- Clitheroe
- Congleton
- Crewe
- Ellesmere Port
- Fleetwood
- Hyde
- Hyndburn
- Kendal
- Lancaster
- Leigh
- Liverpool (Sandon)
- Macclesfield
- Maghull
- Northwich
- Penrith
- Preston
- Rochdale
- Rossendale
- Skelmersdale
- Stockport
- Walton-Le-Dale
- Warrington
- Wigan
- Wirral
- Workington
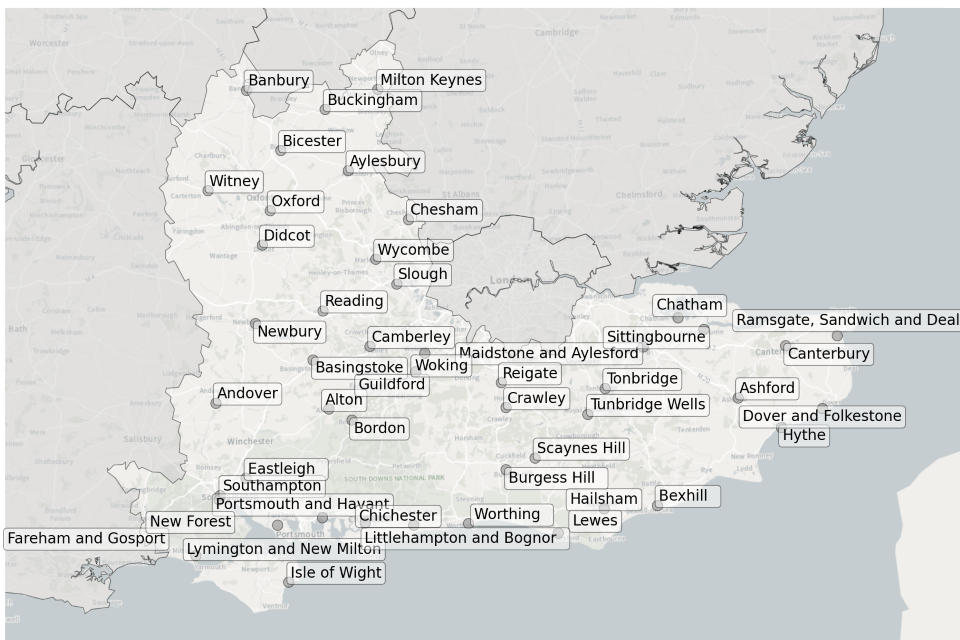
Figure 6. Map showing the location of STWs sampled in the South East.
Location of STWs sampled in the South East:
- Andover
- Alton
- Ashford
- Aylesbury
- Banbury
- Basingstoke
- Bexhill
- Bicester
- Bordon
- Buckingham
- Burgess Hill
- Camberley
- Canterbury
- Chatham
- Chesham
- Chichester
- Crawley
- Didcot
- Dover and Folkestone
- Eastleigh
- Fareham and Gosport
- Guildford
- Hailsham
- Hythe
- Isle of Wight
- Lewes
- Littlehampton and Bognor
- Lymington and New Milton
- Maidstone and Aylesford
- Milton Keynes
- Newbury
- New Forest
- Oxford
- Portsmouth and Havant
- Ramsgate, Sandwich and Deal
- Reading
- Reigate
- Scaynes Hill
- Sittingbourne
- Slough
- Southampton
- Tonbridge
- Tunbridge Wells
- Witney
- Woking
- Worthing
- Wycombe
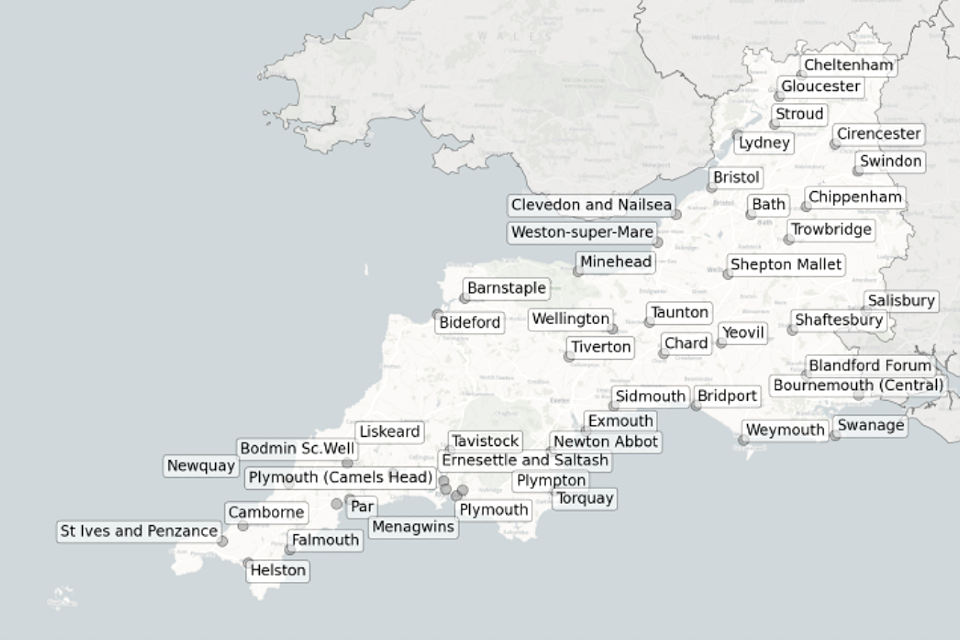
Figure 7. Map showing the location of STWs sampled in the South West.
Location of STWs sampled in the South West:
- Barnstaple
- Bath
- Bideford
- Blandford Forum
- Bodmin Sc Well
- Bournemouth (Central)
- Bridport
- Bristol
- Camborne
- Chard
- Cheltenham
- Chippenham
- Cirencester
- Clevedon and Nailsea
- Ernesettle and Saltash
- Exmouth
- Falmouth
- Gloucester
- Helston
- Liskeard
- Lydney
- Menagwins
- Minehead
- Newquay
- Newton Abbot
- Par
- Plymouth (Camels Head)
- Plymouth
- Plympton
- Salisbury
- Shaftesbury
- Shepton Mallet
- Sidmouth
- St Ives and Penzance
- Stroud
- Swanage
- Swindon
- Taunton
- Tavistock
- Tiverton
- Torquay
- Trowbridge
- Wellington
- Weston-super-Mare
- Weymouth
- Yeovil
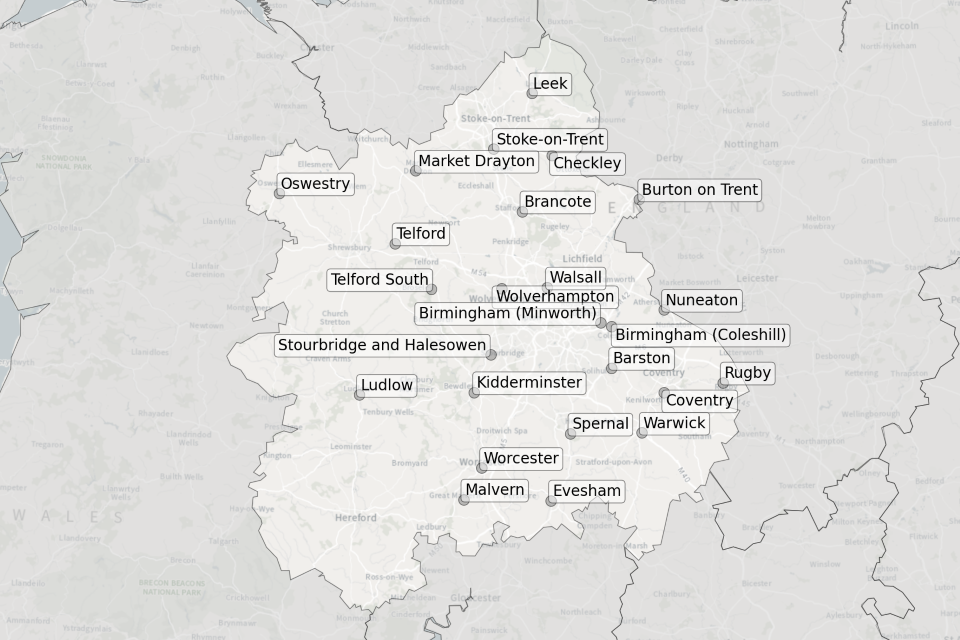
Figure 8. Map showing the location of STWs sampled in the West Midlands.
Location of STWs sampled in the West Midlands:
- Barston
- Brancote
- Checkley
- Birmingham (Coleshill)
- Birmingham (Minworth)
- Burton on Trent
- Coventry
- Evesham
- Kidderminster
- Leek
- Ludlow
- Malvern
- Market Drayton
- Nuneaton
- Oswestry
- Rugby
- Spernal
- Stoke-on-Trent
- Stourbridge and Halesowen
- Telford
- Telford South
- Walsall
- Warwick
- Wolverhampton
- Worcester
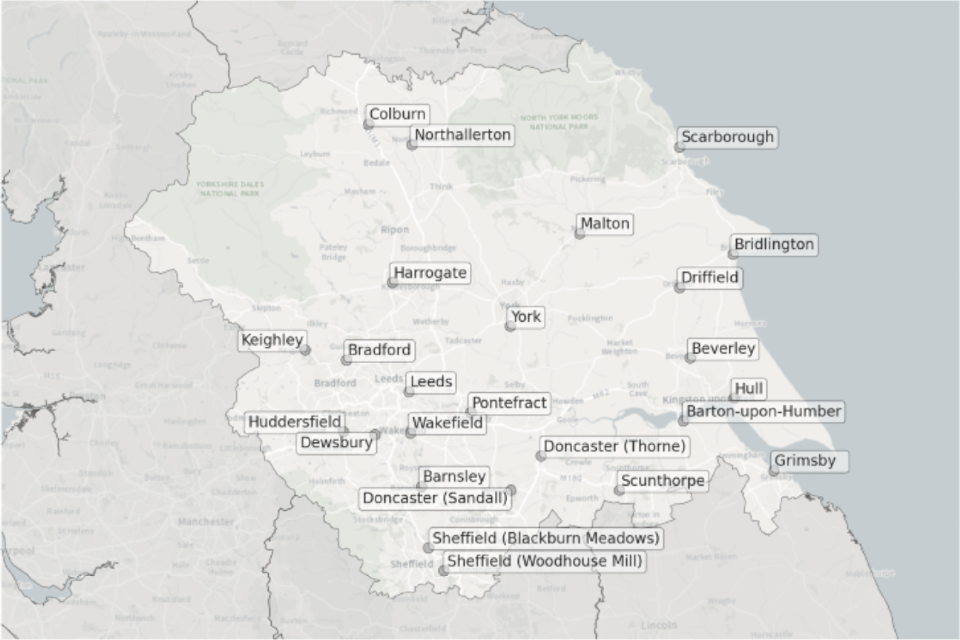
Figure 9. Map showing the location of STWs sampled in Yorkshire and the Humber.
Location of STWs sampled in Yorkshire and the Humber:
- Barnsley
- Barton-upon-Humber
- Beverley
- Bradford
- Bridlington
- Colburn
- Dewsbury
- Doncaster (Thorne)
- Doncaster (Sandall)
- Driffield
- Grimsby
- Harrogate
- Huddersfield
- Hull
- Keighley
- Leeds
- Malton
- Northallerton
- Pontefract
- Scarborough
- Scunthorpe
- Sheffield (Blackburn Meadows)
- Sheffield (Woodhouse Mill)
- Wakefield
- York
Concentration of SARS-CoV-2 RNA in wastewater samples
EMHP wastewater concentration data from 1 June 2021 to 10 January 2022 is available in the accompanying spreadsheet. The spreadsheet includes data from previous months’ publications, along with the latest data from December and January. The most recent 6 weeks of data is visualised in figures 10 to 12; England concentration map. Note that STWs are omitted from figures 10 to 12 if no samples were taken during the week.
Since September 2021, the concentrations of SARS-CoV-2 RNA EMHP measured in wastewater appeared to diverge from reported clinical data. This trend is now not as pronounced as previously observed, nor is it as evident when considering the data over a longer timeframe. EMHP is continuing to investigate the relationship between COVID-19 cases and wastewater and how this may be fluctuating over time. EMHP advises caution when directly comparing data from STWs and concentration of SARS-CoV-2 RNA in wastewater with clinical testing data. Interpretation should be made with careful consideration of the points in the Uncertainty, data quality and revisions section.
In the week beginning 30 November, 117 of 268 STWs (44%) had a decrease in average concentration levels compared to the previous week. In the week beginning 7 December, 214 of 272 STWs (79%) had higher average concentration than the preceding week. In the week beginning 14 December, 172 of 273 STWs (63%) had a decrease in average concentration relative to the previous week. In the week beginning 21 December, there was limited wastewater sampling due to the Christmas holidays, therefore there is not enough data to assess changes in concentration levels over this period. In the week beginning 28 December 2021, 135 out of 232 STWs (58%) showed an increase in average concentrations compared to week beginning 14 December 2021. In the week beginning 4 January 2022, 122 of 229 STWs (53%) showed a decrease in average concentrations. Interpretation should be made with careful consideration of the points in the Uncertainty, data quality and revisions section below.
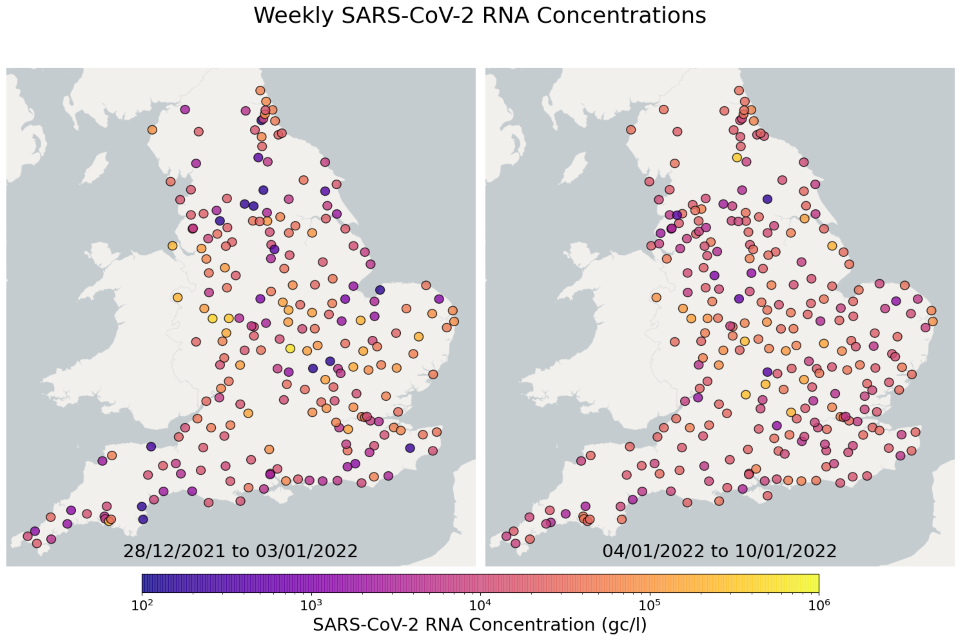
Figure 10. England concentration map: map showing the location of STWs sampled. Colour indicates the weekly-average SARS-CoV-2 RNA concentration (gene copies/litre) in the last 2 weeks. See regional maps for the names of each STW.
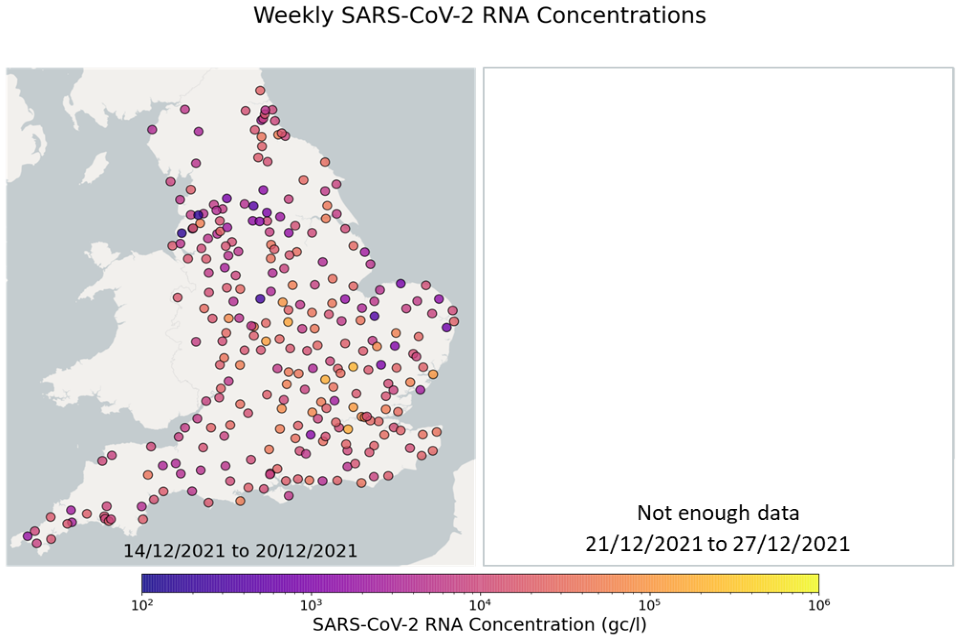
Figure 11. England concentration map: map showing the location of STWs sampled. Colour indicates the weekly-average SARS-CoV-2 RNA concentration (gene copies/litre) in the mid-2 weeks. See regional maps for the names of each STW.
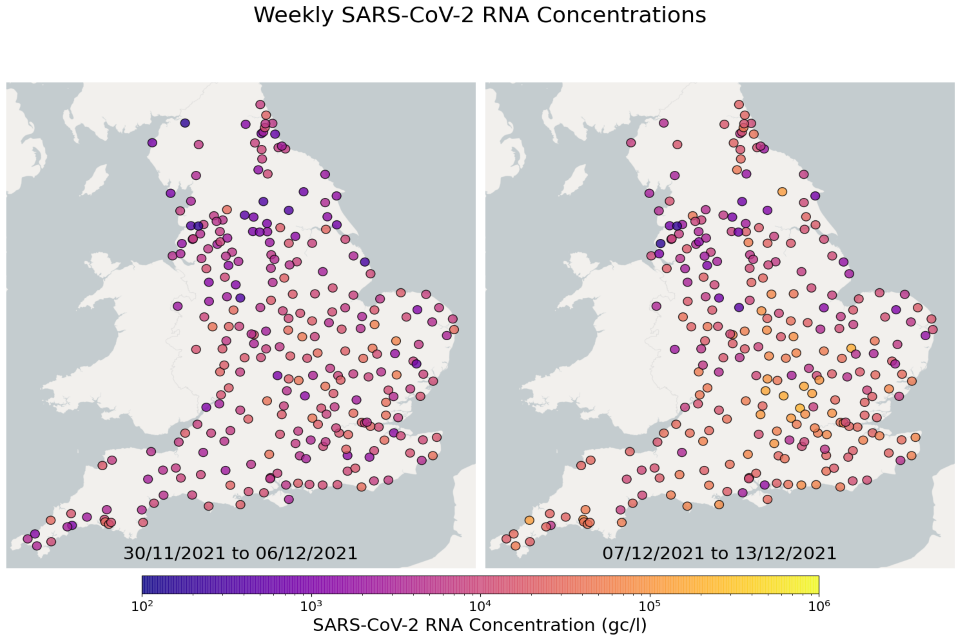
Figure 12. England concentration map: map showing the location of STWs sampled. Colour indicates the weekly-average SARS-CoV-2 RNA concentration (gene copies/litre) in the first 2 weeks. See regional maps for the names of each STW.
Regional average concentration of SARS-CoV-2 RNA in wastewater
Over the month of December, concentration levels in London were above the national average, corresponding to the spread of Omicron which was seen first in London. Concentration levels in the East Midlands were also higher than the national average for some of December while the other regions remained on or below the national average. Although there is only one week of data in January 2022, the concentration data shows signs of a downward trend in most regions. There is high variability in concentration between individual STWs, nationally. Interpretation should be made with careful consideration of the points in the Uncertainty, data quality and revisions section.
Figures 13 to 21 show the 7-day rolling average SARS-CoV-2 concentration detected in wastewater for each region in England, together with the national average of SARS-CoV-2 concentration detected in wastewater and individual site data. Samples where no SARS-CoV-2 was detected are assigned the value 160 (gc/l) which is the Theoretical Limit of Detection. Data is weighted by catchment population to account for varying catchment sizes. For further information, see the Methodology section below.
Note: there was limited wastewater sampling over the Christmas period, therefore trends are not shown for the period 21 December 2021 to 28 December 2021.
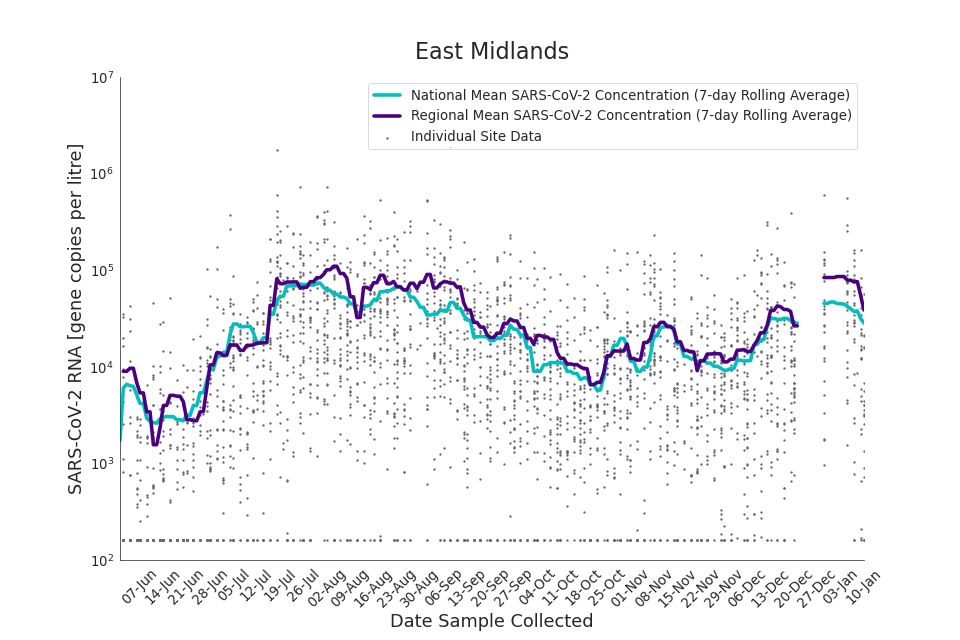
Figure 13. East Midlands 7-day rolling average SARS-CoV-2 RNA concentration
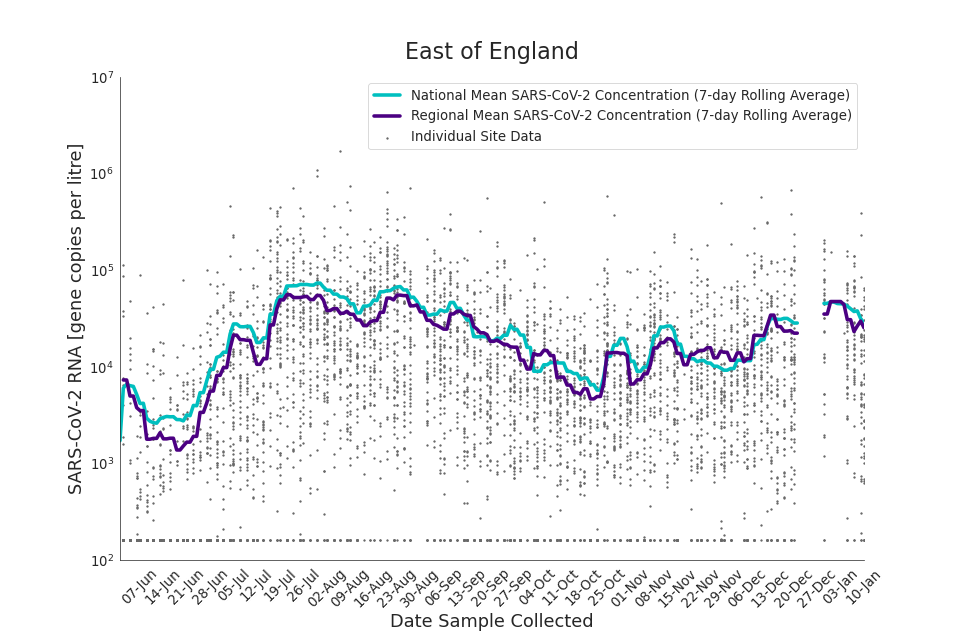
Figure 14. East of England 7-day rolling average SARS-CoV-2 RNA concentration
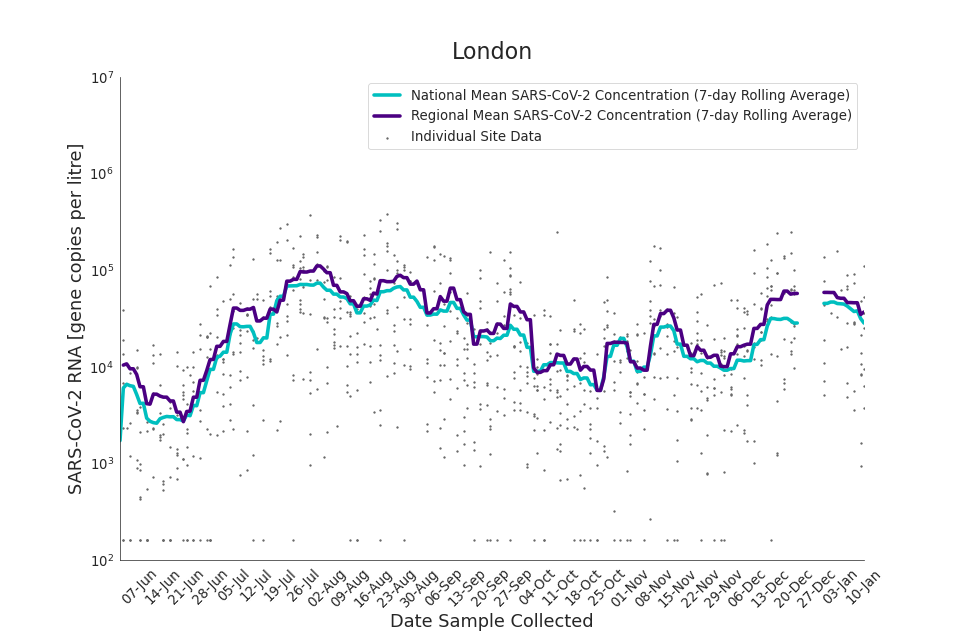
Figure 15. London 7-day rolling average SARS-CoV-2 RNA concentration
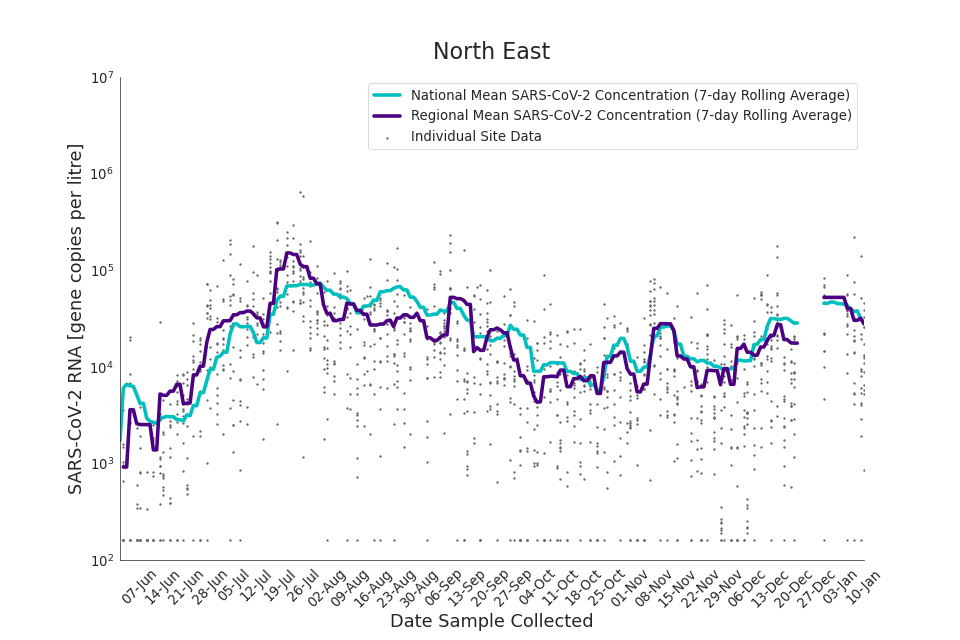
Figure 16. North East 7-day rolling average SARS-CoV-2 RNA concentration
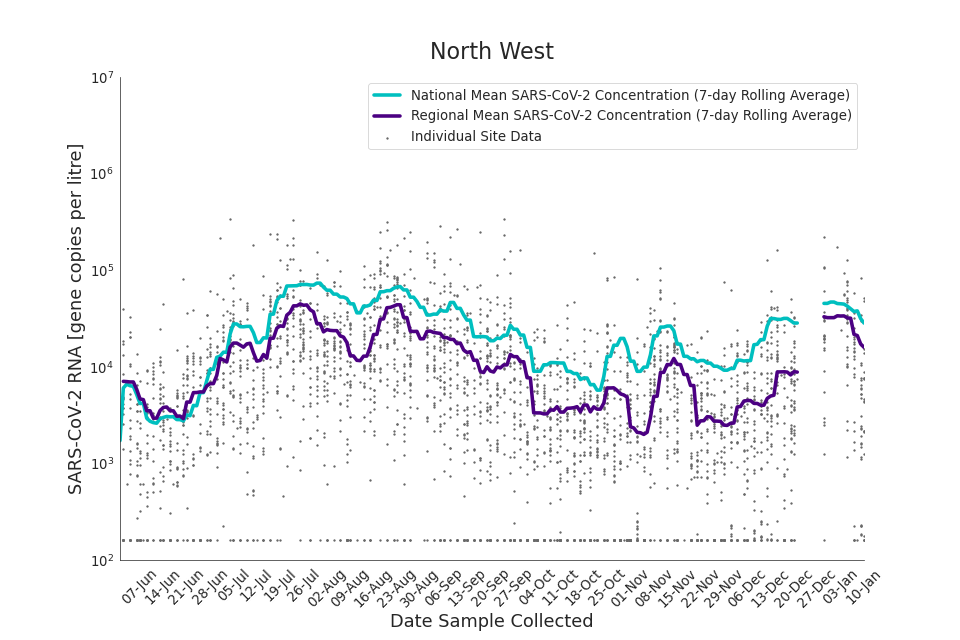
Figure 17. North West 7-day rolling average SARS-CoV-2 RNA concentration
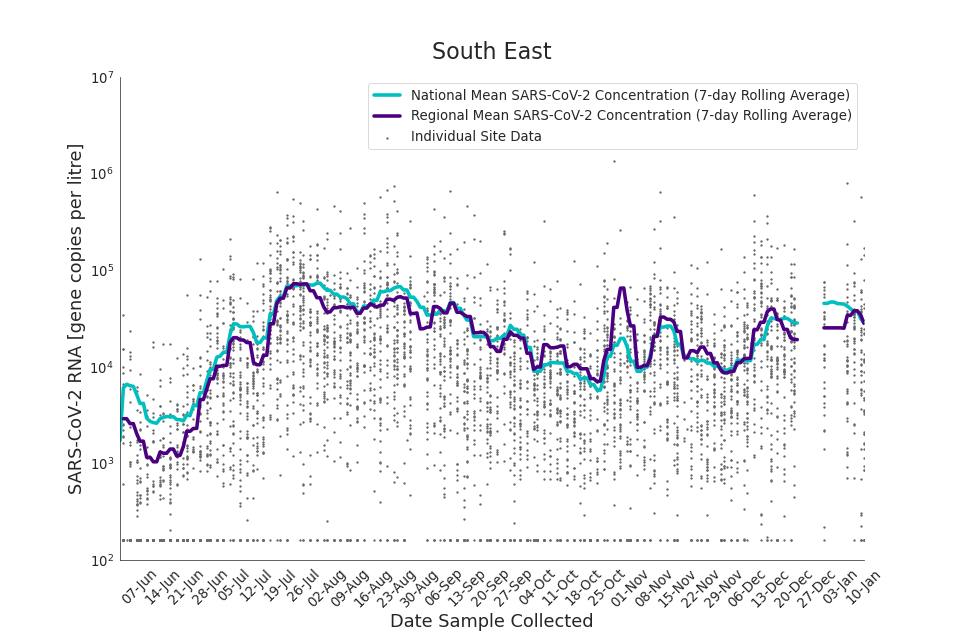
Figure 18. South East 7-day rolling average SARS-CoV-2 RNA concentration
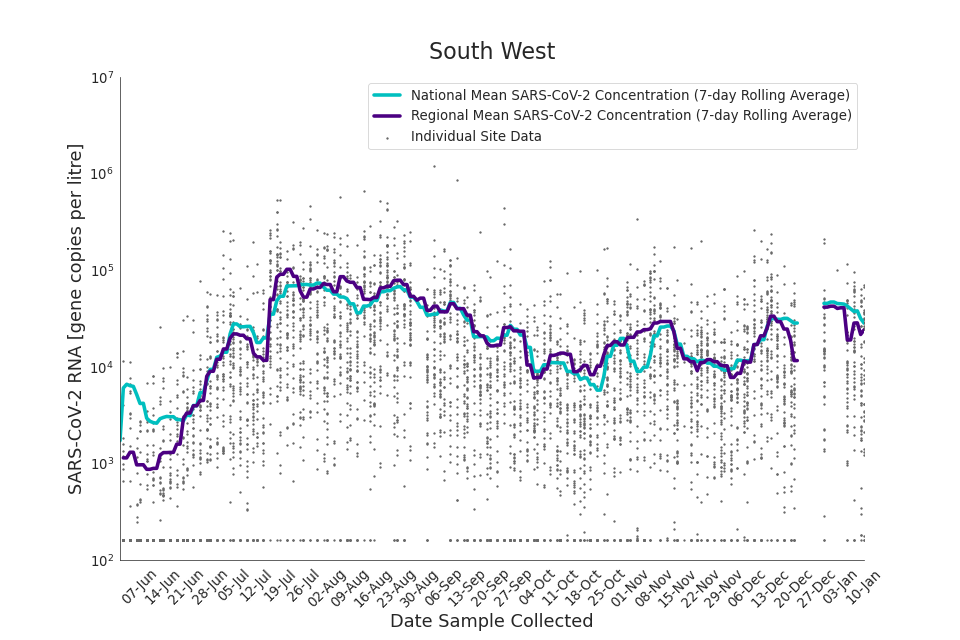
Figure 19. South West 7-day rolling average SARS-CoV-2 RNA concentration
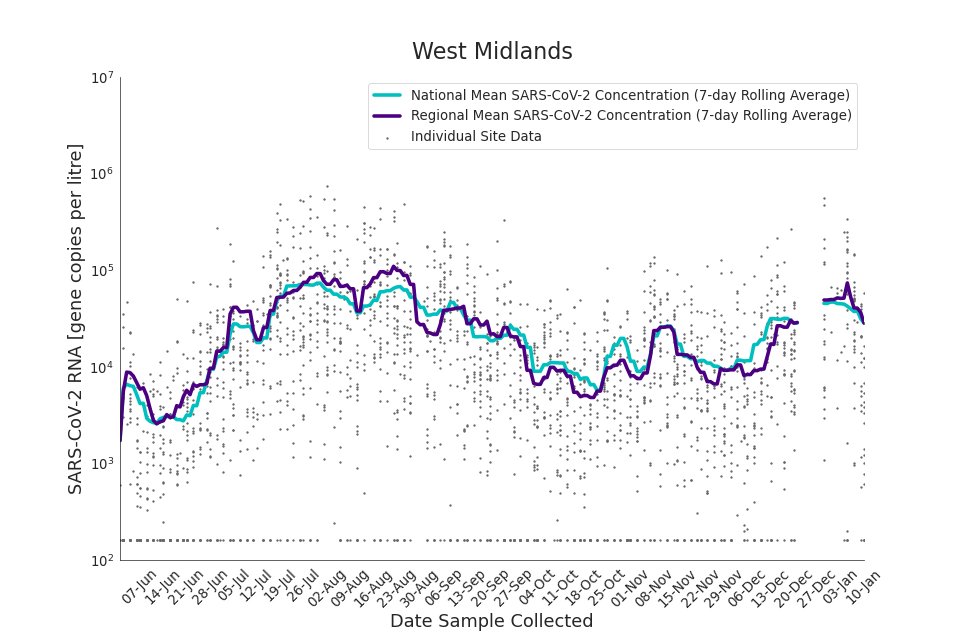
Figure 20. West Midlands 7-day rolling average SARS-CoV-2 RNA concentration
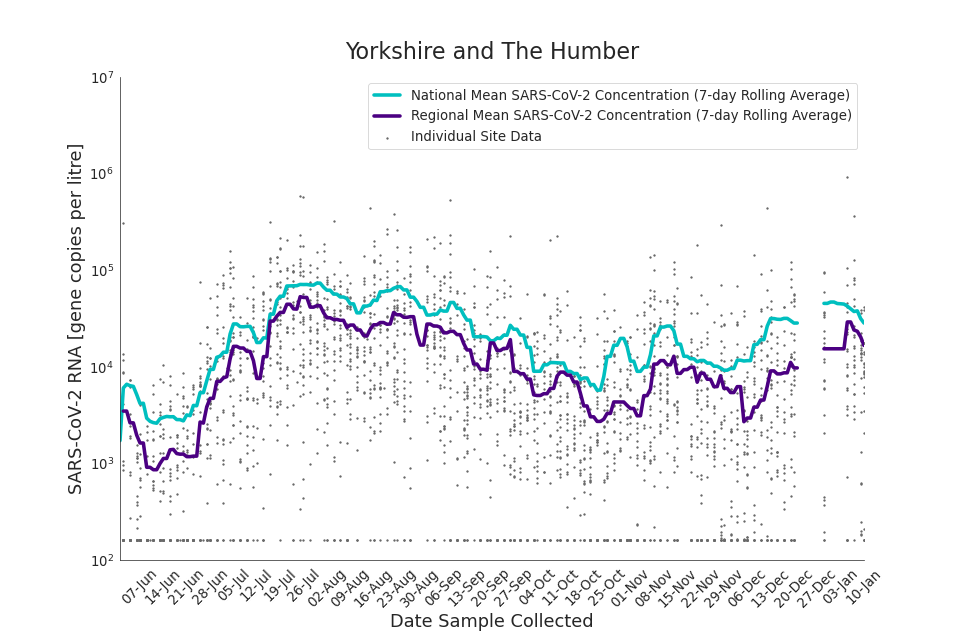
Figure 21. Yorkshire and the Humber 7-day rolling average SARS-CoV-2 RNA concentration
Wastewater variant detection
Omicron detections 22 November 2021 to 2 January 2022
Applying the Wastewater Variant Genomic Case Definition (see Methodology section), wastewater samples collected from sites across England from 22 November 2021 up to 2 January 2022 have been analysed for the presence of Omicron. EMHP Omicron detection data is available in the accompanying spreadsheet. The spreadsheet includes a table showing the number of sequenced samples by region and the number of confirmed and possible Omicron detections. Note that data presented here is subject to change as methods are further developed. Due to the additional time required to analyse wastewater detections versus concentrations, the latest detection data presented here is one week prior to the latest concentration data, there is a one-week lag on the data we are able to include in this publication.
From 22 November up to 2 January there were 1,674 confirmed or possible detections of Omicron in wastewater samples across England from approximately 5,900 sequenced for SARS-CoV-2 mutations. The first 5 Omicron detections in wastewater were identified week commencing 22 November 2021. Between 29 November and 5 December, 43 detections of Omicron in wastewater were reported, primarily in London and the South East. In the week commencing 6 December, Omicron was identified in 264 wastewater samples across all regions, a 6-fold increase from the previous week, aligning with the rapid growth of confirmed and probable Omicron cases in England. In the week commencing 13 December, there were 767 Omicron detections (51% of all samples sequenced) with the highest proportion of detections observed in London (78%), the South East (63%), the West Midlands (61%) and the East Midlands (61%). Conversely, Omicron was detected in less than 30% of samples sequenced in Yorkshire and the North East. In the week beginning 20 December, there was limited wastewater sampling due to the Christmas holidays, therefore there is not enough data to assess the spread of Omicron over this period. In the week beginning 27 December, the number of samples sequenced was lower than usual due to the Christmas holidays, but coverage was representative and Omicron was detected in 81% of samples sequenced. Omicron was detected in over 80% of all sequenced samples in all regions except the South West (77%) and the East of England (57%), although for both regions this was still an increase on the week commencing 13 December.
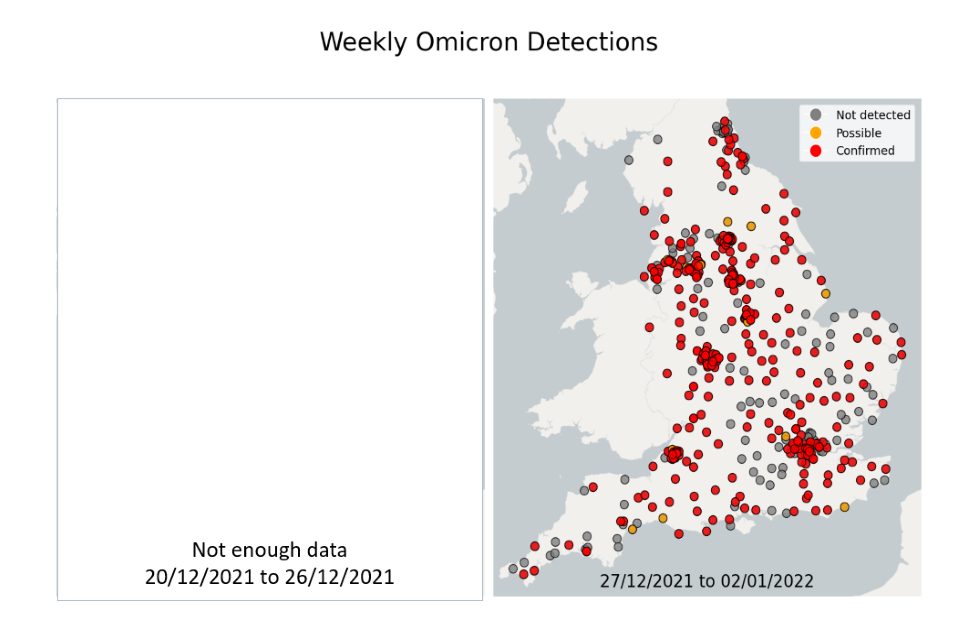
Figure 22. Confirmed and possible detections of Omicron VOC-21NOV-01 (B.1.1.529) in wastewater samples collected in England, data from 20 December 2021 to 29 December 2021.
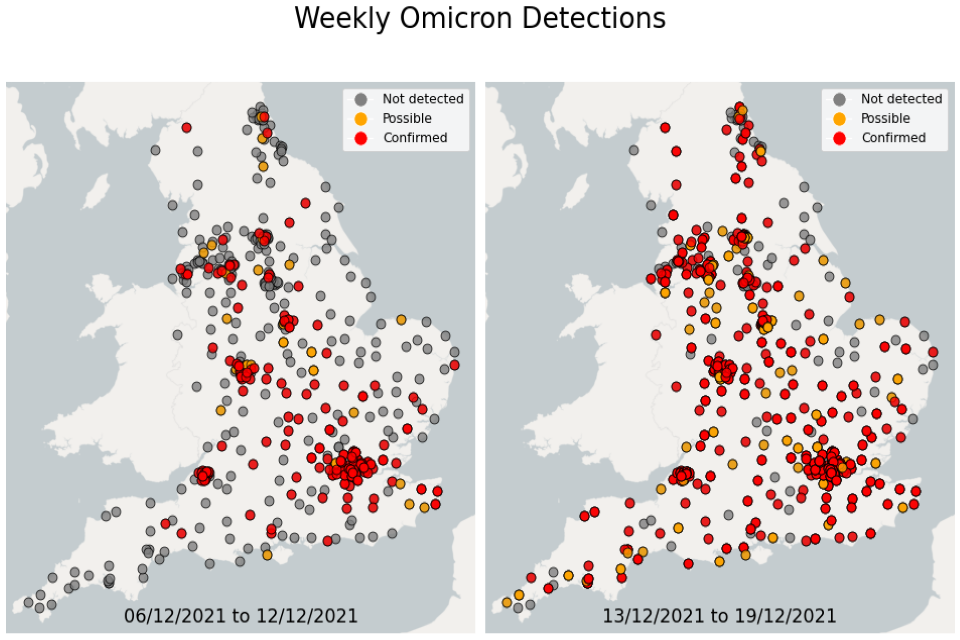
Figure 23. Confirmed and possible detections of Omicron VOC-21NOV-01 (B.1.1.529) in wastewater samples collected in England, data from 6 December to 19 December 2021.
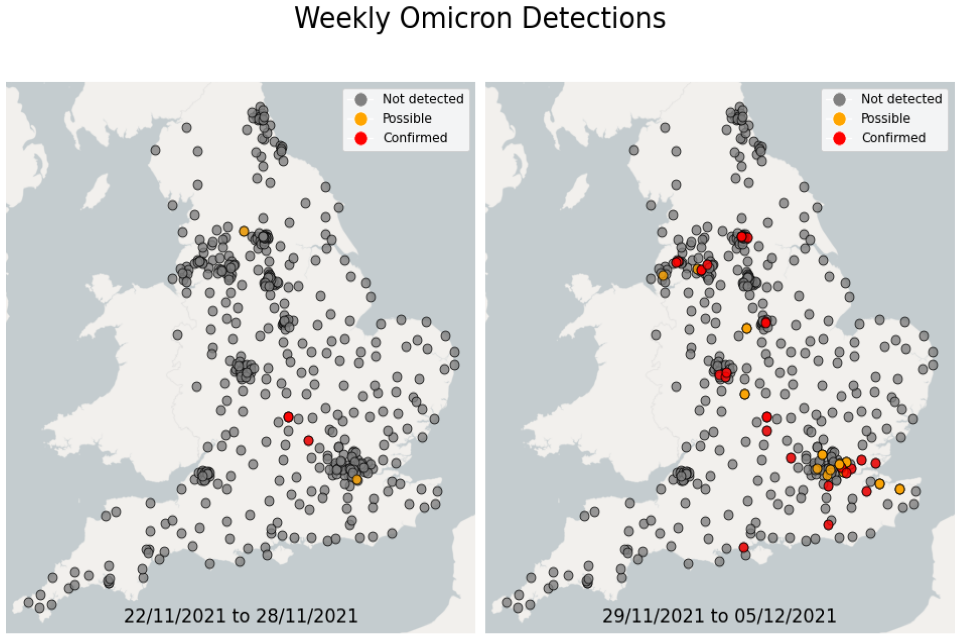
Figure 24. Confirmed and possible detections of Omicron VOC-21NOV-01 (B.1.1.529) in wastewater samples collected in England, data from 22 November to 5 December 2021.
Methodology
About this data
SARS-CoV-2 RNA concentration
EMHP samples wastewater from STWs throughout England. Samples are analysed for the concentration of SARS-CoV-2 by quantifying the number of copies of the nucleocapsid gene (N1). Samples are transported to Environment Agency laboratory for quantification of the N1 gene using a process called Reverse Transcriptase Polymerase Chain Reaction. The data reported here is the number of SARS-CoV-2 N1 gene copies per litre of wastewater (shortened to gene copies/litre throughout this document). Generally, the more people with COVID-19 in the community the more viral RNA will be shed into wastewater. Therefore, the concentration in wastewater is indicative of the prevalence of COVID-19 in the community.
Samples are analysed for the concentration of SARS-CoV-2 RNA and concentration is adjusted for flow (see Uncertainty, data quality and revisions). Typically, 4 samples per week are analysed from each STW. However, occasionally fewer samples will be collected and/or analysed. This can be due to several reasons such as EMHP altering sampling strategy because of testing capacity constraints, changing epidemiological priorities and current local response activities.
The weekly concentration table and daily concentration table in the accompanying spreadsheet show the concentration of SARS-CoV-2 RNA in wastewater samples (gene copies/litre). Note that there is sensitivity associated with the analysis of wastewater; the Limit of Detection (LOD) is the minimum concentration of SARS-CoV-2 RNA that can be reliably detected. Data tables contain the values ‘tLOD’ where analysis of the sample did not detect presence of SARS-CoV-2 RNA. For the purposes of averaging data to produce weekly averages in the Weekly concentration table and figures 10 and 11, EMHP assigns a concentration of 160 gene copies/litre to all ‘tLOD’ samples. This concentration is the Theoretical Limit of Detection and is calculated by the Environment Agency. Note that there is uncertainty in this calculation and continuing work to refine it; please see the Uncertainty, data quality and revisions section for further information.
To calculate region averages, data from each STW was weighted by catchment population. To estimate the population of STWs, the catchment areas of STWs are matched to lower layer super output areas (LSOAs). Catchment areas were provided by the 9 water companies serving England. See the EMHP publication Wastewater testing coverage data for the Environmental Monitoring for Health Protection (EMHP) programme for a detailed description of this method. Regional and national averages were calculated by taking the 7-day rolling arithmetic mean. Figures are displayed on a logarithmic scale for ease of interpretation.
We are exploring the feasibility of adding more data in future releases, such as concentration data from network sites.
SARS-CoV-2 variant detection
The wastewater routine analysis is to look for the presence of pre-defined sets of SNPs that identify known VOCs, VUIs, and signals in monitoring. It is possible to look for mutations associated with variants in the wastewater, but detection of variants can be transient and the correlation between population prevalence and wastewater variant detection has not been established for Omicron. Wastewater monitoring remains under development and is currently considered as supplementary data in variant monitoring.
A proportion of samples are sent to Liverpool, Nottingham and Exeter Universities Sequencing facilities each week for genomic sequencing, results are analysed by EMHP for the presence of known VOCs and VUIs officially recognised by UKHSA. Wastewater detections of a variant are reported as either confirmed or possible, based on the number of signature or unique SNPs, and co-occurrence on the same amplicon. This describes the level of confidence EMHP has in the specificity of the detection; ‘confirmed’ status is assigned when there is a high degree of confidence the variant is present, ‘possible’ is assigned where there is some evidence that the variant is present. These definitions are different to the clinical case definitions and the 2 should not be compared. Lack of a positive sequencing result is not necessarily confirmation that no variant cases reside within a given geography, due to factors such as rainfall dilution impacting RNA recovery. The wastewater variant genomic case definition used for detections in this publication is detailed below. Note that this definition is under review and subject to change.
Wastewater variant genomic case definition
B.1.1.529 (VUI-21NOV-01) Omicron
For the detection of Omicron VOC-21NOV-01 (B.1.1.529) in wastewater, the following definition is based on the detection of a number of SNPs from the list in the official UKHSA definition. No distinction is made between SNPs which can be used to define wastewater detections unless otherwise stated.
Confirmed – ≥ 16 of 22 variant defining SNPs detected, ≥ 9 of 20 unique SNPs detected and co-occurrence detected on at least 7 OR If ≥ 16 signature SNPs and ≥ 9 unique SNPs are present without co-occurrence, OR co-presence of SNPs at the following positions on amplicon 121 with co-occurrence: 22882, 22898, 22992, 23013, 23040, 23048 and 23055.
Possible – ≥ 10 of 22 variant defining SNPs detected and ≥ 6 of 20 unique SNPs detected OR If < 10 signature SNPs and ≥ 6 unique SNPs are detected, but ≥ 9 SNPs are not covered possible presence can be assigned if those not covered are present across 2 dates from the same site, but in the same sequencing run.
Not detected – < 7 of 22 variant defining SNPs detected unless co-presence of the following SNPs on amplicon 121: 22882, 22898, 22992, 23013, 23040, 23048 and 23055.
The Omicron detections table in the accompanying spreadsheet shows the number of sequenced samples per week in each region and the number of confirmed and possible Omicron detections. Note that this data is subject to change, as methods are improved or if data is reanalysed.
Data sources
Wastewater samples are collected by water companies and transported to an Environment Agency Laboratory. Concentration data is from Environment Agency analysis of wastewater samples. Sequencing data is from Liverpool, Nottingham and Exeter Universities Sequencing facilities. Variant detection’s data is from EMHP Genomics Analysis.
Figures in this publication show the location of STWs. These locations were obtained from the European Commission urban wastewater website. Note that names differ between those used in this document and the European Commission urban wastewater website. Sites can be linked using the ‘STW Site Code’ in the attached data tables.
The figures and analysis presented will evolve over time to ensure the most relevant information is included and the needs of stakeholders are met. These figures will initially be published monthly, from June 2021, and we will continuously evaluate the frequency and date-range based on need and public interest.
How these figures can be used
These figures and data can be used to view the concentration of SARS-CoV-2 RNA in wastewater, which is indicative of prevalence in the community and an indication of where VOCs and VUIs may be present across England. Due to factors relating to data uncertainty, EMHP recommends careful interpretation of this data alongside other data sources such as Weekly Statistics for NHS Test and Trace (England).
Uncertainty, data quality and revisions
The figures here are compiled by professional analysts and have been quality assured. However, the analytical pipeline to produce this data should still be considered experimental; it is subject to an ongoing quality assurance process. Any revisions to past publications will be in line with the Department of Health and Social Care’s revision policy and highlighted in future publications accordingly.
SARS-CoV-2 RNA concentration
The sites from which EMHP samples can change on a regular basis depending on testing capacity, epidemiological priorities, and current local response activities. This can result in changes to specific STWs covered. This means the STW included in subsequent publications may change.
This publication shows STWs as single points. Every STW has an associated geographical catchment area (area from which wastewater flows into the sampling location). These catchments are not yet presented in these statistics publications. There is uncertainty surrounding catchment geography, as catchments vary in size and population covered, and in some cases an STW may not be located within the catchment it serves (for example, if wastewater is pumped to the STW). Therefore, the location of STWs should be used as a general guide only.
Wastewater is an inherently variable material and can change greatly within and between days (foodstuffs being consumed; when washing machines are switched on and many other factors), the physical infrastructure and the type and levels of industrial wastes. It is generally more useful to consider trends over medium- and long-term periods of time, rather than between individual days.
There are several factors that can impact the quality of the signal recorded from wastewater and introduce uncertainty.
- The concentration of SARS-CoV-2 RNA in wastewater may be impacted by weather, for example heavy rainfall wastewater may cause dilution. EMHP mitigates this by adjusting concentration to consider flow.
- Whether samples are ‘composite’ or ‘grab’. Composite samples are where an autosampler (a machine which gathers wastewater at regular intervals over a set time period) gathers wastewater throughout the day. Grab samples are where a single sample is taken at one point in the day and are subject to greater variability; they are influenced by flow characteristics, time of day, and are more susceptible to outliers in the sewage. EMHP aims to mitigate this by sampling during times of peak load and ensuring the sample is collected mid-stream rather than close to the edges or bottom of the pipe.
- Calculating the Limit of Detection (LOD; the minimum concentration of SARS-CoV-2 RNA that can be reliably detected in a wastewater sample) can be achieved by several methods. In this data we have used the Theoretical LOD as calculated by the Environment Agency. The Theoretical LOD uses several assumptions. Laboratory data is required to inform the more realistic Practical LOD. The Practical LOD for this analysis is not yet reported here. It is likely that the LOD used in producing these statistics will change in future publications. EMHP will clearly state when this occurs.
- Although the exact value of the LOD is uncertain, it is unlikely to have a noticeable impact on the interpretation of this data. This is because the difference between Theoretical and Practical LOD is relatively small, with most impact at low levels of the target being measured.
- As explained in the About this data section, typically 4 wastewater samples are taken at each STW per week. The average of all samples within the week is presented in the weekly concentration table. Uncertainty occurs where fewer samples are taken. For example, if only one sample is taken during a week, that one sample defines the week average. This means weeks with fewer samples are more susceptible to variability and outliers. The sample count table shows how many samples were taken at an STW for each week in this release.
For the above reasons, EMHP advises caution when directly comparing data from STWs and concentrations of SARS-CoV-2 RNA in wastewater with clinical testing data. Methodology and limitations will differ across data sources and this should be taken into account.
SARS-CoV-2 variant detection
The lack of a positive sequencing result is not confirmation that no variant cases reside within a given geography (given limitations of wastewater testing).
Environmental factors such as rainfall dilution can influence the detection of variants in wastewater. Therefore, low total detections on some days may not be reflective of low community infection levels.
Due to limitations of wastewater testing, EMHP cannot estimate the number of cases associated with a detection. In small catchments it is possible, but unlikely, that the detection is due to a single individual. In larger catchments a detection is likely caused by a higher number of cases.
Figures 22 to 24 show the location of Omicron detections in STWs and sewer networks as single points. Sewer networks tend to be relatively small geographical areas. Please note that the underlying characteristics of city sewer networks can be complex. For example, there may be varying flow from other areas into the catchment, and/or the exact catchment geography may be uncertain. With this in mind, maps are presented as a general guide to the location of a detection.
It is possible that a detection in a catchment is contributed to by case(s) who do not reside in the catchment; interpretation with other epidemiological indicators, such as known clinical cases, is encouraged.
We continue to develop our approach for identifying variants and mutations in wastewater. The data presented in this publication is generated by non-accredited research laboratories and should be considered experimental. Formal validation of wastewater monitoring as a variant surveillance system is underway.
If you would like to give user feedback, please email testandtrace.statistics@dhsc.gov.uk