Low Pay Commission summary of findings 2022
Published 17 November 2022

© Crown copyright 2022
This publication is licensed under the terms of the Open Government Licence v3.0 except where otherwise stated. To view this licence, visit nationalarchives.gov.uk/doc/open-government-licence/version/3 or write to the Information Policy Team, The National Archives, Kew, London TW9 4DU, or email: psi@nationalarchives.gov.uk.
Where we have identified any third party copyright information you will need to obtain permission from the copyright holders concerned.
This publication is available at https://www.gov.uk/government/publications/minimum-wage-rates-for-2023/low-pay-commission-summary-of-findings-2022
1. Introduction
The Low Pay Commission (LPC) is an independent public body that advises the Government on the rates of the National Minimum Wage (NMW), including the National Living Wage (NLW).
We are a social partnership body, made up of nine Commissioners representing employers, workers and independent experts. Every year since 1998, Commissioners have unanimously agreed the LPC’s recommendations to the Government.
We met in October 2022 to agree recommendations for April 2023. We submitted our advice to the Government on 24 October.
This short report summarises the evidence underpinning our advice. It should be read in conjunction with our letter to the Government. Our full report, which sets out our evidence base in full, will be laid before Parliament and published later this year.
Our recommendations on NLW and NMW rates were accepted in full by the Government and will come into effect from 1 April 2023.
The NLW and NMW rates effective from April 2023 are shown below.
Rates to apply from April 1st 2023
| Rate from April 2023 | Annual increase (£) | Annual increase (per cent) | |
|---|---|---|---|
| National Living Wage | £10.42 | 0.92 | 9.7 |
| 21-22 Year Old Rate | £10.18 | 1.00 | 10.9 |
| 18-20 Year Old Rate | £7.49 | 0.66 | 9.7 |
| 16-17 Year Old Rate | £5.28 | 0.47 | 9.7 |
| Apprentice Rate | £5.28 | 0.47 | 9.7 |
| Accommodation Offset | £9.10 | 0.40 | 4.6 |
2. Our remit for 2022
Our remit is set and published each year by the Government.
The National Living Wage
The government asks the Low Pay Commission to monitor and evaluate the National Living Wage and recommend the rate which should apply from April 2023 in order to reach two-thirds of median earnings (of those eligible for the National Living Wage) by 2024, taking economic conditions into account. We remain committed to lowering the age threshold for the National Living Wage to aged 21 and over by 2024. We ask the Low Pay Commission to comment on the impacts to date of an increased wage for workers aged 21-22 ahead of the further lowering of the age threshold.
Other National Minimum Wage Rates
For other rates, we were asked to recommend rates as high as possible without damaging the employment prospects of each group.
Groups of workers and geographical impacts
In addition to our standard remit on rates of the minimum wage, we were asked to pay special attention to two areas:
-
Groups of low-paid workers with protected characteristics.
-
The differing impact across the UK of increases in the NLW and NMW.
Accommodation Offset
In line with a commitment we made last year, we have reviewed the operation of the Accommodation Offset.
Our evidence base and approach
To arrive at our recommendations, we consider a wide range of evidence.
This year’s recommendations have been informed by:
-
A written public consultation exercise, held from March to June.
-
A UK-wide programme of visits and meetings.
-
Oral evidence sessions with 23 organisations representing workers and employers, as well as workers and employers themselves.
-
A range of independent research projects.
-
Comprehensive analysis of a range of economic and labour market data.
3. Rates recommendations
The below is taken from our recommendations letter and summarises the rationale for our NMW and NLW recommendations.
“We recommend the NLW increases by 9.7 per cent (92 pence) in April 2023 to £10.42. This is the on-course rate consistent with achieving the target of two-thirds of median earnings by 2024. We estimate an increase of 6.3 per cent will be required in 2024 (when average wage growth is expected to have slowed) to achieve this target, which we currently estimate to be £11.08. We judge this balance, with a higher increase in 2023 than 2024, is appropriate given prevailing economic conditions. While the economy has slowed recently, the labour market is very strong. It is sensible to have a larger increase to reach the Government’s target while the labour market is still strong.
The consensus among forecasters is for GDP growth to slow in 2023, and among more recent forecasts to turn negative over the year. The labour market is also expected to soften over the course of 2023, meaning a lower increase may be more appropriate in 2024.
Younger workers – those aged under 23 – were the most likely to lose employment during the pandemic. But their recovery was rapid throughout 2021 and 2022 and their employment rates are now close to pre-pandemic levels, aided by the tight labour market and strong demand for labour in youth-friendly sectors.
This tight labour market has also improved pay for these workers, where pay has increased substantially, particularly for those aged under 21. Because of this labour market strength for 16-17 and 18-20 year olds we recommend increases of 9.7 per cent – in line with the increase in the NLW – for both of these groups, to £5.28 and £7.49 respectively.
Last year we recommended aligning the Apprentice Rate and the 16-17 Year Old Rate and we continue to support this position as we have seen no evidence of negative effects stemming from this change. With this in mind, we are considering if there is a need for a separate Apprentice Rate long term. Next year we expect a new Apprenticeship Evaluation Survey, which would provide the level of evidence necessary to see if a separate rate for apprentices is still justified.
The evidence continues to support the decision to bring 23 and 24 year olds into the NLW and the Commission’s view remains that 21-22 year olds should also be brought into the NLW by 2024. To smooth this transition and avoid a very large increase once they become eligible, we recommend a 10.9 per cent increase for this group, taking them to £10.18 in 2023.”
4. The path of the National Living Wage
Our remit is to put the NLW on a path to reach two-thirds of median hourly pay (of those aged 21 and above) by 2024.
We estimate our recommendation of £10.42 will be 63.9 per cent of median hourly pay in October 2023. This takes a big step towards the 2024 target.
Over the last year, nominal pay growth and forecasts for future pay growth have strengthened, increasing our projection of the 2024 target from £10.70 to £11.08. We project that a smaller increase will be needed next year (6.2 per cent, £0.66) to reach the 2024 target than this year’s recommendation (9.7 per cent, £0.92). Firstly, this is because wage growth forecasts are stronger for this year than next. We estimate that median pay will grow by 5.5 per cent between April 2022 and April 2023, but only 4.2 per cent over the subsequent year. Secondly, next year 21 year olds and 22 year olds are due to become eligible for the NLW. This will reduce median hourly pay for the NLW-eligible population, lowering the increase required to hit the target.
Our projections rely on wage forecasts which are particularly uncertain. Reflecting this, we have calculated a range for our target rate in 2024 which spans from £10.82 to £11.35.
Projected path for the National Living Wage to reach two-thirds of median earnings in 2024, 2019-2024
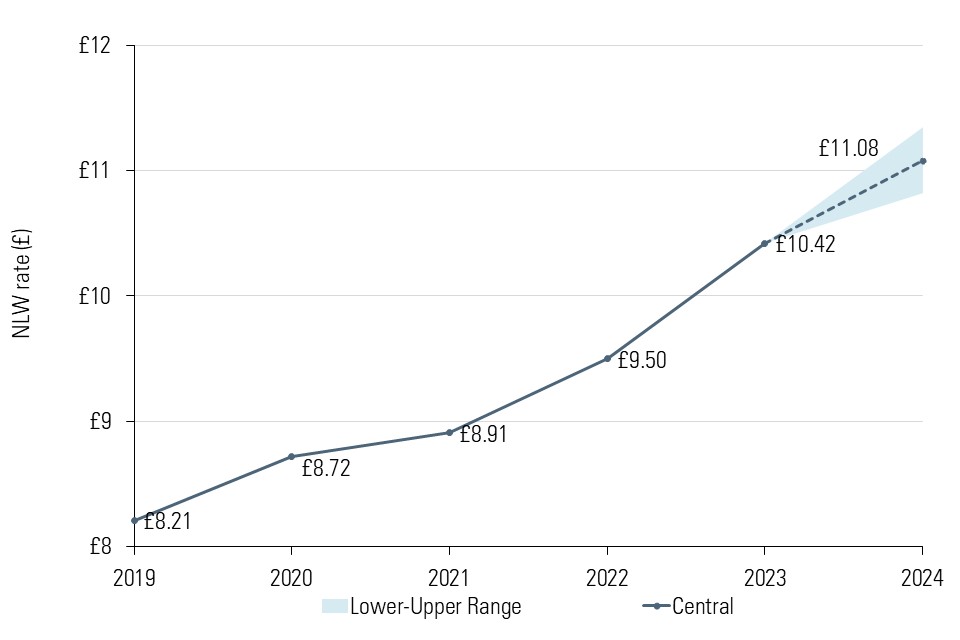
Source: LPC estimates using the median of hourly earnings excluding overtime for those aged 23 and over (and those aged 21 and over),excluding first year apprentices from the Annual Survey of Hours and Earnings 2021 and 2022; average weekly earnings (AWE) total pay (KAB9), monthly, seasonally adjusted, GB; and median of average wage growth forecasts from HM Treasury panel of independent forecasts (August and October 2022) and the Bank of England (Monetary Policy Report, August 2022).
5. Economic growth is slowing
The UK economy has recovered from the pandemic more quickly than in previous downturns. Momentum, however, has slowed, with little growth between December 2021 and August 2022.
Inflation has increased sharply, initially through post-pandemic supply chain disruptions and labour shortages but exacerbated by the Russian invasion of Ukraine in February 2022. As a result, real wages and real household disposable incomes have fallen, leading to consumer confidence falling below levels recorded during the financial crisis.
Business investment had been weak even before the pandemic. It then fell sharply during the pandemic and is still well below pre-pandemic levels. With margins under pressure from rising costs, decreasing credit availability and the weaker medium-term outlook, business investment is likely to remain subdued.
The outlook is for much weaker GDP growth in 2023 and 2024. The recent forecasts suggest the outlook to be weaker than in the US and the Euro area, albeit stronger than in Germany.
Monthly GDP growth, 2020-2022
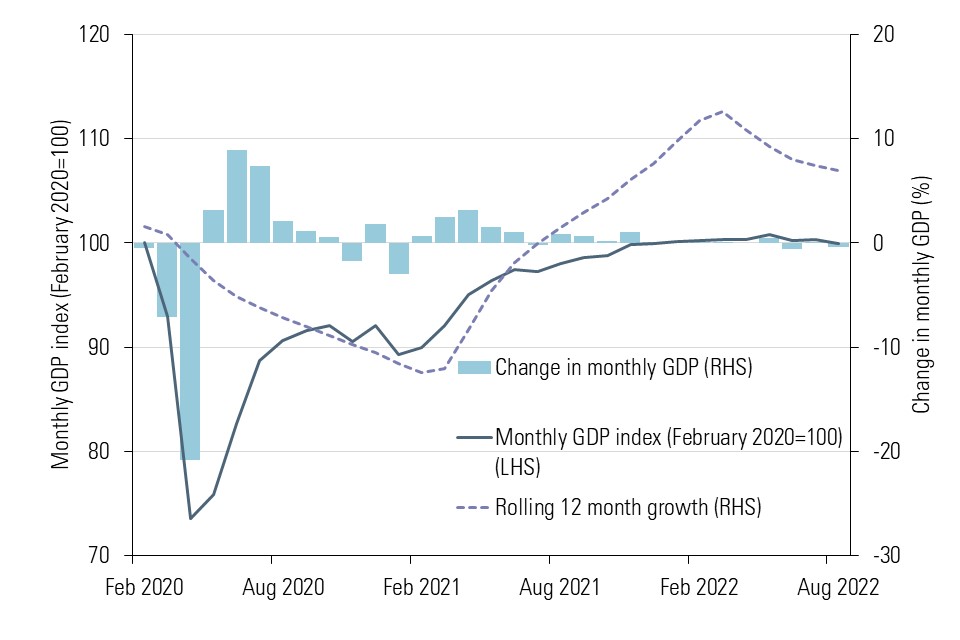
Source: LPC calculations using ONS data. Monthly GDP index (ECY2), monthly, seasonally adjusted, UK, March 2018-August 2022.
International comparisons of actual and forecast GDP growth, 2019-2022
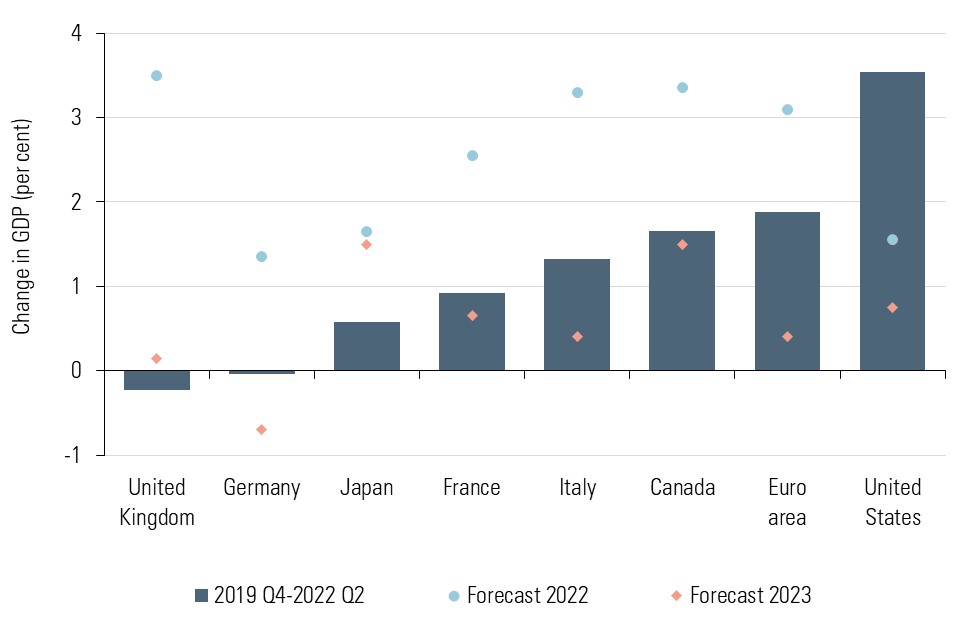
Source: LPC calculations based on IMF and OECD data. OECD gross domestic product – expenditure approach (VIXOBSA) volume index (2015=100), quarterly, seasonally adjusted, 2019 Q4-2022 Q2; and average of GDP growth for 2022 and 2023 from IMF World Economic Outlook October 2022 and OECD Economic Outlook September 2022.
6. Inflation is reducing real household incomes and will likely lower GDP growth further
Inflation is rising rapidly. Rising prices mean rising costs for businesses, which are then passed on to consumers, fuelling further inflation. Core inflation has risen above 6 per cent for the first time in 30 years. Producer input and output prices have increased sharply over the last 18 months – reaching their highest growth rates in over 40 years.
While there is uncertainty about the outlook for inflation (we saw forecasts in the range of 6-12 per cent for the year to April 2022), there are signs in recent months that price pressures are easing.
Imminent policy decisions will have a direct impact. The energy price guarantee (EPG) will reduce headline inflation by around 5 percentage points up to April 2023, but there are, as yet, few details for the scheme beyond that point. Bank of England decisions on interest rates and the Government’s Medium-Term Fiscal Plan on 17 November will also affect inflationary pressures.
Real household disposable incomes have been falling since the middle of 2021 as inflation rose. Wages and benefits uplifts have lagged inflation. Interest rate rises will add to housing costs. Despite the support put in place by the Government, real disposable incomes are forecast to continue to fall over the next two years.
CPI inflation outturn and forecasts, 2015-2025
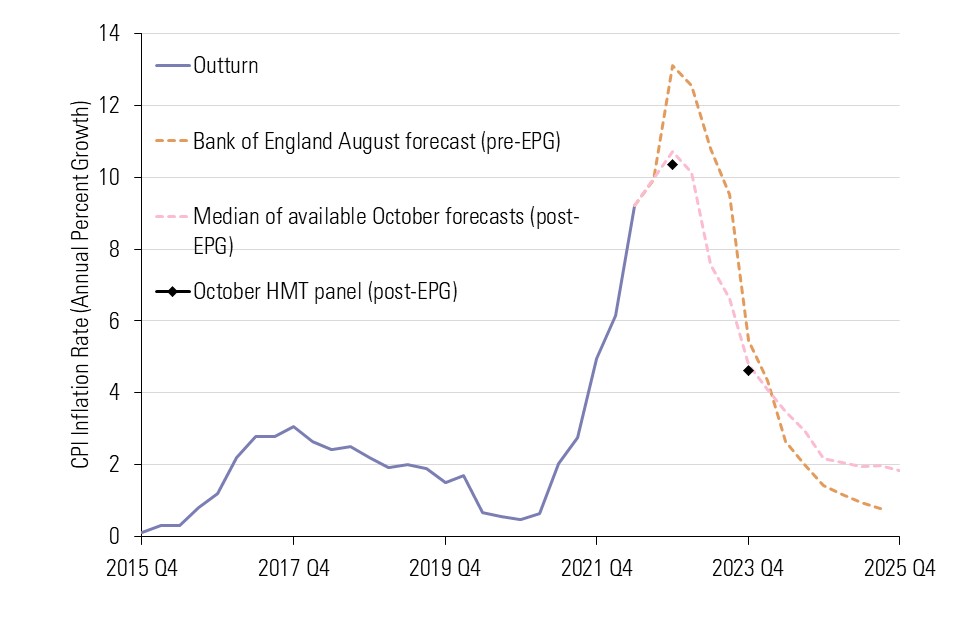
Source: LPC calculations using ONS CPI data (D7BT); Bank of England Modal Inflation Projection based on market expectations of interest rates (from Monetary Policy Report August 2022); HMT panel of independent forecasts October 2022 (median of October forecasts); and October 2022 quarterly forecasts available to us (Citibank, CEBR, Oxford Economics, Heteronomics).
Change in real household disposable incomes (RHDI), 1959-2025
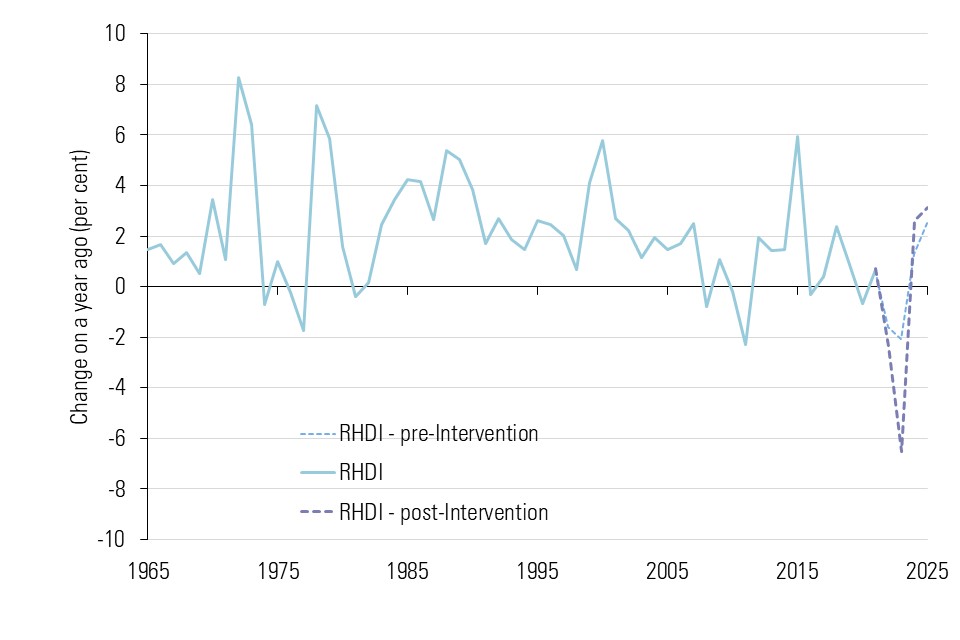
Source: IFS Green Book 2022. Chapter 2. UK outlook: why we need to do things differently. Figure 2.7: UK: real household disposable income (RHDI) growth, 1957–2025. Pre-intervention is based on measures up to the March 2022 Spring Statement. Post-intervention was based on measures taken since then including the Energy Price Guarantee (EPG), the £15 billion May package and the further £22 billion in personal tax cuts. Around £5 billion of the latter has since been reversed.
7. Labour demand remains very high, but inactivity has reduced supply
In striking contrast to economic growth, which has slowed over 2022 so far, the demand for labour has remained very strong, albeit softening into autumn 2022.
The level of vacancies in the economy has started to fall, but still remains very high when compared with February 2020. ONS vacancy levels of around 1.2 million in September 2022 remain more than 50 per cent higher than pre- pandemic. And many employers are still struggling to recruit workers with vacancy rates higher across all sectors compared with 2019.
Yet at the same time, supply of labour has fallen. Despite some population growth across 2022 almost half a million fewer working age people were in the labour force in August 2022 compared with the start of the pandemic.
This is a result of an increase of over 600,000 in the number of people who are not attached to the labour market or ‘inactive’. The majority of these (375,000) are older workers aged 50-64.
Whilst we have seen increases in student inactivity and retirement across this period, it is the rise in long-term sickness that is of most concern – the numbers stating long-term sickness as the main reason for being inactive were 380,000 higher in August 2022 compared with February 2020.
Job vacancy change since February 2020
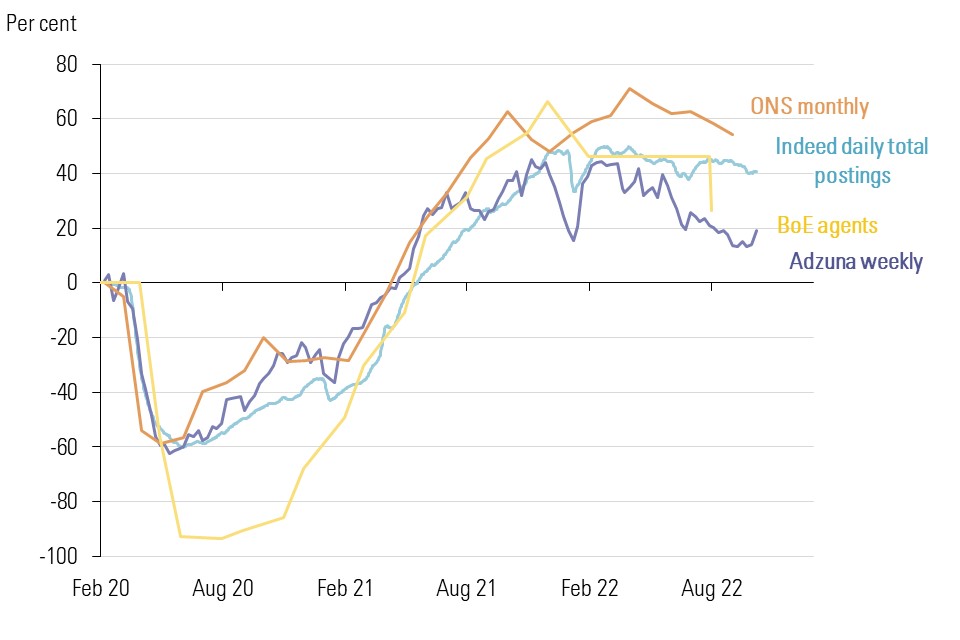
Source: LPC analysis of Indeed weekly job postings tracker, Adzuna weekly online job ads, ONS single month vacancy estimates (X06) and Bank of England Agents' summary of business conditions (2022 Q3), February 2020-October 2022.
Labour supply (16-64) changes since February 2020
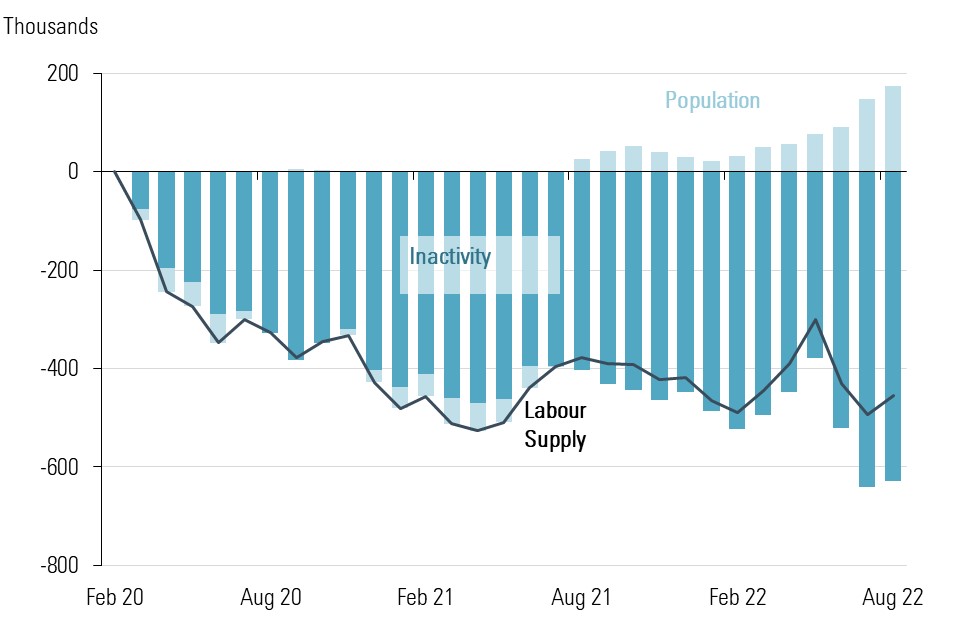
Source: LPC analysis of ONS 16-64 population (LF2O), employment (LF2G), unemployment (LF2I) and inactivity (LF2M) data, seasonally adjusted, UK, Feb 2020 – Aug 2022.
8. If vacancies fall, unemployment may stay low
The Beveridge curve traces the relationship between job vacancies and unemployment. More vacancies means more demand for workers and therefore lower unemployment.
The upper chart shows this relationship over the last 20 years, with the current (2022 Q2) vacancy rate far higher than at any point in that period. This unprecedented level of demand relative to supply is one reason why employers are struggling to recruit.
The key question is what happens next if the economy continues to falter and vacancies continue to fall in tandem. These data suggest vacancy levels can fall substantially, but still remain high enough to keep unemployment low. History shows, though, that if labour demand starts to soften, then we should expect unemployment to rise too, but the extent of this rise is unpredictable.
However, the current level of vacancies relative to unemployment is so unprecedentedly high that historical comparisons may not be relevant.
The most recent forecasts are for unemployment to increase slightly over 2023 to 4.4 per cent by the end of the year, which is still low by historic standards. However, there is uncertainty around this estimate and some forecasters predict larger rises.
Beveridge Curve: Vacancy and unemployment rates, 2001-2022
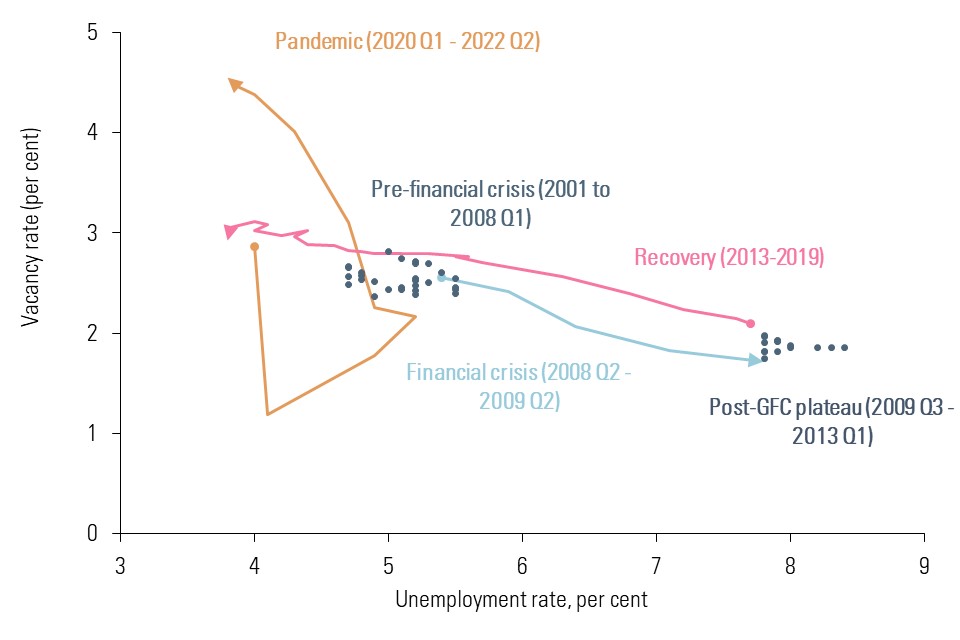
Source: LPC analysis of ONS vacancy rate (AP2Y) and 16+ unemployment rate (MGSX), quarterly, seasonally adjusted, UK, 2001 Q2 – 2022 Q2.
Unemployment rate (16+) out-turn and forecasts, 2015-2023
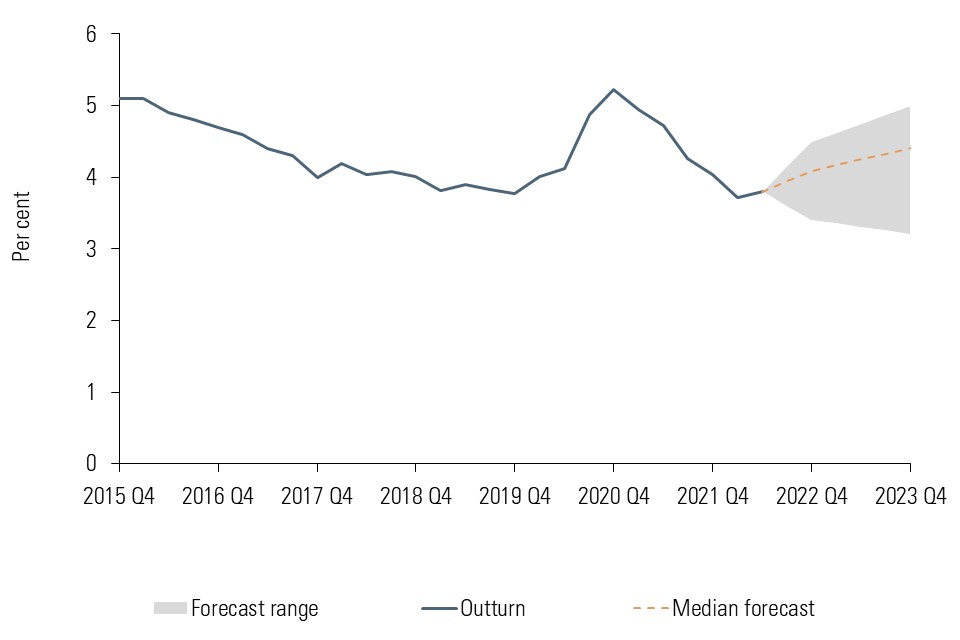
Source: LPC analysis of ONS 16+ unemployment rate (MGSX), quarterly, seasonally adjusted, UK, 2015 Q4 – 2022 Q2 and HMT panel of independent forecasts October 2022 highest, lowest and median unemployment forecasts for 2022 Q4 and 2023 Q4.
9. The tight labour market has increased nominal wage growth
Unemployment remains close to its pre-pandemic rate, having fallen to historic lows in the years before the pandemic. As unemployment falls we expect wages to grow as employers compete for the shrinking pool of available workers.
Underemployment - where workers want more hours than those on offer - is an equally important driver of wage dynamics in the UK economy. The IMF has shown that high levels of underemployment directly reduce wage growth, even more so in countries like the UK where unemployment is low.
Underemployment recovered relatively slowly after the financial crisis. It was still above pre-financial crisis levels as the pandemic struck. Subsequently however, it has fallen sharply to rates last seen before the financial crisis, 15 years previously.
The large gap that opened up between the unemployment rate and underemployment rate after the financial crisis of 2008 suggests the former used alone may now be a weaker indicator of slack in the labour market.
We plot the relationship between labour market slack (unemployment and underemployment as a share of the economically active) against regular pay growth. This Phillips wage curve shows that current (2022 Q2) levels of regular pay growth are in line with what we should expect given that levels of slack in the labour market are at their lowest in at least 20 years.
Underemployment & unemployment rates, 2002-2022
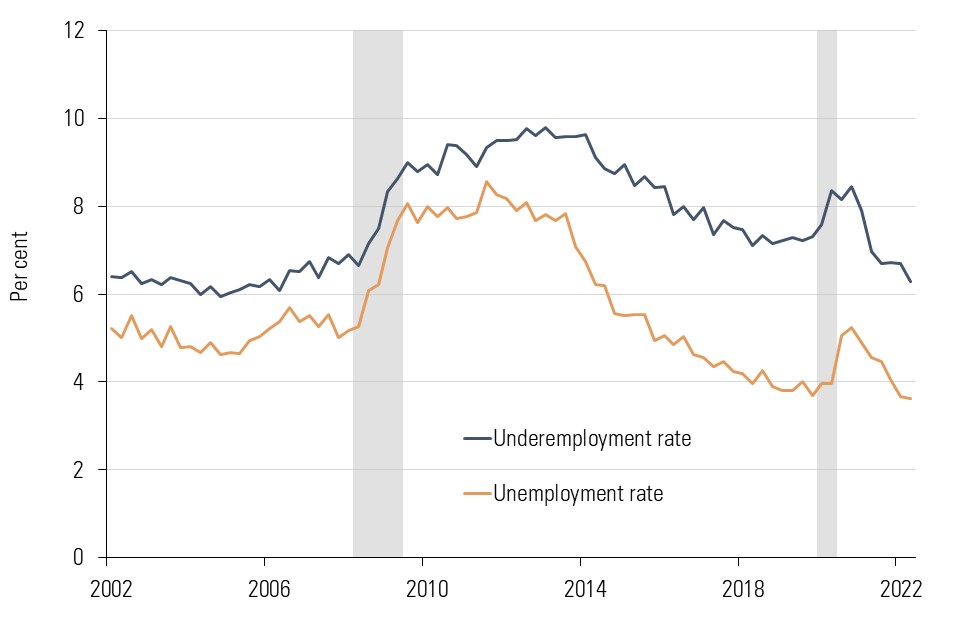
Source: LPC analysis of ONS unemployment (AO2) and underemployment (EMP16), quarterly, not seasonally adjusted, UK, 2002 Q1 – 2022 Q2.
Regular pay growth and labour market slack, 2002- 2022
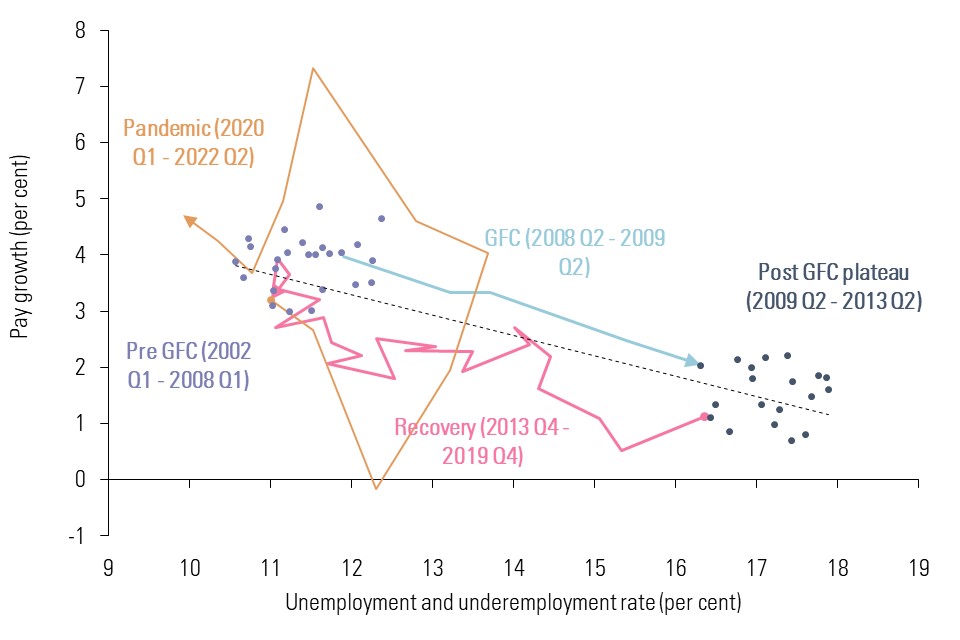
Source: LPC analysis of ONS unemployment (AO2) and underemployment (EMP16), quarterly, not seasonally adjusted, UK and AWE regular pay growth (KAI9), seasonally adjusted, GB, 2002 Q1 – 2022 Q2.
10. Growth in wages and pay settlements has not kept pace with inflation
At the onset of the pandemic, official measures of weekly and monthly wage growth fell sharply as workers were furloughed and certain sectors, were locked down. As restrictions were lifted, estimated wage growth increased sharply – boosted by compositional effects and the unwinding of furlough. Those effects were still playing out in August 2022, albeit much weaker than a year previously. Despite these effects waning in 2022, nominal wage growth has remained strong – returning to pre-financial crisis rates (around 5-6 per cent per annum).
However, price inflation has increased much more sharply than wage growth. This has resulted in real average weekly earnings (AWE) total pay and regular pay both falling back to their pre-financial crisis levels.
The median of pay awards was generally around 3-4 per cent pre-financial crisis, after which they were more subdued at around 2.0-2.5 per cent. During the pandemic awards fell further as many firms froze pay. They returned to around 2 per cent for much of 2021 but started rising sharply as we entered 2022 – reaching around 4 per cent by August.
Nominal and real average weekly pay growth, 2002-2022
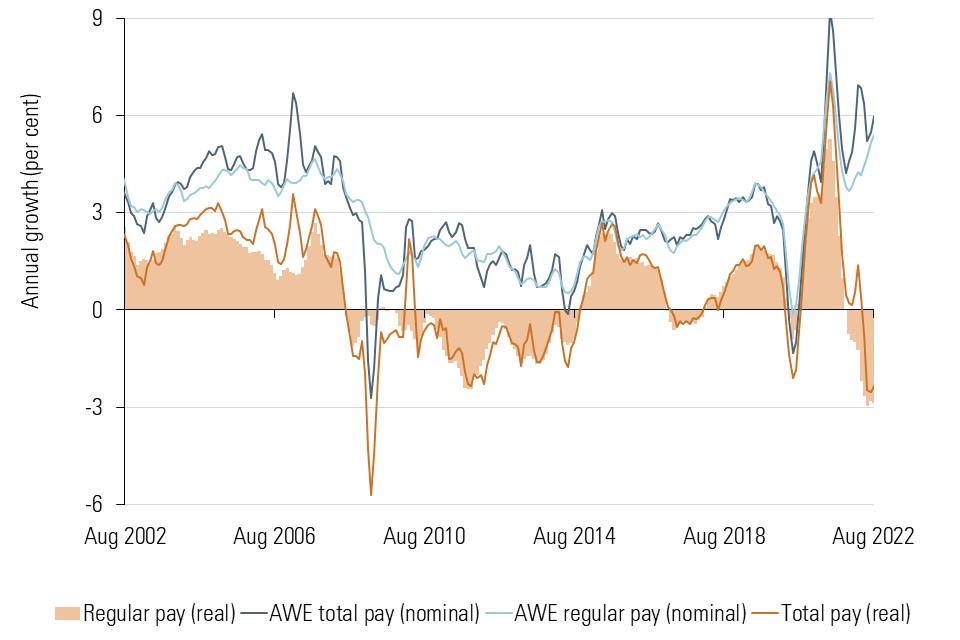
Source: ONS. Average Weekly Earnings (AWE) total pay growth (KAC3), AWE regular pay growth (KAI9), real AWE total pay growth (A3WW) and real AWE regular pay growth (A2FA), 3 month average percentage change on a year ago, monthly, seasonally adjusted, GB, 2002-2022.
Pay awards and CPI inflation, 2004-2022
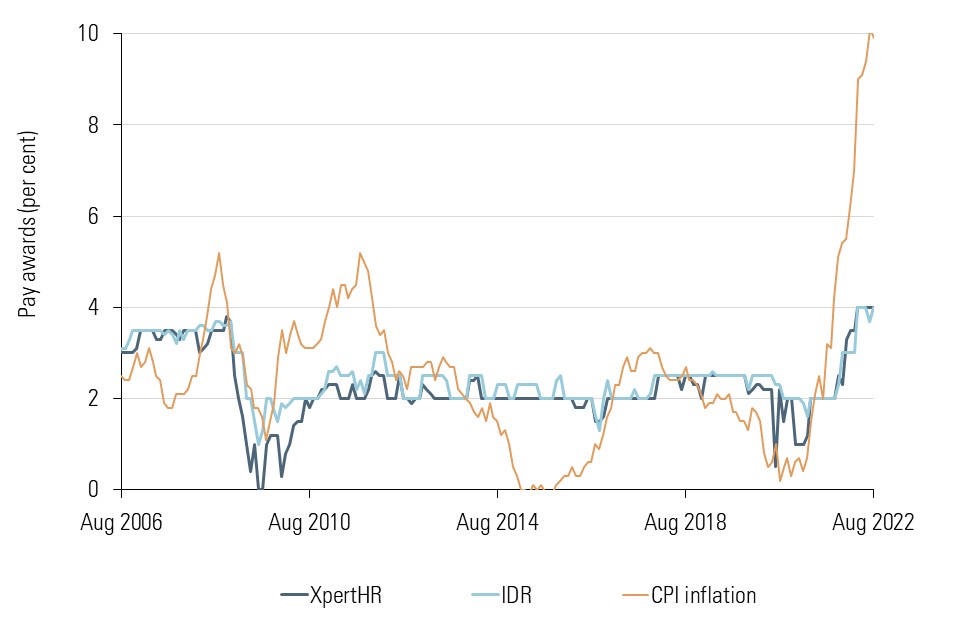
Source: IDR, XpertHR and ONS. Median of pay awards in last three months from IDR and XpertHR; and CPI inflation (D7G7), monthly, UK, 2006-2022.
11. Pay has grown faster for low-paid workers between 2019 and 2022
The NLW uprating in April 2022 came into effect during a tight labour market where wages were rising and demand for labour was at a record high.
Between April 2019 and April 2022 pay growth was strongest at the bottom of the pay distribution. Pay at the lowest decile increased by 16.3 per cent (in cash terms) between 2019 and 2022 while median pay only grew by 10.8 per cent over the same period.
The NLW is one driver of this strong nominal pay growth, increasing by 15.8 per cent. However, many low-paid workers saw their pay grow more than the NLW. This suggests other factors such as worker shortages have also driven strong pay growth for the low-paid.
We heard from stakeholders that worker shortages were particularly acute in low-paying occupations such as hospitality, cleaning and social care. In August 2022 there were 11 vacancies for every 100 jobs in adult social care in England, according to Skills for Care. High vacancies have driven particularly strong pay growth in low-paying occupations over the last three years.
Growth in hourly pay by pay percentile and growth in NLW, 2019-2022, 2021-2022, workers aged 23 and over
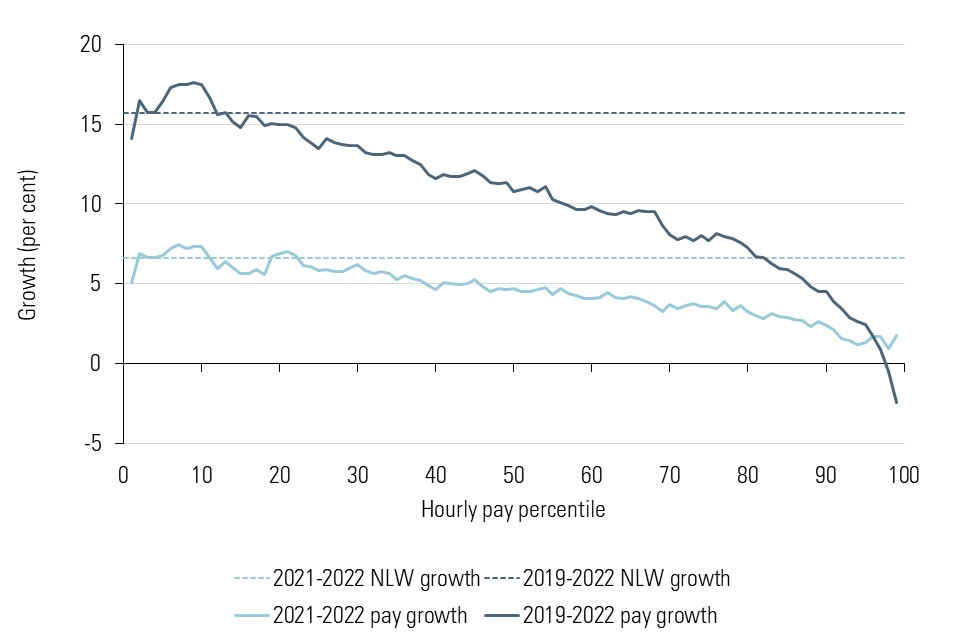
Source: LPC analysis of ASHE, standard SOC20 weights. 23+ population excluding first year apprentices. Figures before 2021 are chain-linked so they are on consistent basis with later figures . Skills for Care figure can be found [here](https://www.skillsforcare.org.uk/adult-social-care-workforce-data/Workforce-intelligence/publications/Topics/COVID-19/Vacancy-information-monthly-tracking.aspx).
12. The number of jobs paid at or below the NLW has fallen
We define coverage as jobs that pay up to 5 pence above the relevant minimum wage. NLW coverage fell between 2019 and 2022, from 6.6 per cent (1.6 million) to 5.0 per cent of eligible jobs (1.35 million) – a 24 per cent fall in the coverage rate.
This fall bucks the long-term trend (see first chart below). Between 2000 and 2015 coverage rose gradually before jumping up in 2016 following the introduction of the NLW. This fall has happened despite the NLW rising much faster than median wages between 2019 and 2022 (15.8 per cent compared with 10.8 per cent) and the inclusion of 23 and 24 year olds.
Multiple factors are driving this change. Most importantly, pay has grown strongly for workers at the bottom of the pay distribution, meaning more are being paid between 5 and 50 pence an hour above the NLW (see bottom chart). The share of jobs paid within 50 pence of the NLW has remained steady at 12 per cent. This is partly due to a doubling of employee jobs paying £10 an hour from 190,000 in 2019 to 420,000 in 2022.
The fall in coverage is also partly due to lower employment. Employment in low-paying occupations fell by 10 per cent between 2019 Q2 and 2022 Q2, as these occupations were more affected by the pandemic, but grew in other occupations. Some of these lost jobs were minimum wage jobs, but the evidence does not establish that this was caused by increases in the NLW. The Covid-induced recession hit lower-paid jobs harder and this played a role.
Number of employee jobs covered by the NMW/NLW, 1999-2022, workers aged 25 and over
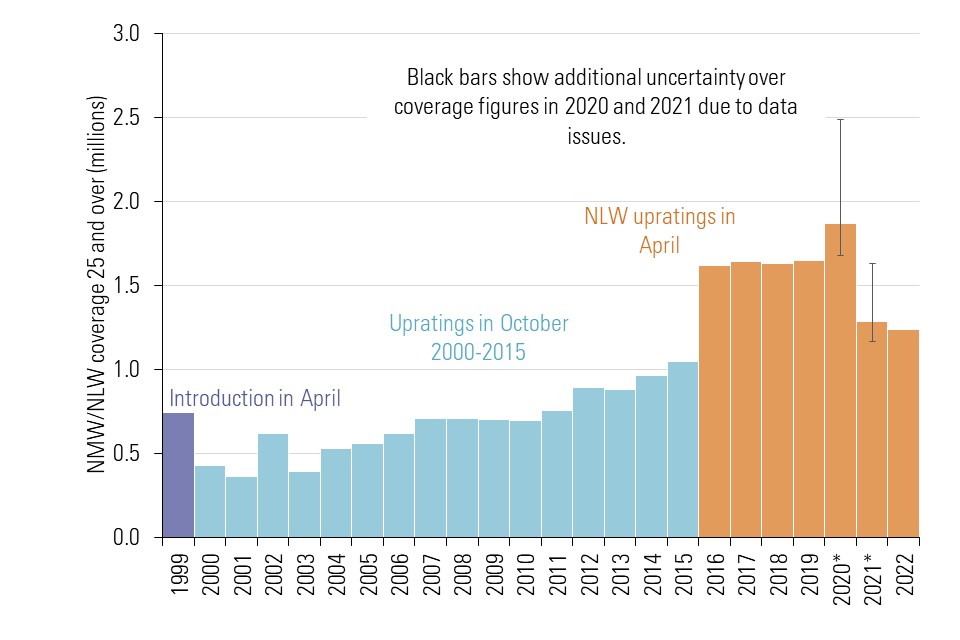
Source: LPC analysis of ASHE, low-pay weights. 25+ population. Figures before 2021 are chain-linked so they are on consistent basis with later figures. Range for coverage estimates in 2020 and 2021 based on different pay scenarios for furloughed workers, see LPC report 2021.
Per cent of employee jobs by hourly pay bands, 2016-2022, workers eligible for the NLW
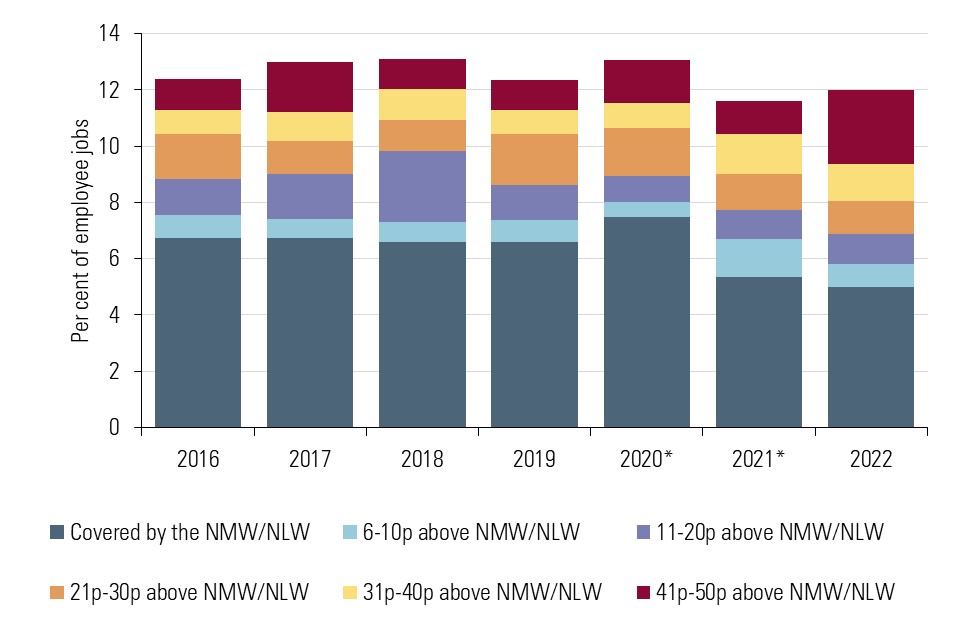
Source: LPC analysis of ASHE, low pay weights, NLW eligible population (25+ before 2021 and 23+ from 2021). Figures before 2021 are chain-linked so they are on consistent basis with later figures. We use central estimates for 2020 and 2021 figures, but there is increased uncertainty over these figures. Pay is rounded up to nearest penny in definition of categories.
13. Employment rates are down, and inactivity is up among less qualified workers
We track employment trends among groups more likely to be paid the minimum wage to monitor its effects. Between 2019 and 2022 employment rates improved for most groups of workers who are more likely to be paid the NLW. For instance, employment rates among ethnic minority workers increased by 3.1 per cent, while they fell for white workers.
However, employment rates have fallen much more among people without higher education (especially older men in this group) than graduates. The rise in inactivity we noted earlier is far more apparent for this group and suggests other factors, such as ill health and Covid, are likely driving this change rather than the minimum wage.
Employment rates for different demographic groups, 2019 Q2-2022 Q2, population aged 23-64
| 2019 Q2 | 2020 Q2 | 2021 Q2 | 2022 Q2 | Difference from 2019 Q2 to 2022 Q2, p.p. | |
| Men | 85.0 | 84.5 | 83.5 | 83.8 | -1.2 |
| Women | 75.4 | 75.4 | 75.5 | 75.5 | 0.1 |
| No disability | 86.5 | 86.4 | 86.4 | 86.9 | 0.4 |
| Disability | 54.2 | 54.5 | 54.8 | 55.2 | 1.0 |
| White | 81.4 | 80.7 | 80.3 | 80.4 | -1.0 |
| Ethnic minority | 72.5 | 75.8 | 75.0 | 75.6 | 3.1 |
| 23-24 | 75.9 | 76.2 | 77.3 | 78.2 | 2.3 |
| 25-29 | 83.8 | 84.1 | 83.7 | 83.7 | -0.1 |
| 30-64 | 79.8 | 79.5 | 79.0 | 79.1 | -0.7 |
| Total | 80.1 | 79.9 | 79.5 | 79.6 | -0.5 |
Change in employment rates (2019 Q2-2022 Q2, by age and qualification level, population aged 23-64
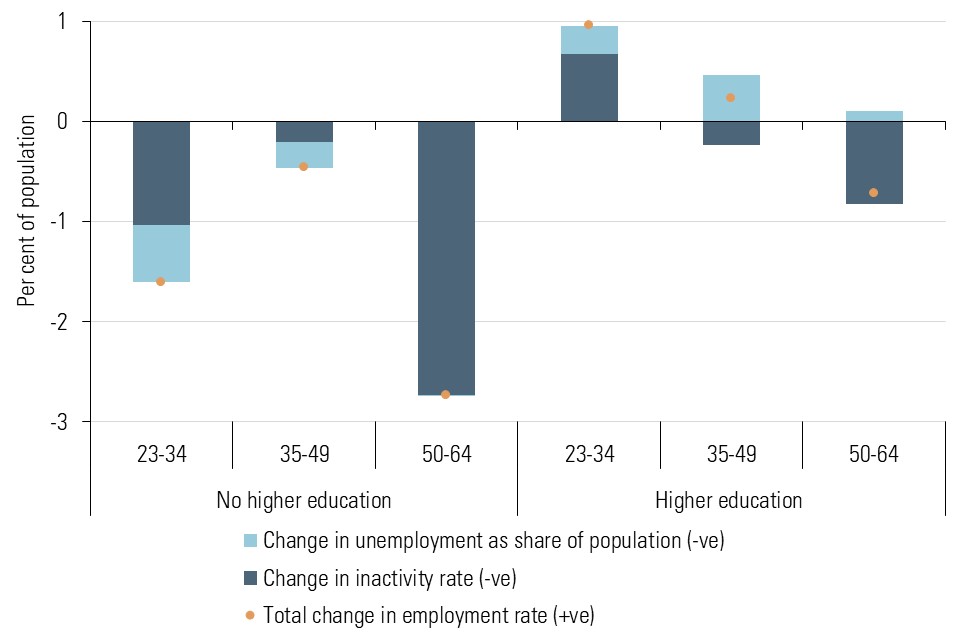
Source: LPC analysis of LFS, standard weights, 23-64 population, 2019 Q2-2022 Q2, not seasonally adjusted. Figures for individual categories also affected by changes in composition of category. Note: there was a change to LFS education variable.
14. There is little evidence that recent NLW rises harmed employment
If the minimum wage is affecting employment we would expect employment rates to fall more in areas with more minimum wage workers. The below chart shows employment rates for five different groups of local authorities, grouped by the share of minimum wage workers in that area in 2019.
While employment fell more among areas with the highest coverage during the pandemic, it has since recovered fastest in those areas. This suggests that the pandemic hit the lowest-paying areas worst (partly due to the composition of industries in those areas), rather than a negative minimum wage effect.
We also estimated the effect of the NLW on employment with two econometric methods that rely on geographical variation in the ‘bite’ of the minimum wage (the ration of NMW/NLW to median hourly pay). These studies did not identify negative impacts directly attributable to the NLW, as many low-paid sectors were affected by lockdowns and measures to control the pandemic.
Overall, we find limited evidence for recent NLW rises reducing employment. The next page explores alternative responses to the NLW.
Employment rates index by resident local authority coverage rate quintiles (2020 Q1=100, groups based on 2019 coverage quintiles), 2014-2022
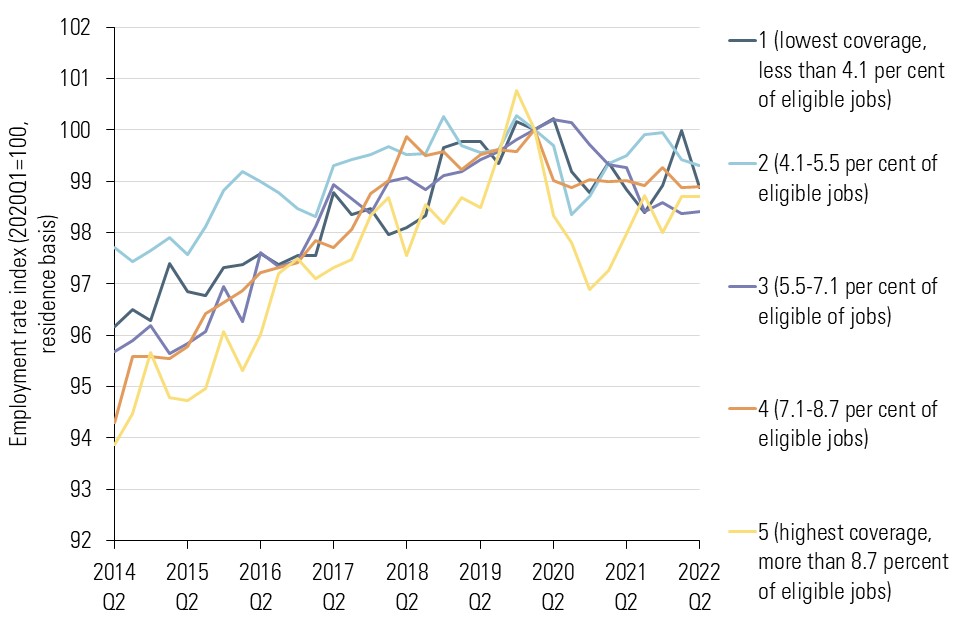
Source: LPC analysis of LFS, standard weights, 23-64 population, 2019 Q2-2022 Q2, not seasonally adjusted.
15. Employer responses to the NLW
Having consulted widely with employers and workers across the UK, we have gathered evidence of how businesses have responded or intend to respond to NLW increases.
Prices
A growing proportion of employers said they were planning to or had already responded to NLW increases by raising prices. However, rising prices should also be considered in the context of sharply rising input costs across almost all sectors. Most stakeholders were more concerned about the instability of energy prices and labour supply than wage costs.
Profits
We consistently hear that businesses respond to an increase in wages by absorbing the cost thereby reducing their profits margins. We heard from employer representatives that this is particularly true for smaller businesses however the proportion that reported this fell slightly this year.
Differentials
We heard from employer representatives that as the NLW increases, the pay for higher grades either stagnates or fails to increase at the same rate which reduces workers incentives for progression and has the potential to damage their morale. While this remains a common response to NLW increases, this year saw the proportion of employers reporting this fall.
Investment
As labour becomes more expensive and in a tight labour market harder to source, companies are encouraged to invest in technology including automation. We heard from employers that as profits are squeezed this is not always possible, especially for smaller businesses who reported low investment intentions. However, we heard from several larger firms who are beginning to look at ways to improve productivity.
Intensification
From some employees we heard evidence that as pay increased so did the intensity of their work. Employees felt that there was an expectation that with greater pay they would take on additional responsibilities often without training. This contributed to a stressful working environment.
16. Sectoral stakeholder evidence
Our UK-wide consultation with employers and workers reveals the issues specific to certain sectors.
Textiles
We published a report in June looking at enforcement and compliance in the textiles sector. We spoke with textile workers in Leicester and a range of other sectoral actors, to understand the drivers and consequences of low pay and exploitative working practices. The insecurity of workers and precarity of their roles are central to this. These factors inhibit workers from raising complaints. The textiles sector is not unique in this respect; low-paid workers across the economy face similar challenges.
Agriculture
Agriculture employers we spoke with were affected by skills shortages and by unprecedented rises in input costs. Businesses struggled to pass these increases onto retailers. We also heard from farmers that rates set by the immigration system had supplanted the minimum wage for much of their workforce. This year the Home Office introduced a minimum rate of £10.10 per hour for seasonal workers in agriculture –employers told us that this had become the de facto minimum rate for all workers in the sector.
Hospitality
In hospitality, we heard that struggles to fill record vacancies were preventing growth. Employers ascribed these in part to reduced migration, which has been restricted post Brexit. Long Covid and a desire to work more sociable hours were also contributing factors. We heard this was driving wages in some entry-level positions above the minimum wage as companies competed to recruit and retain staff.
Care
In the care sector we heard evidence from providers of the ongoing recruitment and retention crisis caused by low pay, hard working conditions and low professional esteem, especially compared with the NHS. Care workers we spoke to told us that low wages and limited progression opportunities meant they were considering leaving the sector, despite their commitment to the work. We continued to hear about the impacts of constrained funding. Stakeholders warned that policies being implemented without matched funding contributed towards a destabilised sector, leaving providers unable to fulfil regulatory commitments.
17. Young people have benefitted from the tight labour market
Young people’s employment recovered rapidly coming out of the pandemic. Employment in hospitality, where labour shortages are reported to be particularly acute, saw some of the strongest growth. 23 and 24 year olds have maintained high rates of employment since becoming eligible for the NLW in April 2021.
The tight labour market has increased competition for workers of all ages, and young workers have seen this reflected in substantial increases in hourly pay. Pay grew fastest for 16-17 year olds and for young people in low-paying occupations.
However, some young people are doing better than others. Young men’s employment has remained below pre-pandemic levels, while the share of young men not in employment, education or training has plateaued over the past four to five years.
Employment rate by age, change from 2019 Q2
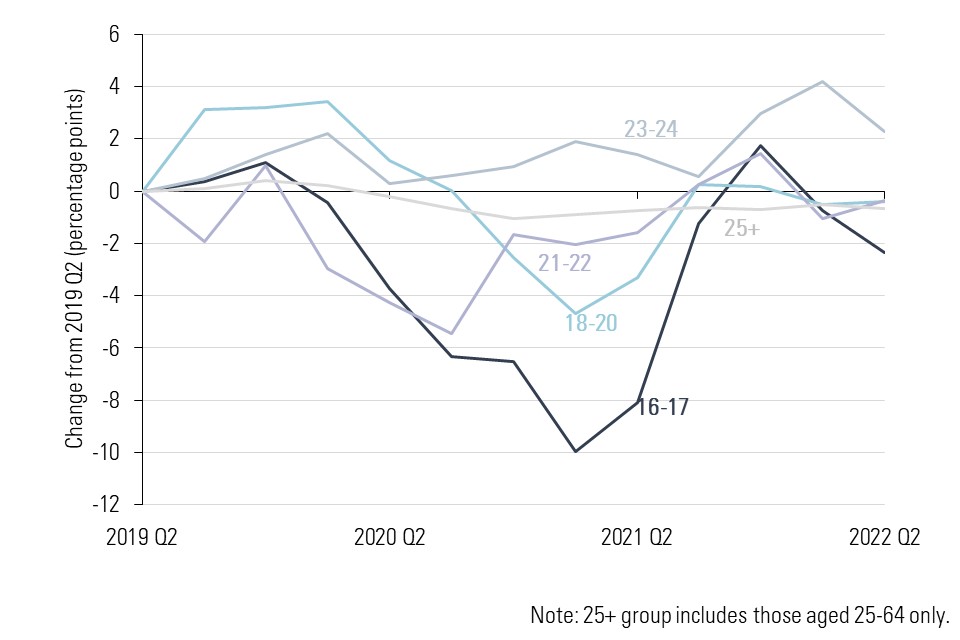
Source: LPC analysis of LFS, 2019 Q2 – 2022 Q2, standard weights, 16-64 population, not seasonally adjusted.
Change in median hourly pay by age, 2016-2022
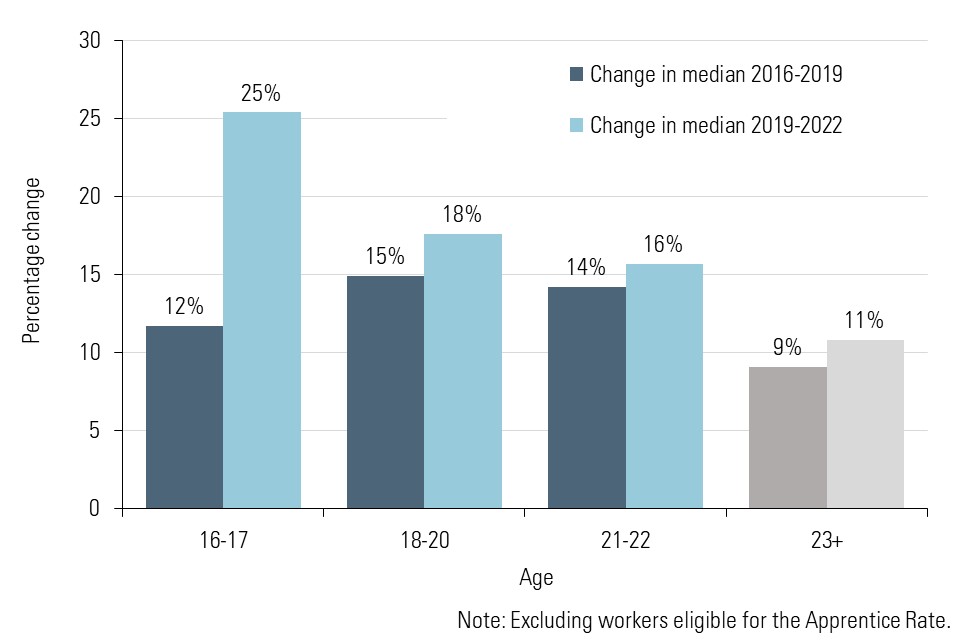
Source: LPC analysis of ASHE, 2016-2022, standard weights, 16+ population. 2019 medians are chain-linked so they are on consistent basis with later figures.
18. Use of the youth rates has declined
A tight labour market and competition for young workers has pushed up wages and reduced coverage of the youth rates. Young people are increasingly paid at rates above their NMW rates, including at the NLW and above.
As 21 and 22 year olds approach entitlement to the National Living Wage in 2024, they are increasingly paid at or above this rate (85 per cent in April 2022, up from 79 per cent in 2019).
Many employers continue to tell us they do not use the youth rates; with recruitment difficulties an increasing factor in this. However, they are more commonly used in some sectors including convenience stores, hair salons and in the equestrian sector.
Unions and some NGOs argue for the eventual removal of lower youth rates, saying that workers should not be paid differently for performing the same role. In the meantime, they recommended large increases in the youth rates.
While some employer groups called for fewer rates and more simplicity, a minority noted that youth rates reflected that under 18s cannot perform the same tasks as adults, for example serving alcohol.
Coverage of age-specific minimum wage rates and the National Living Wage, youth rate populations, 2016-2022

Source: LPC analysis of ASHE, 2016-2022, low pay weights.
19. The large Apprentice Rate rise does not to appear to have harmed starts
Apprentice starts in England have picked up following a sharp fall during the pandemic, though Level 2 and Level 3 starts – which are most likely to use the Apprentice Rate of the minimum wage – remain below pre-pandemic levels. Starts in Scotland and Northern Ireland have seen an increasing share of older apprentices (aged 25+), although Wales has seen a falloff in this age group.
The continued shift to older apprentices and higher level apprenticeships is likely driving the falling coverage for apprentices aged 19 and above. At the same time, the alignment of the Apprentice Rate with the 16-17 Year Old Rate has seen coverage increase for younger apprentices (aged 16-18). Median pay has also grown more slowly for 16-18 year old apprentices than for other young workers.
Our best available data source for apprentice pay this year is the Annual Survey of Hours and Earnings (ASHE). This allows estimates of apprentice pay and coverage by age, but not by level, and it undercounts apprentices overall. There are plans for an Apprenticeship Evaluation Survey in 2023, which would help to confirm the trends we see in pay and coverage, and to examine more detailed breakdowns.
We received little feedback from stakeholders on this year’s large increase in the Apprentice Rate. Employers continue to be concerned about falling starts and apprenticeship policy, particularly the flexibility of the apprenticeship levy. Unions continued to call for a major increase to the Apprentice Rate, which they argue prevents some from applying because it is so low.
Apprenticeship starts in England by level: 12-month rolling average, 2018/19 – 2021/2022
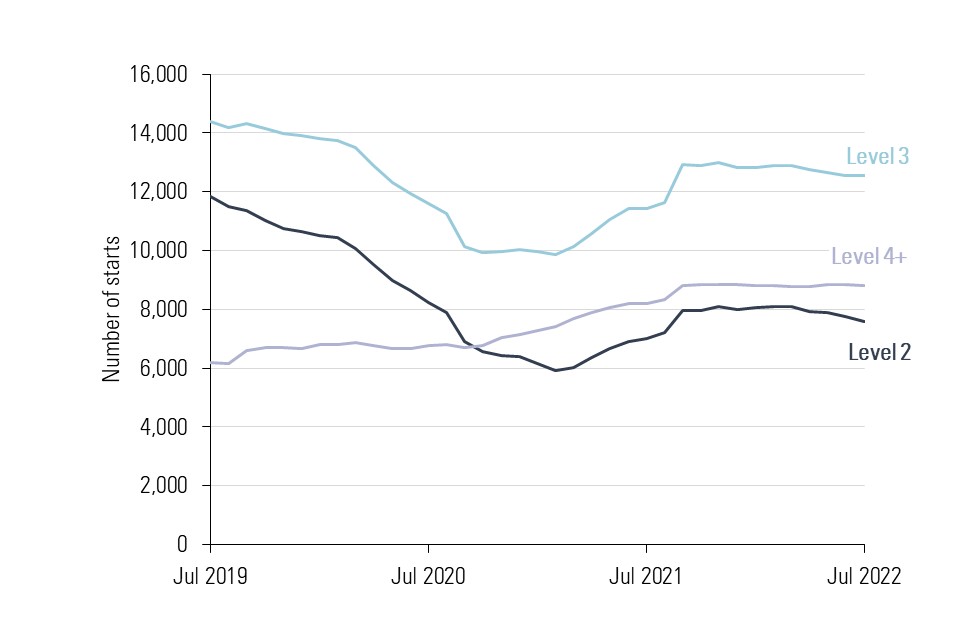
Source: Department for Education Apprenticeships and traineeships statistics (September 2022). 12-month moving average.
Apprentice Rate coverage by age and year of apprenticeship, 2019 and 2022
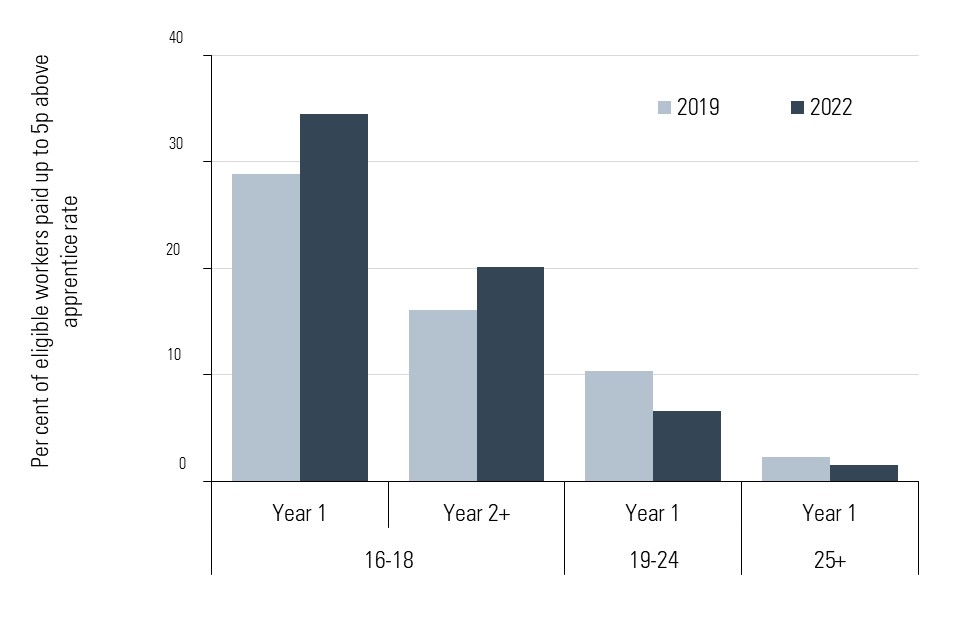
Source: LPC analysis of ASHE, 2019 and 2022, low pay weights, 16+ population reported to be participating in an apprenticeship.
20. Low-paid workers’ experiences
My hours change every week. My days change every week. Some days I’m starting at seven and working till six…and then you get others coming in two till ten. You just don’t know whether you’re coming or going.
Retail worker, Wales
The cost of living
The effects of inflation on low-paid workers’ living costs were a substantial theme in evidence from from workers and unions this year. Speaking with workers across the UK we heard that more and more are feeling the consequences of the cost of living crisis.
Repeatedly we were told that high levels of inflation have a disproportionate effect on lower-income households. These households spend a higher proportion of their income on energy, food and fuel which are all subject to higher inflation. This is driving workers to cut back on food and heating and in some instances forcing them to miss meals or choose between food and fuel.
We heard that previous pay settlements which were at the time agreed above inflation, are being quickly eroded, leaving many workers with a real-terms pay cut.
By pointing to high profits and low business failure, unions repeatedly emphasised that inflation was driven by profits and external international factors rather than a wage-price spiral.
Some employer representatives told us that while they were taking steps to support their employees by providing one-off bonuses or discounts for essential goods, ultimately it was the Government’s responsibility to reduce poverty through policy.
Insecure employment
As in previous years, we heard how the difficulty of living on low pay is exacerbated by insecure working arrangements, unpredictable shift patterns and fluctuating incomes. Unions provided us with evidence that a growing proportion of people are in insecure work including zero-hours contracts, agency, casual, seasonal and other fixed-term contracts.
From low-paid workers who worked throughout the pandemic we heard that they felt undervalued and overstretched in roles where staff shortages led to work intensification.
We heard directly from workers that inconsistencies over their working hours and therefore pay made budgeting extremely challenging. They also expressed fear over uncertainty of fluctuating hours and how this would interact with their Universal Credit allowance.
In 2018 we made recommendations to Government on how to tackle what we termed “one-sided flexibility”. We await action in response to these.
Unions called for more enforcement in the gig economy and warned of a growing number of workers being classified as self-employed by their employers to avoid entitling them to basic employment rights such as the minimum wage.
We heard that as childcare costs increase, low-paid workers are forced to make hard choices regarding overtime and accepting more hours, as in many cases the additional pay barely covers the extra childcare costs. Where workers are not on fixed hour contracts childcare scheduling can become extremely challenging.
21. Accommodation Offset
Have wonderful accommodation and have a happy workforce. Don’t do that, don’t have any workers. It is as simple as that.
Agriculture employer
This year we have reviewed the Accommodation Offset. We will publish our findings and recommendations shortly.
We carried out a review to deepen our understanding of some key aspects of the offset:
•In what sectors and circumstances do employers provide accommodation and apply the offset?
•How do our recommendations on the offset affect employers’ decisions, particularly over whether to invest in accommodation?
•Who are the workers affected by the offset, and what is their experience of living in accommodation provided by their employer?
Our review has identified two areas where we would like to see changes, to better protect low-paid workers affected by the offset.
Accommodation quality
We recognise that many employers are committed to providing good-quality accommodation. In many circumstances there is a sound business case for them to do so, to attract and retain workers.
Nevertheless, the type and quality of accommodation offered to workers remains variable. For some migrant workers, the accommodation they find does not match what was described or promised to them. We believe there needs to be greater assurance of the quality of the accommodation for which the offset can apply.
Impacts on workers with low weekly pay
We are concerned that current arrangements leave workers with low weekly hours at risk of very low income if the offset is taken in full. We have seen and heard evidence of workers with cancelled shifts or short hours having to pay the full offset with little earnings.
We have also seen examples of employers with measures in place to protect workers against this risk. We are considering a minimum hours requirement for these workers before accommodation costs can be deducted.
Other interactions
The Accommodation Offset is extensively used in the agriculture and horticulture sectors, where many employers use seasonal worker schemes to find their workforce. Visa conditions mandate rates of pay above the NLW, but fail to take account of the offset; we will look at these interactions in our full report.
We are also minded to recommend that seafarers be exempt from the offset while on board ship. This is because seafarers have no choice in whether or not to make use of the accommodation.