Good practice in the design and presentation of customer survey evidence in merger cases
Updated 23 May 2018

© Crown copyright 2018
This publication is licensed under the terms of the Open Government Licence v3.0 except where otherwise stated. To view this licence, visit nationalarchives.gov.uk/doc/open-government-licence/version/3 or write to the Information Policy Team, The National Archives, Kew, London TW9 4DU, or email: psi@nationalarchives.gov.uk.
Where we have identified any third party copyright information you will need to obtain permission from the copyright holders concerned.
This publication is available at https://www.gov.uk/government/publications/mergers-consumer-survey-evidence-design-and-presentation/good-practice-in-the-design-and-presentation-of-customer-survey-evidence-in-merger-cases
Introduction
Status of this document
During our merger casework, the Competition and Markets Authority (CMA) sometimes receives submissions of evidence derived from surveys of customers that have been commissioned by the merging organisations (‘Parties’) or their external advisors for the specific purpose of helping to understand aspects of a merger. We believe that the use of statistically robust customer survey research can be very important in reaching informed decisions, and we very much welcome this type of evidence.
This document sets out our general views on good practice in the design, conduct and reporting of such surveys. While the Parties and their advisors are the primary intended audiences for this document, it may also be of interest to market research agencies involved in designing and conducting surveys for merger cases.
Where appropriate, the CMA may commission its own survey research and, if so, the survey design, analysis and interpretation of results are informed by in-house statisticians who work closely with inquiry teams and the market research agencies commissioned to conduct the research on our behalf. The principles described in this document apply equally to these surveys.
This document focuses on surveys for merger cases, but many of the principles are applicable to other types of case which the CMA conducts, such as market studies and market investigations, Competition Act enforcement cases, super complaints or consumer protection enforcement cases. However, the uses of survey evidence and the nature of cases themselves can vary and assessments of fitness for purpose need to take this into account.
Generally speaking, the aim of a statistical sample survey is to interview a small proportion of people from a large population of interest (for example, a few hundred customers from the many thousands who use a cinema chain) in such a way that robust inferences can be made from their responses about the population as a whole. Research to inform our investigations may be, alternatively or in addition, ‘qualitative’ in nature, for example, in the form of focus groups or in-depth interviews. Good practice for qualitative research methods is outside the scope of this guidance.
For brevity, this document ‘Good practice in the design and presentation of customer survey evidence in merger cases’ is referred to as ‘this document’. It replaces the document published in 2011 by the then Office of Fair Trading (OFT) and Competition Commission (CC)[footnote 1]. It should be noted for the avoidance of any doubt that this document does not constitute guidance under section 106(1) of the Enterprise Act 2002.
This document is about customer survey research for merger cases. We use the term ‘customer’ here in a loose and non-technical sense. Usually the CMA will be interested in surveying the person (or an entity, such as a business) who buys a product or service directly from (one of) the merging Parties. However, this is not always the case. For example, sometimes the CMA is interested in surveying the end-customers of products or services even if they do not purchase the product or service directly from the Parties.
This document provides principles and examples for illustration, not hard and fast rules or bright-line tests. We recognise that circumstances vary and that knowledge of the relevant scenario, along with judgment and reason, will be required in applying customer survey research methods to a particular case. Where time and/or resource constraints mean that the research possible under particular circumstances cannot comply fully with all of the principles set out here, we will still consider its use to the case.
Submissions that follow the principles set out in this document are more likely to be given evidential weight in the CMA’s merger investigations.
Customer survey research conducted by Parties in the normal course of their business, for example to inform strategy prior to a merger being considered, may also have evidential value for the purpose of a merger inquiry. The interpretation and use of such evidence, and weight to be given to it, will depend on the nature and purpose of the survey and the way in which it relates to the merger case. For example, there are some circumstances in which the CMA would take more account of a survey if it was clear the Party has acted on the results.
This document offers illustrations and examples drawn from recent experience in merger cases that are intended to assist in the design of good customer research. These illustrations are included by way of example and are not exhaustive, nor will they be applicable in all cases.
We would encourage Parties and their external advisors to use what they consider to be the most appropriate research techniques to generate robust evidence. The omission of a particular research technique from this document does not imply that it is invalid, or that the results would not be given evidential weight in appropriate circumstances.
This document is a technical resource to assist Parties in submitting customer survey research evidence that may be given weight in an inquiry. It is without prejudice to the provisions of the Enterprise Act 2002, as amended, and without prejudice to the advice and information in the Quick guide to UK merger assessment and the Merger Assessment Guidelines originally published jointly by the OFT/CC.
Uses of surveys in merger cases and procedural issues
Survey evidence has been submitted to the OFT/CC/CMA in numerous merger cases, by the Parties themselves and by third parties. Most surveys conducted primarily for the merger case itself have been submitted by the Parties as part of phase 1 of a merger case. However, a small number of such surveys have been conducted at phase 2.
In contrast, all the surveys commissioned by the CMA have been run as part of phase 2 merger cases. A small number of surveys have been run by the CMA itself during phase 1 of a merger case, all of which (to date) have been online using customer lists with email addresses supplied by Parties.
The CMA considers a large number of factors when making a decision about whether to conduct a survey in a merger case. For any individual case these will include: the theories of harm to be tested, the range of evidence available (or planned) and anticipated evidential gaps, the nature and number of customers in the market, the practical options for contacting and surveying a sample of these customers, and the feasibility of obtaining survey results of sufficient quality to be fit for purpose within the time available. The CMA also has to be mindful of the cost of the research, to assess whether it would be a good use of public money.
The CMA is obliged, under the Merger Guidelines, to give Parties 24 hours to comment on a draft questionnaire for any survey that it intends to commission as part of a phase 2 merger inquiry. In practice, we always try to allow longer and also provide a description of the overall survey methodology (sample design, mode of interview, etc). We endeavour to provide Parties with a similar opportunity to comment if we conduct survey research as part of a phase 1 investigation.
When designing a survey, it is important to start with a clear view of the objectives of the research. From the Parties’ point of view, it is desirable to give the CMA as much time as possible to consider details of the research planned in order to address any concerns the CMA has about it. However, discussions about the survey should not be seen as the CMA giving its approval for the survey.
Looking at merger cases over time, there are some commonly occurring ways in which survey evidence has been relevant to the inquiry and has had an impact on decision-making. These translate into the following topic areas for merger survey questionnaires:
- Demography – to understand the demographic characteristics (for example, age, sex, education) of customers in the market. In some cases this can be useful in assessing the extent to which the Parties’ customers are differentiated, for example, whether there is evidence that their products or services appeal to different types of people. Note that responses to demographic questions can also be used to evaluate whether the survey respondents are representative of the population of interest (particularly when benchmark population distributions are available to compare them against), and for weighting purposes.
- Choice attributes – to understand how customers make choices in the market of interest, including the relative importance of such factors as price, quality, range, service, location and brand. Other aspects of the purchase decision that may be of interest include the extent to which it was planned or made on impulse, search activity, brand awareness and level of knowledge about the market and competitor options.
- Geography – to understand the geographical aspects of the merger, for example, how far customers travel (measured in distance and/or time) to obtain the product or service and the location of firms (particularly in cases with local area theories of harm). This is often done by asking customers how they have travelled to the Parties’ premises, which mode(s) of transport they have used, how long it has taken, and where they have travelled from (including whether this is from, for example, home or work).
- Cross-channel substitution – to understand the extent to which customers switch between or make use of different purchase channels (usually in-store and online). This can be particularly important in cases where, for example, a bricks-and-mortar retail merger is the subject of the inquiry but it is important to assess the nature and strength of potential or actual online constraints on the bricks-and-mortar outlets. (in these cases, we are interested in the behaviour of customers of bricks-and-mortar stores, for example would they switch to online channels)
- Closeness of competition – to estimate the closeness of competition between the Parties themselves, and between the Parties and competitor third parties. This is often the most influential part of the survey[footnote 2], using hypothetical diversion questions to elicit ‘next best’ options (alternatives/substitutes) from respondents[footnote 3].
The above does not provide an exhaustive list; there are many other potential topic areas that might be relevant to particular markets and, accordingly, form part of the questionnaire for a particular case.
Timing should be a key consideration for Parties and their external advisors when considering whether to conduct a survey. Survey evidence that is submitted too late or is of insufficient quality to be taken into consideration is a waste of time and resources. The general principle on timing is that the earlier the CMA receives survey evidence, the more time we will have to consider it and provide our assessment of the survey’s quality and relevance to the case, along with our analysis and interpretation of results, to the Parties for comment.
For phase 1 mergers, the CMA ideally should receive survey evidence before the phase 1 clock starts. In practice, the CMA will not have sufficient time to fully consider new survey evidence received after the submission of a Party’s response to the issues letter. This would be too late for the CMA to decide whether a survey is of sufficient quality to be given evidential weight, particularly if we have not had sight of the survey materials up to that point.
Parties wishing to conduct a survey for a merger case are strongly encouraged to contact the CMA in the early stages of the survey process to discuss their proposed design, including a draft questionnaire (if available) and wider aspects of the survey methodology.
Any discussion with the CMA would be on a ‘without prejudice’ basis and would not preclude developing or changing views on the evidential weight of a piece of customer survey research on either side. The discussion should not be seen as an alternative to rigorous testing and piloting by the Parties of the planned survey approach and research instruments. As part of its assessment of the quality of the survey, the CMA may ask to observe or listen to certain aspects of the operation of the survey, including the interviewer briefing ahead of fieldwork and/or live interviews once fieldwork is underway. The CMA expects the Parties to accommodate these requests. If, for whatever reason, the Parties are unable to accommodate the CMA’s requests, the CMA may be unable to assure itself on the quality and reliability (and hence the evidential value) of the survey.
Where Parties do not discuss their survey design with the CMA in advance, and/or do not give the CMA an opportunity to monitor and assess the quality of fieldwork while it is underway, it is not necessarily the case that we will consider the survey findings to have no or only limited evidential weight. The weight to be given to such evidence will be assessed against the same principles and standards for conducting surveys described in this document. However, it has been our experience that survey designs not discussed with us in advance have tended to be of insufficient quality, and in the absence of first-hand experience of how fieldwork was conducted, it has been hard to conclude that the findings have genuine weight. In these circumstances, then, the onus will be on Parties to provide highly compelling information about the survey methodology and the steps taken to assure its quality.
We expect good surveys to be neutral and not biased towards one outcome or another. Given the nature of the phase 1 legal test, there is a particular risk to Parties that survey results beneficial to their case may be given little or no weight if they are perceived to have been led by a biased survey design.
We aim to be open and transparent in our work. We will consider requests from Parties in merger cases for the disclosure of underlying information and analyses derived from the CMA’s own customer survey research. However, these requests may be subject to important legal and practical constraints on our ability to disclose such information. These include provisions of the Enterprise Act 2002, as amended, the Data Protection Act 1998 (soon to be replaced by the General Data Protection Regulation), and the statutory timetable for each merger inquiry.
Working with market research agencies
The CMA commissions market research agencies to conduct most of its survey work. The choice of agency, and of the team within the agency, is a key decision affecting the survey quality achieved.
CMA research that provides evidence for merger cases is conducted to high quality standards, and in many cases we place requirements on agencies that go over-and-above standard practices. In particular, for the surveys we commission we take a keen interest in how the survey is conducted after the survey design and questionnaire have been agreed. For example, if interviews are to be conducted using a face-to-face or telephone methodology, then we would ask to see and make changes as appropriate to interviewer briefing materials. We like to participate in the interviewer briefing where possible, and check the quality of fieldwork ourselves (in addition to the agency’s own monitoring), requesting changes where we think it appropriate. This might involve changing a question, the interviewer instructions and/or interviewing personnel, or asking for an interviewer re-briefing, additional supervisor checks or adjustments to interviewer schedules, as appropriate. Our involvement is aimed at driving up the quality of the survey fieldwork, as well as understanding how the survey has worked in the field, which we see as an important part of interpreting the results.
We encourage Parties and their external advisors to use the same hands-on approach to monitoring the merger-related customer surveys they commission. Survey data can only be as good as the fieldwork that generates it, and interviewer instructions and a survey questionnaire are often interpreted and implemented in unexpected ways by interviewers. Respondents’ reactions, interpretations and answers can also differ from expectation, even when the survey has been extensively piloted.
If the Parties are able to demonstrate to the CMA that a survey has been conducted well, and show an understanding of how the survey has worked in practice, this will foster confidence in the survey results, and assist the CMA in assessing the evidential weight that may be attached to the findings.
We would expect market research agencies working for Parties and their external advisors to observe the MRS Code of Conduct, and to have appropriate qualifications to demonstrate their commitment to quality, for example, an ISO accreditation or similar. It is not considered good practice to sub-contract fieldwork without stringent and transparent processes to ensure high fieldwork standards.
Design
Sound statistical research requires that the survey design adheres to certain principles, in particular that:
- the population of interest is clearly defined
- the sample source provides a representative coverage of the population;
- the sample is selected using random methods and the sample is of sufficient size to provide robust estimates
- the interview method is appropriate for researching the audience and subject matter
- the survey is notified to potential respondents in a neutral way that does not bias results
- the questionnaire is well-designed, and is properly tested and piloted in advance
- the fieldwork team is appropriately briefed, and interviewing quality monitored, as appropriate
- the design takes account of likely response rates, the need to minimise the potential for non-response bias and, where possible, incorporates metrics to measure and adjust for such bias [footnote 4]
Target population
Customer survey research involves defining a population of interest and then interviewing a sample from that population. This is done so that measures relating to the population may be estimated, and the sampling uncertainty in the estimates quantified.
In merger cases we are often interested in sub-populations, for example customers from specific geographic areas, or customers from each of the Parties separately, as well as an overall population of interest. Where such sub-populations of interest exist, these should be clearly set out in advance to inform the sample design.
Sample source and survey mode
Having defined the population of interest, the next task is to identify the best way of finding people who are in this population, ie the best source of sample to provide a representative coverage of the population. A variety of sample sources may be considered, including:
- intercepting customers close to the time of purchase, for example as they leave a store (often referred to as an ‘exit survey’)
- customer lists provided by the Parties
- external lists from reputable sources
- customers free-found using a random sampling technique [footnote 5] (for example random digit dialling or face-to-face omnibus interviews)
The following sections consider each of the 4 types of sample source listed above in more detail. Some problematic alternatives will then be discussed.
Intercepting customers at stores
One possible survey objective may be to investigate whether competition takes place locally and, if so, the extent of such competition, for example what are the locations of the firms that constrain each of the Parties’ outlets. In these cases, ideally, customers should be surveyed from all of the Parties’ outlets in areas of concern in order to determine the competitive constraints on them.
For this type of survey, a common approach is face-to-face interviewing with customers as they exit the store. This allows the interviewer to focus the interview on purchases just made, and to measure potential diversion accordingly.
Alternatively, customers may be recruited to the survey at the store (or bus stop, cinema, etc) by collecting postal, telephone and/or email contact details for a follow-up interview. This has the advantage of minimising the time demanded of customers ‘there and then’. However, significant over-recruitment will usually be required to ensure that the required number of follow-up interviews is achieved.
Whichever approach is used, time and resource constraints often make such surveys difficult and so it is important to consider very carefully which outlets to survey. Where there are many outlets for which the CMA considers there to be a competition risk, then sometimes it is possible to eliminate a sufficient number by taking account of existing information, to leave a practicable number of outlets for surveying purposes[footnote 6].
If, following the application of this initial cut, the number of outlets is still too high to survey them all, then a number of strategies might be adopted to decide which outlets to sample. The context of each case will be different, but there is often a need for this sample to form the basis of inferences about Parties’ outlets that have not been surveyed as well as providing direct survey estimates for those that have[footnote 7]. Approaches for the choice of outlets to survey may include:
- random sample – randomly selecting either outlets or overlap areas
- stratified random sample – categorising outlets or overlap areas by characteristics that may have an impact on competition (for example competitor fascia count, whether rural/urban/London) and randomly selecting outlets or areas within each of these categories [for example Ladbrokes/Coral]
- competition gradient – ordering outlets or overlap areas by a competition metric (for example distance between the Parties’ outlets) and selecting outlets or overlap areas in a defined way (for example at fixed intervals) from the ranking [for example Celesio/Sainsbury’s]
- discriminative sample – selecting a set of outlets to survey that maximise the variety and combinations of different characteristics (for example size of outlet, type of outlet, distance to the nearest merger Party outlet, type of area, number and type of third-party competitors, etc) that might be relevant to an assessment of the nature and strength of the competitive constraint that the merger Party has on that outlet [for example Poundland/99p Stores]
Please note that the same issue of selecting a subset of outlets or areas to survey may arise while using other types of sample source, but we mention it specifically in relation to intercepting customers at stores because having a large number of outlets would make this particular type of survey prohibitively expensive.
It is important that the method employed is applied objectively, avoiding cherry-picking of outlets unless this is a clearly stated part of the interpretation of the results (for example choosing a subset of outlets most likely to create competition issues with the aim of showing that if the Parties are not close competitors in these outlets then they are unlikely to be anywhere else).
In exit surveys, it is important that interviewers approach potential respondents at random (rather than target those who they perceive to be more likely to take part). Sometimes, additional rules may need to be set to ensure that customers selected for interview at the outlet are representative of the population of customers at that outlet. For example, the survey design may require interview quotas if there are known characteristics of the customer population that should be reflected in the sample, or interviews may need to be carried out on specified days and at specified times of day to reflect the known footfall of customers using an outlet.
Customer lists provided by the Parties
Where they exist, customer lists supplied by the Parties may be used. Care must be taken to ensure that the list(s) match, as far as possible, the target population(s). Any under-coverage (particularly exclusion of specific sub-groups of customers) or over-coverage should be recorded and consideration given to any assumptions made about any inference from the survey population [for example Cineworld/City Screen where assumptions about under-coverage were tested with a small validation survey].
In many merger cases, all eligible customers in the list are included in the sample. However, if the number of customers in the list is very large, then a sample can be drawn from it at random. There may be other information about customers (for example demographic or categorisation characteristics) that may be expected to have an influence on their behaviours or attitudes with respect to the surveyed market. If so, the sample should have broadly the same composition by those characteristics as does the population. This may require stratification of the sample list before drawing the sample and/or interview quotas or post-stratification weighting to ensure that the achieved interviews are representative.
Where there are specific sub-populations of interest, the sample list should be stratified by those sub-populations to ensure that a sufficient number of respondents for each is obtained. Over-sampling of a sub-population may be necessary to achieve this.
While not exhaustive, the list below describes the methodological options typically considered in merger cases when interviewing from customer lists. Judgement is required as to which is the best approach, as there are advantages and disadvantages to each.
- Telephone survey: The response rate from a telephone survey can be higher than from an online survey, reducing the risks of non-response bias. This is particularly true when surveying businesses where there is the added advantage of being able to ensure that an appropriate person within the business is responding. Interaction with an interviewer also provides more opportunity to ensure that questions and response item lists are communicated in full and understood as intended. However, telephone surveys can be more expensive and time-consuming to conduct compared with other research methods and their usefulness depends upon having a good starting list of customer contact details.
- Online survey (email or SMS invitation): Online surveys tend to be cheaper and faster to undertake, and may be a more natural method in some sectors, for example technology and online media, where the customer base is likely to be more responsive to an email survey. If the list of customer email addresses is very long (for example 10s of thousands) then a large-scale online survey may be possible. In some circumstances, this can overcome the problem (discussed above) of needing to sample outlets to survey. However, response rates to online surveys are often low and the quality of responses is often not as high as when the respondent is interacting with an interviewer face-to-face or by telephone.
- A combination of the above (mixed mode): A mixed interview method might be considered where, for example, the customer list contains both email and telephone contact details for each person and a follow-up telephone interview can be attempted with anyone who does not respond to the initial email invitation to participate in an online survey. Alternatively, where it is possible to contact some of the sample by email but not telephone, and others by telephone but not email, a mixed method approach may be appropriate.
However, particular care is needed in using mixed method approaches. Any solution which involves a mix of interviewer-administered (for example telephone) and self-completion (for example, online) survey methods can be biased by modal effects, ie the results between the 2 methods are different simply because of the method of interviewing. Potential modal effects can be mitigated by ensuring that questions are asked in exactly the same way across each method. For example, if a question in a telephone survey is asked with an open-ended spontaneous response format, the online survey question should be asked in the same way.
This said, there are potential modal effects that may not be eliminated entirely even with the best questionnaire design. For example, in telephone interviewing the interviewer is typically instructed to prompt and probe respondents to capture full and considered responses, whereas there is no such parallel in an online survey. This explains why the number of answers to a question where multiple response is allowed (for example ‘which brands have you used in the last 3 months’?) tends to be higher in a telephone survey than in an online survey.
Regardless of interview method, it is important that no systematic difference in response by customer type ensues. If one type of customer is more likely to respond to the survey than another, the achieved sample will misrepresent the population. So far as possible, therefore, the survey design should include strategies to maximise the response rate and to minimise the risk of significant non-response bias.
Where time permits for a telephone survey, and the appropriate contact details are held, a pre-notification letter or email outlining the purpose of the survey is likely to increase the response rate, as is a carefully worded survey introduction that explains the purpose of the research.
For an online survey, again where time permits, it is usual to send a reminder to those customers who have not responded to the initial survey invitation within the first few days of fieldwork. Ideally, the fieldwork period should span at least one weekend, so that the opportunity for ‘time poor’ customers to respond is maximised.
Where there are no customer lists of sufficient quality, external lists from other reputable sources (for example Dun & Bradstreet for businesses) may be considered. Appropriate screening will be required to ensure that only genuine customers of the Parties are recruited, and it will be even more important to assess the extent to which the lists represent the target population.
Free-finding customers
Where no customer or reputable external lists exist, free-find sampling methods are possible (for example telephone random digit dialling or face-to-face omnibus surveys) but they can become expensive to use if the proportion of eligible individuals in the general population is low.
These are well-established research methods used within the research industry. However, it is important to ensure that the recruitment approach used with these methods is robust, with proper rules for the selection of households and individuals within them. As with external list sources, appropriate screening will be required to ensure that only genuine customers of the Parties are recruited.
Telephone numbers for random digit dialling should include mobile-only households, noting the increasing prevalence of households without a landline in the UK.
More problematic sources: street recruitment and online panels
Some customer sources that are used in commercial research are generally not considered sufficiently robust by the CMA for merger cases. In particular, we advise against recruiting customers:
- on the street
- from panels with non-random samples (ie most online panels)
On-street recruitment is likely to generate sample bias. For example, interviewers may not approach potential respondents at random as they should (tending to target those they perceive to be more ‘willing’ or likely to take part in a survey instead). Time and place of interviewing may also have a bearing on the type of people who are in the vicinity of the interviewer.
Sample bias is also a concern when respondents are drawn from a panel, in particular from an online panel, where sample recruitment does not rely on randomisation methods. Whilst a panel can be made to look like a random, representative cross-section of consumers in terms of its demographic profile, the characteristics of people who join a panel may be very different from other consumers. For example, evidence in the research literature suggests that those who join an online panel spend more time on the internet and engage more actively than other consumers in searching for better deals online. For a merger inquiry where channel substitution issues can be important, this could be a flaw. The CMA tends to place less evidential weight on surveys involving customer recruitment from panels, though each case is treated on its individual merits.
If panel sources are used, transparency and rigour of panel recruitment and data weighting methods will be factors in the CMA’s evaluation of the survey results.
Sample size
In the surveys it commissions as part of a phase 2 merger inquiry, the CMA aims (as a general rule) to achieve a minimum of 100 completed interviews with any pre-defined group of interest for rigorous analysis (for example if analysis is required at an individual outlet level, a minimum of 100 interviews per outlet is needed). If there are other pre-defined sub-populations of interest within a more general population of customers, then the same threshold applies.
The target of 100 is not always met. Below this threshold, the CMA puts less reliance on statistical inferences about corresponding populations and will interpret and report results in a way that cannot be automatically applied to the whole population – for example, “23 of the 61 respondents who were customers of Party A said they would divert to Party B”, not “38% … said …”.
In some cases, survey analysis might retrospectively reveal other groups with particular characteristics of interest. It is difficult to design a survey to ensure a sufficient number of interviews within all potential groups of interest, as these may only become evident at the analysis stage. The sample size requirements should be considered at the survey design stage, taking into account the implications of the likely response rates on the resulting numbers of interviews. Weighting a survey dataset reduces effective sample sizes, sometimes very considerably. It may be the case that the unweighted sample is above the threshold of 100, but the effective sample size of the weighted sample is below 100, in which case care should be taken to present results appropriately.
Survey validation across modes
Where there is concern about potential for sample bias with a chosen method, a parallel validation survey using another research method may provide evidence as to whether or not such bias exists. For example, if the main survey is conducted online, a telephone survey conducted with a smaller sample, or within a specific sub-group, may be helpful in validating the results of the main survey[footnote 8].
Incentives
There is no hard-and-fast rule about whether to use a respondent incentive (for example a gift voucher or entry into a prize draw) to increase the response rate to a merger inquiry survey. The CMA usually has no objection to their use, particularly where a low response rate is reasonably expected and would be a concern.
Advance letters/emails and introductions to respondents
Care should be taken when drafting materials such as pre-notification letters/emails and survey introductions to ensure there is nothing in the wording that gives rise to an unplanned excessive level of participation in the survey by a type of customer with one view on the subject, in preference to another type of customer with a systematically different view.
Advance letters/emails should explain the purpose of the survey and how it will be conducted. Importantly, though, framing effects normally should be avoided so there must be no mention of a merger inquiry: the survey’s purpose should be described as seeking customer views more generally.
In addition, such letters/emails will normally:
- be on agency or commissioning organisation “letterhead” (as appropriate) signed by an appropriate authority
- be kept short and focused purely on the survey
- explain how the customer will be contacted, and when
- include contact details (telephone and/or email) for potential respondents to use if they wish to opt out of the survey
When designing introduction scripts for an interviewer-administered customer survey, an appropriate context needs to be established for the questions being put to respondents, so that respondents know what is being asked of them and why. Again, though, there normally should be no mention of a merger inquiry, and other information provided about the research should not be in any way pre-emptive of the survey questions.
Introductions should be delivered clearly in understandable blocks of plain English, but it is good practice to avoid long introductions which may serve to discourage survey participation. For interviewer-administered surveys, a useful technique to keep introductions short is to add scripts that can be used at the interviewer’s discretion, to help clarify the task and reassure respondents. For example:
- “This survey is purely for research purposes; no attempt will be made to sell you anything either during or after the survey.”
- “Everything you say is confidential and no responses will be attributed to you individually.”
- “Your views are important; this research is being used to find out what people like you think about …”
- “This survey will take about x minutes to complete.”
- “This survey is being conducted according to the Market Research Society code of conduct.”
- “You should have received a letter of introduction about the survey a week or so ago.” (Here, it is also helpful if interviewers have a copy of the letter to hand, which can be posted/emailed/read out to the respondent as appropriate.)
In interviewer-administered surveys, respondents should have an opportunity to ask questions of clarification before the main part of the interview begins. However, it is important that the interviewer adheres to the script provided in the survey introduction, and uses the reassurances exactly as written, to avoid any unintentional bias in respondent recruitment.
Interviewer briefing and monitoring
Strict adherence to the questionnaire script during interviewer-administered surveys is a key principle for merger inquiry research. Interviewers must follow interviewer instructions, including reading the questionnaire script verbatim, and not attempting to paraphrase anything. This can be difficult to achieve in practice, and based on its experience the CMA has come to the view that the following is the best way of ensuring that interviewers adhere to this principle.
Where questionnaires are interviewer-administered, either by telephone or face-to-face, there should be a full briefing of all interviewers scheduled to work on the survey before fieldwork starts. The purpose of the briefing is to ensure that all interviewers are familiar with the questionnaire script and routing, understand when to read out pre-codes, and prompt or probe responses as required.
Ideally, all field managers, supervisors and interviewers should be briefed directly by a member of the agency executive team. This is common practice for commercial telephone surveys where interviewers usually work together in one central location, but is less common for face-to-face surveys where interviewers may be geographically dispersed. However, personal briefing from a member of the agency executive team helps to ensure that interviewers understand and follow all the correct survey procedures[footnote 9]. We recognise that a telephone briefing of interviewers may be more practical and cost-effective than asking interviewers to travel to a central location.
Normally, the briefing sessions will cover:
- a short background to the inquiry, highlighting the survey’s importance and emphasising that the data will be subject to intense scrutiny, so the requirement is for the highest possible standards of fieldwork
- the population of interest for the survey and the screening questions
- where the sample has been sourced from, and how to answer questions from respondents about how their personal details have been obtained (if applicable)
- the importance of screening properly, so that only eligible individuals are interviewed
- the importance of a high response rate
- the importance of, and rationale for, complete adherence to the questionnaire script
- whether each survey question allows one response (single code) or multiple responses (multi-code)
- at each question, whether potential response options should be read out (prompted) or whether responses should be captured spontaneously and probed to pre-codes
- the use of any prompt material (for example maps, showcards, product descriptions)
- routing/filtering protocols
- the importance, where applicable, of interviewing at the correct times and in the right places
A separate written briefing note should also be given to interviewers working on the project. This should include all the instructions from the briefing session as well as a copy of the questionnaire with all routing instructions shown.
Research that is going to provide evidence for a merger inquiry requires particular attention to detail that often goes over-and-above the standards for commercial research, and this should be emphasised in both the verbal and written briefings.
A full and comprehensive briefing will mitigate the risk of poor quality fieldwork. However, it will not eliminate the risk entirely, and it is important that interviewing is monitored rigorously, with the agency executive team taking a keen interest in how the interviewing works in practice.
Good practice is for the agency project executive who conducted the briefing to listen to (telephone)/attend and observe (face-to-face) a selection of the interviews initially conducted post-briefing. Regardless of how well the questionnaire has been piloted (see cognitive testing / piloting), a number of details may need to be ironed out after the survey ‘goes live’. Instructions and a survey questionnaire can be implemented in unexpected ways when entrusted to interviewers; and the reactions, interpretations and answers of respondents can differ from expectation.
Once mainstage fieldwork is fully underway, it is also good practice for the agency project executives to continue to monitor a proportion of interviews. Monitoring of interviewer performance in the field for face-to-face surveys is time-consuming (as it requires agency project executives and field managers/supervisors to travel with interviewers) but the CMA’s experience is that it plays an important role in ensuring high standards of interviewing are maintained.
As a result of monitoring, questionnaire amendments, revised interviewer instructions and refresher briefings may be required (especially for any interviewers who fail to reach and maintain the required standards). Any adjustments needed should be documented and agreed with the client. If there is a systematic problem with the way that some interviewers have conducted interviews, these individuals should be replaced in the fieldwork team and new interviews conducted to replace any erroneous ones.
Telephone interviews are normally audio recorded as part of standard quality control procedures (although permission is required from the respondent to do so). These should be made available for scrutiny by the agency project executive and, if necessary, the client during the fieldwork period. Audio recording is less common for face-to-face surveys, but might be requested (by the agency executive team and/or the client) if felt necessary and the technology is available (subject to the same respondent permissions as for telephone).
The CMA generally likes to be given an opportunity to attend interviewer briefings and observe or listen to some fieldwork. Where possible our preference is to choose interviewing points and which interviewers to monitor for ourselves rather than the agency selecting them for us. All of this is subject to respondents being made aware that their interview is being recorded, or giving consent if the interview is being conducted face-to-face. This needs some prior planning and we encourage early communication with the CMA to facilitate it.
Where Parties are able to demonstrate that a survey has been conducted to a high standard, and show an understanding of how the survey has worked in practice in the field, this will assist the CMA in assessing the evidential weight of the data generated.
Cognitive testing/Piloting
Where time allows, the soundness of any research design and questionnaire should be tested before the ‘live’ survey begins by conducting, monitoring and evaluating cognitive interviews and/or a survey pilot.
Undertaking a small number of cognitive interviews is often an effective way of identifying potential problems with a questionnaire. Usually, cognitive testing involves retrospective interviewing, where the researcher (usually one of the agency executive team responsible for the survey) – after conducting a full interview with an eligible respondent – then works back through the questionnaire asking them about their comprehension and interpretation of questions and discussing possible improvements[footnote 10]. Given the time involved in doing this, respondents are often offered a small incentive to participate.
Pilots are mini-versions of the full survey process, including and therefore testing the interviewer briefing, respondent contact/screening process and the questionnaire with customers drawn from the population of interest.
Members of the agency executive team responsible for the survey should be closely involved in the piloting process. This means conducting at least some of the pilot interviews themselves, or listening in and taking notes directly.
The extent of the pilot will depend upon the complexity of the survey design and the sensitivity or difficulty of the subject matter. Good practice involves the formal recruitment, interview and debrief of a number of pilot respondents, followed by a full design review.
Where there are particular sub-populations of interest, the pilot should cover each in turn, ideally. As a general rule, the CMA recommends conducting at least ten pilot interviews, with a minimum of 2 from each sub-population of interest. However, where time or sample is limited, the scale of the pilot may have to be cut back.
Parties should note that it is risky to put a survey into the field without proper piloting, and it is better to allow time in the project schedule to incorporate a full pilot rather than rushing the survey set-up and finding problems with survey quality at a later stage. However, the CMA recognises that time constraints sometimes make a more limited pilot necessary. In these circumstances the risks can be partly mitigated by testing a paper version of the questionnaire ‘in-house’ by interviewing colleagues, friends or family. The survey can also be ‘soft launched’, ie only a few interviews conducted on the first day or 2 of fieldwork with careful monitoring of how it is working, so that any mistakes can quickly be identified and rectified. If changes are made, it may be necessary to replace some or all of the interviews conducted beforehand.
Questionnaire
Introduction
While there is a well-developed body of good practice in questionnaire design for social research, experience has shown that merger inquiry research requires particular attention to specific (and sometimes small) details to help obtain reliable and valid customer survey evidence. Any bias in response caused by imprecise or leading question wording, or ordering of the questions, can weaken the evidential value of a survey.
Structure
We start by describing an appropriate structure for a merger inquiry questionnaire. Responses to questions in each of these areas will provide key data for the exploration of competition in the market and the potential impact of a merger on customers’ choices.
It is good practice to ask easily answered questions on matter-of-fact topics at the start of a survey to ‘warm up’ respondents, followed by matters of behaviour, then preferences and reasons for choice, and then responses to hypothetical questions. The best questionnaires flow naturally for the respondent, enabling them to give a narrative of their behaviour in the market of interest. Typically, a merger inquiry questionnaire might be structured to include the following sections:
- an introduction inviting potential respondents to take part in the survey
- screening questions (ie questions that establish the respondent’s eligibility to take part in the survey[footnote 11])
- general purchasing behaviour, for example nature of purchase(s), suppliers, frequency of purchases, channels used
- influences on purchasing behaviour/choice attributes
- geography of most recent purchase, for example distance travelled/time taken to get to purchase point, departure point, travel modes used, whether main reason for visit/journey
- aspects of most recent purchase, for example (as appropriate) what was purchased, when, who with, how much was spent, how many items
- response to hypothetical change in a Party’s offering
- respondent demographics (if not covered during the screening of respondents)
It is important to carefully consider the order of individual questions within particular questionnaire sections as well, to avoid influencing answers to later questions by earlier ones within the section.
Questions should be introduced in such a way that clearly states the context in which they are to be answered and reminds customers of this, as necessary. Linking phrases such as ‘Still thinking about the recent purchase you made …’ will be useful in this regard. This, and a structure such as the one above, should be used to help the respondent return to the mindset of their most recent purchase before answering the diversion questions.
Care should be taken not to burden the respondent with a survey that is too long. The quality of responses will deteriorate if the questionnaire is too detailed and time-consuming to answer. Adherence to the structure above will help in designing a questionnaire that is succinct and relevant both to the customer and to the merger analysis. Ideally, the questionnaire should take no more than 10 to 15 minutes of a customer’s time to answer, although in some circumstances (for example store exit interviews) a shorter questionnaire may be necessary.
Language
When designing a questionnaire it is important to use appropriate language that avoids ambiguity or confusion. Wording should be in plain English, to reflect a wide range of language comprehension skills (reading, speaking and/or listening).
In surveys of the general population, technical terms should be used only where these are widely used and understood or – if not widely used/understood but their use is unavoidable – carefully explained so that they are understood in the same way by all respondents. However, if there is any risk that they may be interpreted differently by respondents even with an explanation, they should not be used at all. In surveys of business audiences, the use of technical terms may be more appropriate, but care should still be taken to keep the wording as straightforward as possible.
There needs to be consistency in interpretation of the survey questions by respondents to ensure that the views they express are based on a common understanding of the questions being asked. Any scope for ambiguity or confusion in the phrasing of a customer survey question is likely to reduce its evidential weight. However, there is sometimes a fine balance to be struck between having sufficient detail in a question to avoid ambiguity and it becoming too long and difficult to remember. Where such tension exists, it is often better to split a long question into 2 (or more) shorter questions.
In addition, the questionnaire must not influence customers to give particular answers: it must not lead them to express an opinion or fact that is not a proper representation of their views or behaviours. It is important, therefore, to provide a sufficient range of response options at all questions so that customer views are represented properly.
A question that is presented in a way that leads customers to one answer in preference to another (irrespective of their actual view or behaviour) constitutes bias, and is likely to be of limited evidential value as a result. Some potential sources of bias that should be considered when drafting customer survey questions include:
- Acquiescence bias, where the customer thinks they should agree with a statement included in the question and therefore does so. For example, ‘Have you been to the dentist in the last year?’ contains an acquiescence bias to the response ‘Yes’. A better, more neutral question would be: ‘When, if at all, did you last go to the dentist?’
- Restrictive bias, where the question leads the customer to think only of certain options. For example, asking ‘If you had known before you went there that this branch of X was closed for refurbishment for one year, what would you have done instead?’ – without an explicit encouragement in the question wording to respondents to consider all options, such as ‘Please imagine that you had known before you went there that this branch of X was closed for refurbishment for one year. Thinking of all the options open to you, what would you have done instead?’ – may cause respondents to discount shopping online as an alternative source of supply
- Hypothetical bias, where a customer may indicate a willingness to spend money or change behaviour which does not reflect their likely real response to the situation described[footnote 12].
- Inertia bias, where a customer over-states their likely reaction to a change in the market, for example by not taking into account switching costs, inconvenience, uncertainty of information, etc.
Question types
Selecting the correct question type(s) is an essential part of survey design, and the type(s) of question that can be used will be influenced by survey mode, typically whether this is:
- an interviewer-administered face-to-face interview, using paper and pen or computer-assisted personal interviewing (CAPI);
- an interviewer-administered telephone (CATI) interview;
- a scripted online questionnaire.
Pre-coded (closed) and open questions
Data collection and analysis is often facilitated by using questions where likely frequent answers are included in the questionnaire (closed questions) rather than leaving the customer or interviewer to write in the response (open questions). For interviewer-administered surveys, closed questions can be asked either as prompted (where the response codes are read out or shown to the customer) or as unprompted/spontaneous (where the interviewer codes the response from what the customer says, often probing to clarify what the customer means and how the response fits into the pre-codes on the questionnaire)[footnote 13].
However, care should be taken in the drafting of pre-coded responses. As an over-riding principle, the codes must cover what are likely to be the most frequent survey responses. Then:
- If potential responses are to be prompted (read out or shown to customers), the list should contain responses that can be easily understood and (if not shown) remembered by a typical customer (usually 6-8 possible answers at most).
- If (for an interviewer-administered survey) the pre-coded question is designed to collect responses in a spontaneous (unprompted) fashion, a longer list is feasible, but the response codes should be presented to the interviewer in a logical fashion, ideally with the most likely frequent response codes first on the list, alphabetically or in groups of related responses, and they should not extend over more than one page or screen.
Response codes should be drafted so that they are easily understood (by both respondent and interviewer), so good practice is to avoid any with too many words that make it difficult to interpret their meaning (and how they are differentiated from other codes).
When using pre-coded response questions in an interviewer-administered survey, it is important that there is a clear instruction on the questionnaire to say whether the list is to be read out (prompted) or not (spontaneous). If using a spontaneous approach, make clear in the instruction the extent to which interviewers should prompt for further answers or probe to clarify whether the response fits one pre-code or another. (It is also helpful to remind interviewers that they should not allow respondents to read the pre-codes over their shoulder on the page or screen). Standard practice with spontaneous pre-coded questions is to prompt the customer (for example ‘Why else?’, ‘What else?’, ‘Anything else?’) until he/she has nothing further to add, and to code the first mention separately from all other mentions. However, there may be occasions when the first ‘top of mind’ response is of most interest, in which case further prompting may be of less value.
Some surveys are designed with the inclusion of fully open-ended response questions, where there are no pre-codes and interviewers write in the answers given by the customer, or the customers themselves write in their answer. Fully unstructured responses can be highly informative, but this approach is not often used in merger inquiry surveys because open-ended questions can be time-consuming to ask and costly to analyse.
Scalar responses
Another often-used question technique in customer surveys is to capture responses via semantic or numeric scales. A semantic scale is labelled either at the end points or at every point on the scale (for example Strongly agree, Tend to agree, Neither agree nor disagree, Tend to disagree, Strongly disagree), while a numeric scale uses numbers as labels. The CMA’s preference is to use semantic rather than numeric scales, because the former is easier to interpret by both respondent and analyst.
There is no standardised semantic scale approach used in merger cases, although bipolar scales normally include a neutral mid-point and allow customers to give ‘Don’t know’ as an answer. However, in some cases it may be more appropriate to use an unbalanced scale without a neutral mid-point to unpick differentiation in customer attitudes where there is a natural tendency for customers to answer in a similar fashion. For example, importance scales are often used to identify the key factors that drive consumer choice in a market, by reading out a list of factors and asking customers to rate each of them in turn in terms of importance. Typically some customers will rate all factors as ‘important’ when presented with this task, and so it can be useful to have more granular distinctions at the ‘important’ end of the scale (such as ‘essential’, ‘very important’, ‘fairly important’) to help identify which are the most important factors. Alternatively, respondents could be asked to choose and rank, for example, the 3 attributes that are most important to them.
Questionnaire design for different modes
Different modes have particular strengths and weaknesses in terms of the way in which questions can be designed and presented to customers. These should be taken into account when deciding on the appropriate survey mode. For example:
- In CAPI, CATI and scripted online questionnaires (where the interviewing mode facilitates ‘automated’ or pre-scripted randomisation), it is good practice to vary the order in which item lists are read out to or displayed to customers when it is appropriate to do so (ie because possible answers are not in any way hierarchical), and to automatically reverse response scales for half the sample[footnote 14];
- CAPI, CATI and online self-completion modes also allow complex, conditional routing/filtering to be built into the questionnaire. Necessarily, the routing in paper and pen questionnaires must be simpler, but there remains a risk that customers will not answer questions they should, and answer questions that they should not. Clear interviewer instructions and a comprehensive briefing can help reduce this risk;
- In interviewer-administered isurveys, valid responses such as “Don’t know” and “Not applicable” can be captured as spontaneous answers (ie without being read out). However, in online surveys, such answers are effectively prompted for all customers and this may increase the frequency with which they are selected;
- In interviewer-administered face-to-face interviews, a showcard can be used to minimise the amount of information that customers must retain to be able to give an answer. However, in a telephone survey, customers may be required to absorb/remember a considerable amount of detail before making their response which is why it is important that item lists are limited in length;
- Face-to-face and online questionnaires can include stimulus content (for example logos, fascia images) in a way that a telephone survey cannot.
Content
Screening questions
In general, screening questions will be necessary at the start of a customer survey interview to ensure that only those within the population of interest are included in its scope. Occasionally, this will be all potential customers or businesses within the market[footnote 15], but is usually only the customers of one or both of the Parties.
Where customers are free-found using a random recruitment method (for example a face-to-face omnibus), the screening section may include a question(s) on previous purchasing behaviour to establish whether they are the customer of a merger Party. Importantly, such a question should not lead the customer to the identification of the other merger Party, as this may bias subsequent responses. Good practice is to ask for responses spontaneously or from a prompted list that includes all potential suppliers, as appropriate.
Screening questions are often used to ensure that the respondent was personally involved in the purchase decision. For example, a customer may have seen a film at a particular cinema but a friend or family member chose the cinema and booked the tickets. Timing of last purchase is also important. If the last purchase was a long time ago, then respondent recall may be a problem. Much depends on the product or service being purchased; recall is likely to be better regarding the purchase of laser eye surgery than about a visit to a convenience store. Piloting the survey can help to test recall and set a limit on how recently a relevant purchase needs to have been made to be eligible for the survey.
In many research surveys, screening questions are added to exclude customers who may have an informed/expert or vested interest in the subject because of their employment or personal connections, on the grounds that this may lead them to purposefully bias their responses in a particular way. The CMA’s general view is that all members of the population of interest should be included within the eligible sample and any such questions should be crafted to exclude as few people as possible. For example, it is not our usual practice to exclude people working in the market research industry or journalism from responding to merger surveys. In the surveys we commission, the CMA would normally include customers who have opted out of marketing communications or who have been flagged as recent participants in other market research.
Customer demography
Demographic questions may be asked after the screening questions (by way of easy introduction to the survey) or right at the end of the interview. The latter approach is usually preferable when the information requested may be sensitive, for example respondent income. Where the survey sample is taken from a customer list/database and already includes key demographic information about potential respondents, it is better (where possible) to take these ‘answers’ from the database and not waste interviewing time to recapture them, unless there is a reason to believe that verification is desirable and their importance merits it.
Typical demographic information collected is:
- sex (may be observed, not asked)
- (if not already covered during the screening) age (ideally the customer’s specific age, only asking them to indicate an age band if this is refused)
- working status
- highest educational qualification
We would not generally recommend asking a detailed social grade question in a merger inquiry survey: collecting sufficient information to enable an accurate classification takes time that is better spent on questions that are typically of more interest.
Previous purchase behaviour/consideration of other suppliers
Responses to hypothetical questions about what customers would do in the event of a change in a Party’s offering should always be assessed in the context of other evidence about the customer and a general understanding of consumer behaviour in the market as gained from the survey. Questions on previous purchase behaviour provide this contextual understanding. Similarly, collecting information about whether customers have considered other suppliers in the market in the past, and whether they have actively searched out information about other suppliers, may help to give a better understanding of consumer behaviour and whether customers are actively engaged in the market.
Typical questions:
- brands purchased in last day/week/month/year etc (depending upon typical purchase frequency)[footnote 16]
- frequency with which brands are purchased
- purchase channels used (bricks-and-mortar outlet, online, telephone etc)
- whether the customer has considered purchasing from another supplier(s) and/or been approached by another supplier(s)
- whether the customer has searched for information about another supplier(s) or about the supplier they purchased from, and if so where and for how long they searched for information
Choice attributes; purchase decision
Understanding why customers choose to buy from one supplier rather than another enables the identification of key drivers of consumer choice and helps us to draw inferences about how suppliers compete in the market. It also gives respondents an opportunity to think about the factors that are important to them, and makes it more likely that they will give a considered response to the subsequent diversion question(s).
Two different question approaches are commonly used to understand what drives customer choice:
- a choice attribute question that asks the customer to identify the most important reason(s) for choosing one product/service or supplier over another
- attribute importance questions (with a scalar response for each of several attributes) that asks how important each attribute is to the customer
A choice attribute question may be asked either as a spontaneous (unprompted) question or as a prompted question. The advantage of asking reason(s) for choice spontaneously is that it captures the ‘top of mind’ differentiators; the disadvantage is that one or 2 attributes may dominate (price, for example) and then there is less evidence about the importance of other factors. The question may be asked just to capture the single most important reason or alternatively all important reasons (although here it is advisable to capture the first mention separately to help identify the key reason for choice). An option to capture and code ‘other’ responses is usually included.
Attribute importance questions should be prompted on a one-by-one basis, using a scale which is semantically defined. Here, the CMA often uses an Essential/Very important/Fairly important/Not important/Don’t know scale because in our experience it generates results that discriminate effectively between attributes.
It is usually inadvisable to include both a prompted choice attribute question and attribute importance questions in the same survey, as this combination may introduce respondent fatigue. Instead, it will usually be better to ask reason(s) for choice spontaneously and then the prompted attribute importance questions (in that order so that spontaneous responses are captured first)[footnote 17].
The choice attribute question is usually the most informative in discerning parameters of competition from a customer perspective because it differentiates the Parties’ offerings. Consequently, it is often (although not always) the more relevant question in a merger case compared with attribute importance questions. (The latter quantify the importance of component parts of the Parties’ offerings but those revealed as most important are frequently common to both Parties[footnote 18]). For a fuller discussion of the interpretation of these types of question, illustrated with an example, see the hospital merger case study in Illustrations.
Discrete choice; conjoint analysis
There are other well-established question approaches that use modelling techniques to understand the importance to customers of various attributes in the purchase decision (for example Choice Based Conjoint (CBC) or other forms of discrete choice analysis). These tend not to be used extensively in merger inquiry research due to time constraints – there is often insufficient time to design and test conjoint survey instruments extensively before fieldwork, to administer the necessary questions during the interview, or to undertake the modelling prior to presentation of results[footnote 19].
‘Geography’ of local competition
The collection of details about where a product or service was purchased, how the customer travelled to the purchase point, how long it took, and where they travelled from (their departure point), can be useful information to help identify the geographic scope of the competitive constraints on the Parties’ products or services. Clearly this is not of relevance for purchases made online.
Typical questions are:
- where the customer travelled from to get to the purchase point (home, workplace, somewhere else)
- travel mode(s) used
- time taken to travel/distance travelled to purchase point
- whether the visit was the only/main reason for making the trip, or not the main reason
This information can be used sometimes to map customers in terms of proximity to a particular purchase outlet, and to define the catchment area for a particular outlet[footnote 20].
The phrasing of these questions needs to be considered carefully to ensure they are meaningful to all customers in different purchase circumstances. For example, if the purchase is made on impulse or planned as part of a more general shopping or commuting trip (rather than being the sole or main reason for the trip), the question may need to focus on the travel from the relevant local point to the outlet, rather than from the home or workplace[footnote 21].
Diversion
In many merger cases, the main objective of the survey is to assess the closeness of competition between the Parties and their competitors. A key element of this assessment is the inclusion of a suite of questions asking customers what they would have done under various hypothetical scenarios on a previous purchase occasion from one of the Parties. The most common of these scenarios is that a given product/service/supplier (or a given supplier’s outlet or website) was not available (forced diversion)[footnote 22], or a product/service was offered at a higher price (price diversion).
As indicated before, these questions should normally be asked in relation to the last purchase occasion, to put them in a specific and meaningful context. Thus, a price diversion question may take the form: “Thinking about [your most recent purchase from x], what would you have done if the price of this product/service had gone up by £1?”[footnote 23]
Conceptually, we are trying to measure the extent to which sales revenues lost through a deterioration in an aspect of one merger Party’s offerings would be internalised as a result of the merger, because some customers would choose to divert some or all of their expenditure to purchases from the other merger Party. In more technical language, we are using a hypothetical question to capture the stated next best alternatives/substitutes of ‘marginal’ customers: customers whose demand is elastic in regard to the dimension of the offering that is being varied under the hypothetical scenario presented in the diversion question. This is usually a small increment in price, but can be a change in some other aspect such as frequency of service in transport markets.
In most circumstances only a small proportion of customers will be marginal in the sense described above. Subsequently, the sample of marginal customers for which we have diversion responses is likely to be too small to provide estimates of sufficient precision for robust analysis. To overcome this, we ask the forced diversion question, removing a Party’s offering altogether, which results in all customers being asked what they would have done instead. When interpreting the findings, it is then necessary to make the assumption that the distribution of their responses is the same as for marginal customers. Note that this is equivalent to making the assumption that the diversion behaviour of marginal and non-marginal (“inframarginal”) customers is the same[footnote 24].
In cases where both price diversion and forced diversion questions are asked of all customers, the CMA has found that the order in which the questions are asked makes little difference to the results, ie it does not matter whether the forced diversion question is asked before or after the price diversion question. However, it is usually more natural to ask the price diversion question first, as this will help to identify marginal customers in response to a specified price increase. It is also a more logical question sequence for respondents, particularly those who are inframarginal customers.
When asking customers about their response to price increases, it is usually better to frame questions in terms of absolute amounts (for example in pence or £s) based on an actual price recently paid for a product or service, or typical price. Information may need to be collected in the survey about the actual price paid, and then a calculation made (this can be done automatically in a computer-assisted interviewing script) of the new amount after, say, a 5% price increase. We try to avoid presenting a price increase to consumers within the general population as a percentage (for example “What would you do in the event of a 5% increase in the price you paid?”), because they may find it difficult to work out what a percentage increase means in monetary terms. This is less of a concern for business respondents.
Questions about diversion options should be designed and tested to ensure they cover all possibilities. The exact wording will depend upon the range of options specific to a given merger situation, but as a general rule the initial question should ask about hypothetical behaviour at the highest level, for example would the customer (a) not ‘purchase’ or (b) ‘purchase’ or (c) don’t know[footnote 25]. Those who say ‘purchase’ should then be asked a follow-up question, ie what product/service/supplier[footnote 26] (or supplier’s outlet or website) would they substitute.
When framing the follow-up question, consideration should be given to allowing a spontaneous (unprompted) answer, avoiding the risk that a non-exhaustive showcard or read-out list of options introduces bias (although there is no hard-and-fast rule here and prompted lists are usually needed in online surveys). However, care is required with this approach: it necessitates no prompted mentions of particular products/services/suppliers (or supplier’s outlet or website) earlier in the survey, and interviewers must probe carefully to identify the correct product/service/supplier (or supplier’s outlet or website) in circumstances where they are recording responses against a pre-code rather than capturing verbatim what the respondent says.
The interviewer can be given lists and maps to help validate responses to unprompted questions. However, it is important to brief interviewers not to show these materials to the respondent when first asking the question. Experience suggests that many respondents struggle to read maps so while they might be a useful aid for the interviewer, interviews should not be dependent upon them.
Where it might be difficult to collect sufficiently accurate details of the substitute that respondents have in mind, it may be better to prompt the customer with a showcard or read-out list. This style of question is more appropriate when there is a limited number of alternatives in the market, or where precise outlet location details are required. If a short prompted list is used, the order in which alternatives are listed can be randomised. Otherwise, the list should be ordered in a systematic way such as alphabetically by brand/supplier fascia or name (and location, if applicable), or product/service name, to ensure no order effect biases are introduced (and if appropriate the alphabetic start point could be rotated between interviews).
In some merger cases, attempts have been made to investigate the effect of hypothetical non-price changes such as reductions in quality. This is a difficult (but not impossible) survey task. The challenge is to find a quality measure where a hypothetical deterioration has a precise meaning to all customers. Harder measures such as ‘waiting times for hospital appointments’ are better in this context than softer measures like ‘friendliness of staff’. As with price diversion, any question asking for a response to a hypothetical deterioration should be based on the actual product or service delivered on the last or most typical purchase occasion.
Diversion questions need to be worded in such a way that the customer puts themselves in the mindset of the original purchase decision. This purchase may have been planned or on impulse and it is sometimes appropriate to have different question wording to cover each of these situations.
(For example, in the Poundland/99p Stores phase 2 merger case, the CMA’s exit survey asked respondents early in the interview when they had decided to visit the store. Their answer determined which of the following 2 wordings of the diversion question they were subsequently asked, that is:
Where the visit was pre-planned: “Earlier, you told me you decided to visit [Party] today before you set out. If you had known before you set out today that [Party] was closed for several months for refurbishment …”
For those whose visit was on impulse: “If you had found today that [Party] was closed for several months for refurbishment…”)
There are some markets where one or both of the Parties have other products/services, outlets or websites, that customers may consider as alternatives. If a high proportion of own-party diversion (for example from one of the Party’s products/services or outlets or websites to another) is anticipated, then a staged approach to the diversion questions may be desirable. In the first instance, the customer can be asked what they would have done instead if a particular product/service was unavailable or outlet was shut or website taken down and, for those saying that they would purchase another of the same Party’s products/services or go to another of their outlets or websites, a follow-up question would ask the customer what they would do if none of that Party’s products/services or outlets was available[footnote 27].
In some markets, it may be necessary to consider scenarios where the nature of a purchase presents several diversion possibilities. For example, during an exit survey, a customer may report that they have just purchased 3 items from a merger Party’s store. When asked what they would have done if the store had been closed, they may say (1) they would not have bought any of the items or (2) they would have gone to one different store to buy all 3. Equally, though, they may say they would have bought one of the items in one different store and not bought the other 2, or bought one each of the items in 3 different stores, and so on. These are what we refer to as ‘split basket’ diversion options[footnote 28].
Theoretically, a customer survey should accommodate (where applicable) the potential for split basket diversion behaviour. In our experience, though, it is very difficult to do in practice, because keeping track of the various basket components creates confusion for the respondent. Generally, therefore, a more pragmatic approach is needed, and CMA surveys instead tend to direct respondents to state the alternative that covers all or the greater part of the items in their basket, recording this as their answer.
Where this simplified approach is taken, it needs to be considered carefully when interpreting the survey results. The avoidance of split basket options may steer respondents into limiting alternatives to those suppliers that offer all the items they have just purchased[footnote 29]. This may be a smaller set of suppliers than is available for individual items in the basket.
Cross-channel substitution
The investigation of customer searching and purchasing via the internet may be helpful in establishing the competitive constraint from online suppliers. Typical questions used to help assess this are:
- whether the customer has looked online for information about product(s)/service(s) and/or suppliers
- use of digital comparison tools (DCTs) (for example a price comparison website) to investigate prices across different products/services and/or suppliers
- whether the customer has purchased product(s)/service(s) online previously
- potential diversion to an online source
Care needs to be taken in placing these questions in the right part of the questionnaire. Context is key and in some circumstances they should be near the start of the survey, to ensure bias is not introduced and customers lead to a particular answer by questions about internet usage or online purchasing immediately before the diversion section.
In exit surveys, customers may be influenced by the physical context of being interviewed in or outside a store to think only of other bricks-and-mortar suppliers as an alternative. To this extent, it may be appropriate to position questions in a way that encourages respondents to consider all options, with potential answers not restricted to bricks-and-mortar substitutes. For example, it may be appropriate to ask about online alternatives in an earlier section of the interview. Parties and their external advisors should ensure that there is a fair balance to the survey and that question order does not lead customers to consider one channel over another in their diversion responses.
Where there is a realistic option for customers to divert purchases to an online supplier, the main (first) diversion question might include both ‘purchase from an online supplier’ and ‘purchase from an offline supplier’ pre-codes. This should ensure that both online and offline channels are presented as possible options when customers are considering what they would do (particularly as the pre-codes to the first diversion question are usually read out to respondents). It should also ensure that responses to the second diversion question (what product/service/supplier or supplier outlet or website would they substitute) can be identified as either the online or offline/bricks-and-mortar channel of the alternative supplier mentioned (if the supplier operates through both).
Analysis, Interpretation and Dissemination
Survey dataset processing, cleaning/editing and presentation
As part of a merger inquiry, the CMA will request a copy of any respondent-level customer survey dataset(s) used by the Parties and/or their external advisors to support the arguments or contentions made in their submission (for example Parties’ estimates of diversion). Datasets should be supplied to the CMA with all data validation, cleaning and editing (including coding) completed, and all quality assurance procedures carried out in line with ISO 20252:2012 data management and processing standards. A note detailing any changes made to the dataset(s) during this process should also be supplied.
In supplying the customer survey dataset(s) to the CMA, Parties and/or their external advisors must observe the requirements of the Data Protection Act 1998 (soon to be replaced by the General Data Protection Regulation) in regard to the processing of personal data. Where they have not obtained permission to pass on information that would allow individual survey respondents to be identified, Parties and/or their external advisors must anonymise the dataset(s) before they are transmitted to the CMA, for example, by:
- removing personal identifiers such as respondents’ names, telephone numbers and email addresses
- aggregating or reducing the precision of other variables, for example, by replacing a full postcode with a partial postcode, or by replacing geospatial point co-ordinates with wider (but still meaningful), non-disclosive geographical areas
- removing (or reducing the precision of) indirect identifiers that, if linked, might disclose the identity of an individual (for example, age + employer + detailed job title)
However, Parties and/or their external advisors should be mindful of not excluding individual responses to demographic questions where they are essential to the testing of an important hypothesis or theory of harm.
Data should be supplied to the CMA in the following software formats: Excel (as a minimum and not just in .pdf form) plus Stata and/or SPSS (if possible). It is worth noting that in the conversion of data from one format to another (for example from survey software into data processing software, or between different types of statistical software), changes may occur to some data or internal metadata (for example missing value definitions, variable labelling, decimal numbers, formulae etc). The dataset(s) should be fully checked, and any changes caused by the conversion process corrected, before the dataset(s) are shared with the CMA.
Each record in the dataset should be labelled with a unique reference (or identifier) number (URN). Where the survey data might be matched to other data (for example, transactional information on a customer database), each respondent’s URN should be the same in both datasets.
Where the Parties’ research has been undertaken using an interviewer-administered survey methodology (ie face-to-face or by telephone), the CMA also expects each record in the dataset to include the date and time of the interview and the ID number of the interviewer who conducted the interview (unless the inclusion of these details could allow individual respondents to be identified).
As far as possible, data codes should always be consistent. For example, if (at Question 1) yes = 1 and no = 2, use these codes for all Yes/No questions. Ideally, too, data codes that might be applicable to any question (such as Other, Don’t know, Not applicable, Refused) should be standardised. For example, code 3 (at Question 1) and code 7 (at Question 2) should not both = Don’t know. Instead, say, let 95 = Other, 97 = Don’t know, 98 = Not applicable and 99 = Refused throughout the dataset.
With the customer survey dataset(s), Parties and/or their external advisors should supply documentation – or a data dictionary – that includes:
- a copy of the questionnaire(s), setting out the exact wording used for each question, any associated pre-codes and (where applicable) all interviewer instructions (read out/do not read out, etc), and clearly indicating all survey routing
- names, labels and descriptions for variables, and their source (for example whether taken from the original sample file, from questionnaire responses, or appended from another dataset)
- for derived variables, a description of how they have been constructed;
- categorical and numeric variable value labels
- codes of, and reasons for, missing values (and an explanation of any techniques applied to the dataset for dealing with missing values)
- an explanation of coding/classification schemes used
- information on any weighting variables applied
- a description of the algorithms or calculations used in the analysis of the data
- a summary of any selection, cleaning or other adjustments that have been applied to the original response data
Survey results should be weighted where appropriate. These weights should be included as part of the survey dataset and their method of calculation provided. Decisions about weighting need to be made on an individual survey basis, but the following is a list of some of the common circumstances in which weighting might be considered:
- when the sample design intentionally under- or oversamples a particular sub-population (design weights)
- when the achieved sample is not representative of the target population, for example as a result of non-response bias. Note that this requires good quality benchmark data about the population, such as information contained within customer lists, to use for the weighting
- where weighting converts the units of the achieved sample onto the correct conceptual analytical basis (for example spend or frequency weighting)
Estimates based on the customer survey dataset(s) should always show the unweighted base size (the number of individual responses) on which they have been calculated and, if weighted, the effective sample size. The survey response rate (and the assumptions underlying the response rate calculation) should also be reported, where possible.
Finally, information that allows the CMA to verify the professional credentials of the market research agency/agencies that have conducted the customer survey(s) on behalf of the Parties and/or their external advisors should be provided (ie the agency’s name and website address).
Diversion ratios
The diversion ratio is a measure of the proportion of sales lost as a result of a deterioration of one merger Party’s offering that is recaptured by the other merger Party. Note that it is also possible to calculate diversion ratios to third-party competitors, ie the proportion of lost sales that are captured by a particular third party.
The calculation of a diversion ratio from a survey is based on the responses to the suite of diversion questions (see 3.41ff). In principle, the diversion ratio (to the merger Party) is calculated from the following equation:
{M+[D*(M/(M+T))]}/(M+T+D+N)
Where:
M = Number that would divert to the merger Party
T = Number that would divert to a named third party
D = Number that would switch supplier, but DK which supplier
N = Number that would not purchase the product or service nor purchase an alternative instead.
The calculations for forced diversion questions follow the same principles as those for price diversion questions, but typically involve more sample as all customers are, in effect, ‘forced’ to state a diversion intention[footnote 30].
However, these calculations are rarely straightforward and a description of the main elements of the CMA’s usual approach to making them is explained in the following section. These are not hard-and-fast rules and there is often a need to make sensible decisions about the treatment of particular combinations of response that arise in a survey.
Analysis units
The first thing that needs to be considered for the calculation is the units of analysis. In most merger situations, the unit that we are conceptually most interested in is the value of sales in monetary terms. The diversion ratio therefore becomes the value of sales that are diverted to the merger Party over the total value of lost sales. However, it is often difficult to achieve this and care should be exercised in attempting to do so.
If a survey is run from a customer list, weights can be derived sometimes from total sales recorded by the Parties. This information is often held where the customers are businesses and sales revenues are recorded for each customer.
If no such information is available, then questions can be asked in the survey about spend per visit and frequency of visit to establish the total sales value of the customer. The visit spend can be captured by asking the respondent how much they have just spent (this can be verified with the receipt if the respondent is unsure). Care is required though, as diversion questions work best if asked about the most recent purchase occasion, and if this was atypical – particularly if more than usual was spent – this can create a very inflated estimate of total spend over a wider period. Also, the implicit assumption with this approach is that diversion would be the same for every purchase visit, and does not vary by the products(s) or service(s) purchased, the time of purchase or any other factors.
Weighting by spend can also be problematic in its impact on effective sample size. This may be a reflection of the true situation, in which only a small proportion of a large number of customers accounts for a high proportion of sales, or it may be a feature that is exaggerated by frequency weighting, as described in the previous paragraph.
In some circumstances it may be appropriate to show results that are weighted by spend as well as unweighted by spend. They are both potentially informative and have different interpretations.
If the survey is an exit survey, the sample of customers is effectively weighted already by frequency of visit in that it is customer visits that are being sampled; the more frequently a particular customer visits an outlet, the more likely they are to be interviewed for the survey. In these situations, frequency weighting is inappropriate[footnote 31].
Note that sales value, or price, is not always very well-defined. For example, in casinos and betting shops the ‘price’ is not the amount staked because some of this is returned as winnings, and in pharmacies the amount paid by the customer for the prescription does not reflect the income that the pharmacy receives. This problem has arisen in a number of CMA cases in recent years, including casinos, betting shops, pharmacies and hospitals, and also in transport, cinemas, and magazines cases where season tickets, membership schemes and subscription packages respectively complicate the concept of price. In these circumstances it usually does not make sense to ask a price diversion question and it may not be possible or appropriate to weight by ‘spend’.
Treatment of ‘don’t know’ responses
‘Don’t know’ responses need to be considered very carefully. A response of don’t know to the main (first) diversion question usually means that the respondent is not asked any further questions relating to that hypothetical scenario[footnote 32] and the response is not informative for the purpose of the diversion ratio calculation. Therefore, it can be ignored for this purpose and should not be included in the denominator of the calculation.
However, if the customer answers that they would divert to another supplier but in a subsequent question says they do not know which supplier, then this answer is partially informative because they have stated that they would have diverted their expenditure rather than staying with the merger Party or exiting the market. In these circumstances, usual practice is to allocate ‘don’t know’ responses in the same proportions as those who have explicitly named the retailer to which they would divert.
Diversion ratio – with or without own-party diversion
There may be cases where the customer could divert to another of the Party’s outlets (for example in a cinema case where the customer says they would go to another cinema in the same Party’s chain). In these cases it is possible to calculate 2 variants of the diversion ratio: (i) diversion ratio not allowing own-party diversion (as per the equation at paragraph 4.13); and (ii) diversion ratio allowing own-party diversion which is calculated from the following equation:
{M+[D*(M/(O+M+T))]}/(O+M+T+D+N)
Where:
O = Number that would divert to another product/service/outlet of the same party
M = Number that would divert to the merger Party
T = Number that would divert to a named third party
D = Number that would switch supplier, but DK which supplier
N = Number that would not purchase the product or service nor purchase an alternative instead.
The interpretation and appropriateness of the 2 conceptual bases for diversion ratios is a complicated topic discussed at length in section 5 of the CMA’s Retail mergers commentary (2017).
Note that in some cases we have included additional diversion questions asked of customers that would divert to another outlet of the same Party, to enable more information to be used in the calculation of diversion behaviour. For example, in a cinema case we asked those who said they would have diverted to another cinema in the same Party’s chain what they would have done if, at the time they decided to go to the film, they had known that tickets at all cinemas in that Party’s chain had gone up in price (or (in the forced diversion question) had closed).
Split basket
The inclusion of split basket options usually complicates the diversion calculation considerably. A full analysis of diversion employing split basket responses can be very time-consuming and complex. A good analysis of diversion should incorporate the following:
- Clarity about the units of analysis: this is even more important when there is a split basket as the basket may be split by value or by the number of items in the basket (usually with the simplifying assumption that all items are of similar value).
- A thorough understanding of the questionnaire and the way that it has been scripted: including the different routes through the diversion questions. Is there any validation within the questions to ensure that all items/values are accounted for in the diversion responses? What if these controls are not in place and the responses are partial (for example a customer has bought 5 items, but only stated diversion alternatives for 3 of them), or more diversion is indicated than the purchases they relate to (diversion alternatives are stated for 7)?
- Good documentation: it can be difficult to keep track of the variety of respondent routes through/combinations of response to the diversion questions, and of all the decisions that need to be made at the analysis stage in order to interpret these combinations in the context of a diversion ratio calculation. It is good practice to be as systematic as possible in structuring the analysis and to document it carefully.
Treatment of imprecise or missing data
The sections above illustrate some of the issues faced in the calculation of diversion ratios, and provide guidance on how to tackle them. However, there may be other circumstances, such as having imprecise or missing data, where there is a certain amount of discretion in the calculation of the diversion ratio. In these situations, the CMA tries to be fair in calculating what it considers to be a central best estimate. For example, if a customer states (in response to a diversion question) that they would divert to “x OR y”, we would assign weights of 0.5 to x and 0.5 to y. The important principle is to avoid the introduction of undue bias into the calculation resulting in, for example, a diversion ratio estimate which is the lowest variant of a range of possible estimates that could be derived from the survey dataset.
Sampling errors
One of the main advantages of random probability sampling methods is that they enable sampling error – a key element of uncertainty associated with survey results – to be calculated. A standard textbook can be used to look up the various different measures, but the literature can become very complex and does not strictly apply as the standard formulae assume complete response. In practice, the CMA tends to use the achieved sample (ie the number of respondents)[footnote 33] as the ‘sample’ (the ‘n’ in the textbooks) and apply some simplifying approximations to sampling error calculations.
This is particularly true in the case of diversion ratios which are often derived using complicated calculations. In the CMA, we usually base the sampling error calculation on a simplifying conceptualisation of the diversion ratio as the result of binary response – either the customer diverts or does not divert to the merger Party. So, for example, if the diversion ratio is calculated to be 26% and is based on the responses of 200 people, then we ignore the fact that some of the 26% will have been built up from split basket responses, partially informative responses, assumptions about the allocation of don’t know responses and so on.
This simplification enables us to calculate a simple 95% confidence interval using the formula for the normal approximation of the binomial distribution for large populations. So, denoting n as the sample size, and d as the diversion ratio, the 95% confidence interval is given by:
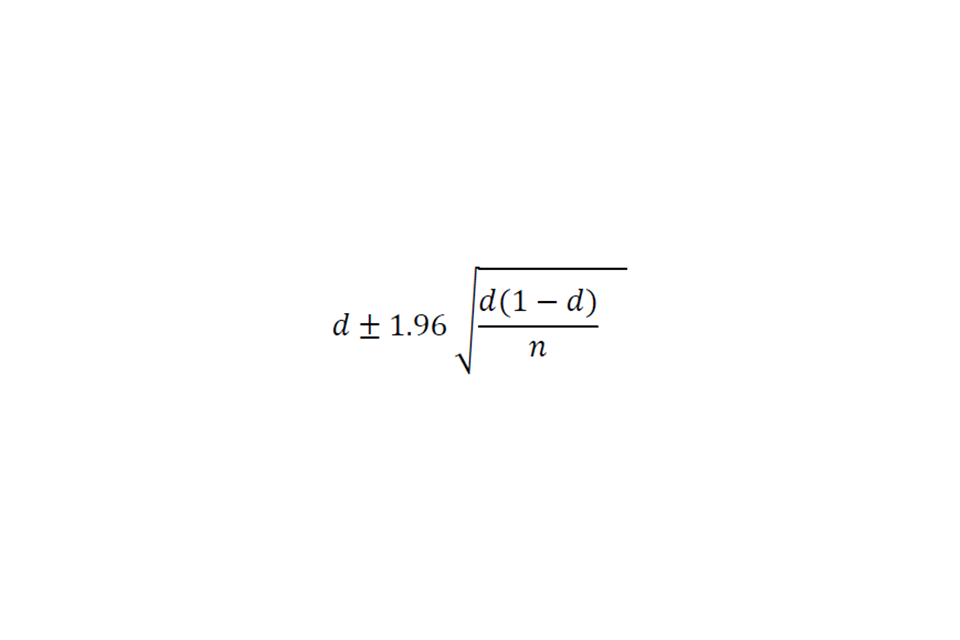
A further approximation and simple rule of thumb is that the 95% confidence interval is given by:
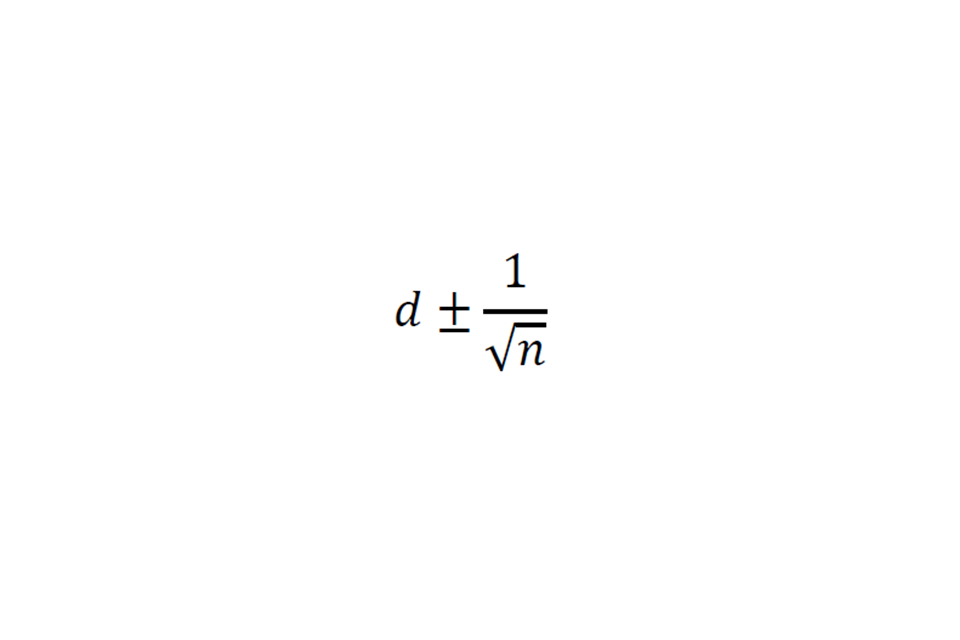
This results in slightly wider intervals but this is not problematic as there are potential sources of non-sampling error that have not been taken into account.
Where d is close to 0 or 1, and/or the (effective) sample size is less than 30, the simple approximation does not work as well and a Wilson interval should be used instead. The 95% confidence interval is given by:
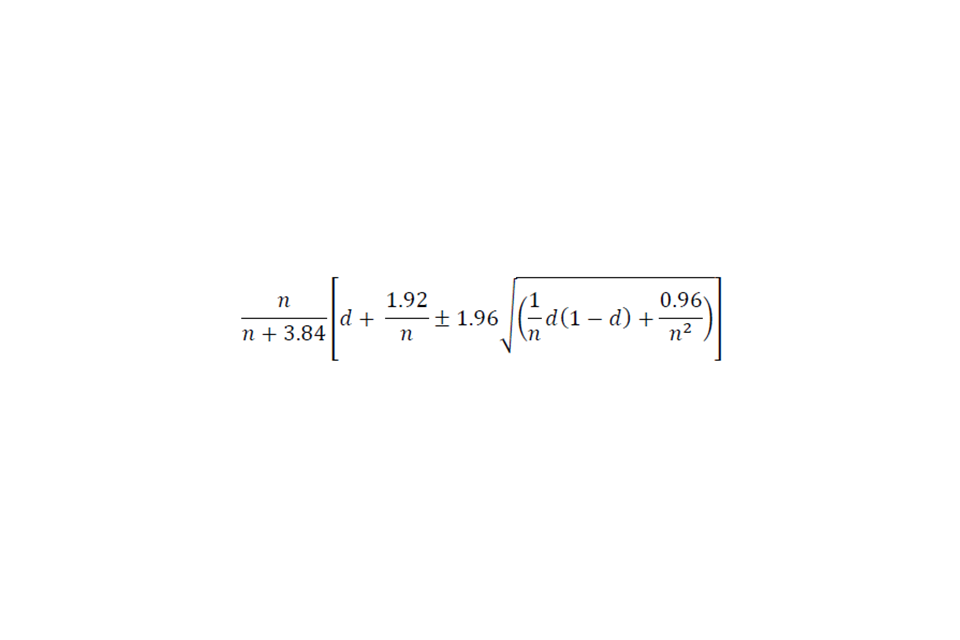
When weights have been applied to the data, this will reduce the effective sample size and widen confidence intervals. A simple and practical calculation that approximates [footnote 34] the effect of this is provided by the Kish adjustment, where the effective sample size is given by:
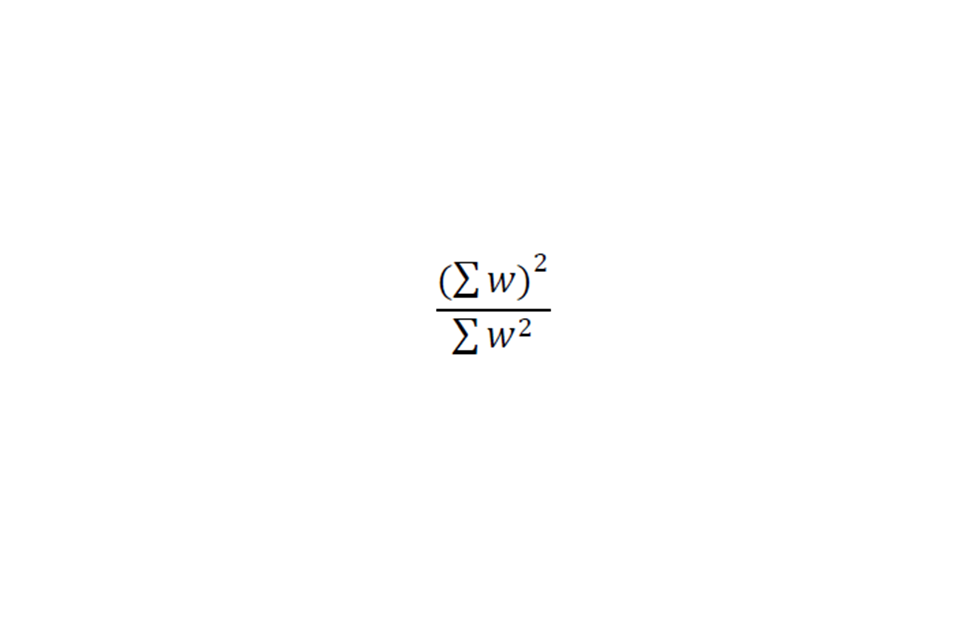
where w’s are the weights for each sample record.
The effective sample size should be substituted into the confidence interval calculation above instead of the “n”.
Further analysis and presentation
The CMA often calculates diversion ratios to the merger Party and to main third-party competitors. This should be done at an appropriate level of disaggregation (for example outlet, specialism, brand, local area) although care should be taken with sample sizes (see 2.31ff for a discussion of minimum sample sizes). A diversion table might look something like the following example from a recent CMA merger inquiry [VTech/Leapfrog]:
Table 6: Parties’ survey, TEL toys diversion ratios – not allowing own-party diversion
| LeapFrog consumers | % | VTech consumers | % |
|---|---|---|---|
| Not bought anything | 22 | Not bought anything | 24 |
| LeapFrog | N/A | VTech | N/A |
| VTech | 13 | LeapFrog | 8 |
| Fisher Price | 25 | Fisher Price | 23 |
| TOMY | 10 | TOMY | 4 |
| Chad Valley | 7 | Chad Valley | 3 |
| Early Learning Centre | 4 | Early Learning Centre | 21 |
| Chicco | 3 | Chicco | 1 |
| Disney | 2 | Hasbro | 3 |
| Baby Annabell | 2 | Golden Bear | 1 |
| Play Doh | 2 | Play Doh | 1 |
| Lego | 2 | Lego | 3 |
| Xbox | 2 | Little Tikes | 3 |
| Mothercare | 1 | LadyBird | 1 |
| Bruin | 1 | Fingerprint | 3 |
| Total | 100 | Total | 100 |
Source: CMA calculations using data from Parties’ consumer survey of TEL toys. Base: LeapFrog 144, VTech 203.
Sample sizes are sometimes sufficiently high to enable further detailed analysis of sub-populations and, in local markets, it is often informative to make use of the geography of markets, presenting diversion ratios in maps. One useful type is maps marking all the diversion alternatives in the area (for example cinemas) by Party and with diversion percentages marked beside them.
Generally, the CMA does not consider responses to price diversion questions to be fit for the purpose of estimating own price elasticities. In our view, this calculation requires a degree of accuracy that is particularly sensitive to the bias introduced by the hypothetical nature of the question. The price diversion question is an approximate way of distinguishing ‘more marginal’ from ‘less marginal’ customers. However, it is unlikely that survey respondents will be able to judge reliably the likelihood of diverting in response to the particular calibration of price increment given in the question.
Technical reporting
For any merger investigation survey, it is important to provide a written technical report that describes the key aspects of how the survey was undertaken. This will provide transparency of process to the CMA. Typically, the technical report should include a description, as applicable, of the:
- population of interest (and any exclusions), including sub-populations of interest and actual or estimated population and sub-population size
- sample source
- sampling approach used to generate a representative sample
- interview method (for example telephone, face-to-face, online) and use of any incentives/reminders
- piloting approach, and any notable adjustments made as a consequence
- survey notification/invitation letter and questionnaire (appended to the technical report)
- fieldwork briefing and monitoring approach
- survey fieldwork dates
- response rates
- data cleaning/editing approach (including coding)
- data weighting
Quality assessment and evidential weight
The CMA takes many aspects into account when assessing the evidential weight that can be given to survey results. It is difficult to be prescriptive about these aspects, but the following sets out what we typically consider:
- coverage – under- or over-coverage of the survey sampling frame with respect to the target population
- fieldwork method and quality
- representativeness of the achieved sample, scope for sample bias and non-response bias
- questionnaire – question wording, relevance of the questions, any biases that might arise from the ordering or framing of questions
- dataset – quality, consistency and cleaning
- inappropriate or missing weighting or analysis
- response rates – unless there is evidence that the achieved sample is representative of the target population, the CMA is generally cautious about giving full evidential weight to surveys that achieve a response rate below 5%
- precision – similarly, the CMA is cautious about giving full evidential weight to analysis of sub-populations for which the achieved (effective) sample size is less than 100
The nature of any perceived problems will affect our interpretation of survey results and the evidential weight that can be given to them. Under-coverage is usually the most benign problem in this respect. As long as the survey coverage is understood, and the survey sample is representative of the eligible population falling within that coverage, then survey results should be interpreted as only relating to that population.
Problems with the questionnaire may lead to less, or no, account being taken of the results of a particular question or questions. This may also be true of other problems that are limited to only part of the survey questionnaire.
Many problems that arise affect the quality of the whole survey and in these circumstances the CMA’s assessment generally concludes one of the following:
- the survey is of high quality and fit for making robust inferences about the population(s) from which the survey sample has been taken
- the survey is sufficiently problematic that population inferences cannot be considered to be robust and the weight given to the survey’s findings should be limited accordingly. In these circumstances, decision-makers might look for supporting evidence from other sources in the case before regarding the survey results as being reliable
- the survey is sufficiently flawed that it cannot be taken into account as evidence in the case
Judgements about the interpretation and weight given to survey evidence are complex ones. Ultimately, they are made by decision-makers taking into account many aspects of the case, market context, assessment of the quality of the survey itself and how its findings sit against or alongside other available evidence.
Illustrations
Discussion of survey method – cinema merger case study
To illustrate the choices that may be available for a merger case we can consider the example of a cinema merger, setting out and assessing a range of possible ways of surveying customers. In recent cinema cases, the CMA (and the CC and OFT previously) have focused on assessing the likelihood of a substantial lessening of competition in local areas where each of the Parties owns one or more cinemas. Evidence such as the location and number of merger Party and third-party competitor cinemas has been used to make an initial assessment of those areas of competition risk. In such cases, a survey of customers of the Parties’ cinemas in these risk areas has then been considered.
There are 3 principal methods of finding eligible cinema customers to survey: free-find; customer lists provided by the Parties; and intercepting customers at the cinema venues.
Free-find method
This would involve interviewing members of the adult general population and using the first (screening) questions in the survey to establish whether they had recently seen a film at one of the cinemas within scope and so are eligible to take part in the survey. It is likely that most adults approached would not be eligible and the survey would therefore need to be efficient at finding and eliminating the ineligible so that costs could be kept in check.
If we free-find people on the street, location and times of interview may have a big impact on the survey results, underlining the fact that this is not a controlled or scientific way of sampling and is unlikely to result in an achieved sample that is representative. A better alternative would be to employ interviewers to knock on doors for a sample of dwellings within a certain distance of the cinema. This could be supplemented by putting a paper self-completion questionnaire through the door if there is no answer (an example of a so-called mixed mode approach), although this may result in a biased sample due to a low response rate and respondent self-selection.
The standard free-find method for a telephone survey is to use random digit dialling (RDD). Historically, the performance of RDD surveys has been reasonably good, although the duel challenges of falling response rates and the declining use of landline telephones/increase in mobile-only households is making them less effective. Costs can be considerable and RDD surveys work best when the eligibility incidence rate among the general population is high, something that is unlikely to be the case in a cinema customer survey of this type.
The low incidence rate would also be a problem for free-finding eligible respondents via a face-to-face omnibus survey. Omnibus surveys have the advantage that respondents are recruited using methods rooted in random sampling. However, they generate large samples only at a national level and are not designed to be representative of/to allow robust analysis at a defined local level. Therefore, the CMA is most likely to consider an omnibus survey in cases where we are interested in results at a national level.
Customer lists
The Enterprise Act 2002 gives the CMA data gathering powers that enables it, subject to certain conditions being met, to require Parties to provide customer lists. It also has the legal powers to share this data with a market research agency for survey taking. Customer lists avoid the problem of coverage encountered in the free-find methods described above, and this is particularly true in markets where incidence rates are low. However, the feasibility of a client list approach is highly dependent on the range and quality of data held by the Parties about their customers.
We know from experience that this varies by cinema chain. In theory, surveys could be run using telephone numbers, email addresses or postal addresses, or a combination of them, from customer information held by the Parties. Coverage tends to be the issue; some cinema chains capture very little information about their customers, whereas others have extensive membership discount and marketing schemes that result in fairly comprehensive lists. However, even in these latter cases, there will be a proportion of customers (such as walk-in customers purchasing tickets at the box office) who will not be included.
An additional problem is that customer details might only be held for those customers who are on a ‘global’ membership list (such as Cineworld’s Unlimited Scheme which acts like a season ticket, providing free access to films at any Cineworld cinema for the duration of the membership). Such a ticket is not tied to a specific venue in a chain and so it would be necessary to first ascertain whether the customer had recently visited one of the cinemas of interest. Postcodes could be used to construct a subset of customers that might be within the catchment area of one of the cinemas of interest, to reduce screening costs. The postcode area should not be too narrowly defined.
In our experience, we have found that some cinema chains have email addresses for a reasonably high proportion of their customer base enabling an internet-based survey approach.
Intercepting customers at cinemas
A direct way of finding the customers of cinemas of interest is for interviewers to go to bricks-and-mortar venues around the times that films are showing. They could then: (i) conduct a face-to-face interview with cinema-goers as they enter or leave the cinema; or (ii) collect follow-up contact details (postal, telephone and/or email) from cinema-goers for an interview at a later date; or (iii) give cinema-goers a self-completion questionnaire that could be filled in and returned either to the interviewer on the day or later by post to the agency. A combination of these methods could also be employed (for example, a face-to-face interview is conducted if the respondent has time for it, but otherwise follow-up contact details are collected for a later interview).
This approach has the advantage of capturing a range of eligible customers, regardless of how they bought their tickets or whether their details are held on a customer list. However, the logistical difficulties of recruiting respondents as they enter or leave the cinema may be challenging, and it might be the case that responses are obtained from visits only for a limited number of screenings (for example, by film type/target audience, day of the week, time of day, etc).
Methods used in recent merger cases
Looking at approaches used in cinema merger cases, there are 3 recent examples. In the Cineworld/City Screen phase 2 merger case, the Parties held quite comprehensive information about their customers, particularly email addresses. The Competition Commission (CC) undertook an online survey using these lists which had a good response, enabling detailed analysis of the findings for individual cinemas. However, recognising possible under-coverage, the CC sought to test the assumption that responses of customers on the Parties’ lists were the same as those not on their lists (particularly with respect to diversion behaviour) by conducting an RDD telephone survey in 2 (Brighton and Bury St. Edmonds) of the 10 areas covered by the main survey. This helped validate the findings from the main online survey. The CMA has also run an online survey using customer lists provided by the Parties in (to date) 2 phase 1 cinema merger cases.
Importance of factors that influence customer choice of supplier – hospital merger case study
To understand which factors were important in patients electing to have a treatment at the surveyed hospital rather than another, the following 2 questions were asked: the first a spontaneous reasons for choice question, the second a prompted choice attribute question.
Question 1: Why did you decide to go to {Text insert eligible hospital} for the condition you were originally referred for, rather than go to another hospital? PROMPT: Why else? PROMPT UNTIL NO FURTHER RESPONSE
-
Close to your home
-
Easy to get to by public transport
-
Parking at the hospital
-
{GP/Dentist/Optometrist} recommendation
-
Expertise of consultants and other healthcare professionals
-
Treatment outcomes e.g. lower infection rates, higher recovery rates
-
Availability of specialist medical equipment at the hospital
-
Quality of nursing care
-
Waiting times for appointments
-
Good previous experience at this hospital
-
Bad previous experience at another hospital
-
Other (Write In)
-
Don’t know/can’t remember
Question 2: I am going to read out a list of features. For each one I’d like you to tell me how important it was when choosing a hospital for the condition you were originally referred for. Please use one of the phrases on the following scale to describe your answer.
READ OUT SCALE:
ESSENTIAL
VERY IMPORTANT
FAIRLY IMPORTANT
NOT IMPORTANT
DON’T KNOW (NOT ON SHOWCARD)
So, first of all (READ OUT FIRST STATEMENT). How important was that to you, was it …? INTERVIEWER: READ OUT EACH STATEMENT IN TURN. READ OUT SCALE FOR FIRST 3 ATTRIBUTES ONLY.
NOTE TO SCRIPTWRITER: ROTATE ORDER BETWEEN INTERVIEWS
- How close the hospital is to your home
- Ease of getting to the hospital by public transport
- Parking at the hospital
- {GP/Dentist/Optometrist} recommendation
- Expertise of consultants and other healthcare professionals
- Treatment outcomes e.g. lower infection rates, higher recovery rates
- Availability of specialist medical equipment at the hospital
- Quality of nursing care
- Waiting times for appointments
- Good experience at the hospital
- Bad experience at another hospital
There are a number of points to note in this example.
- First, the order of questions: the reasons for choice question which requires a spontaneous response was asked before the prompted choice attribute question. This ensured that we captured spontaneous reasons first
- Secondly, at question A1, patients were prompted to continue mentioning reasons until they could think of no other. With prompting in this way we hoped to tease out all the factors that were important. Although it was not done in this survey, it might have been advisable to capture the first mention separately from all other mentions so that the most ‘top of mind’ response could be identified. There was also an ‘Other (write in)’ code that could be used by interviewers to capture any factors not already pre-coded on the questionnaire
- The question wording used in A1 asked for reasons for going to the surveyed hospital (for the elected treatment) rather than to another hospital. This wording attempted to focus patients’ attention on their reasons for choosing between different suppliers, and so to help identify the factors that differentiated the suppliers’ offering
- Turning now to question A2, an unbalanced importance scale was used, as we wanted to identify those factors that were most important in the choice of hospital. At the analysis stage, we concentrated on the percentage of respondents saying each feature was either essential or very important. The whole scale was read out to respondents for the first 3 attributes, to ensure that patients gave one of the responses on the scale (and if necessary read out again for the other attributes if the interviewer felt this was necessary). The order in which the attributes were read out was automatically randomised between interviews in the CATI script
The survey results demonstrated how the combination of questions helped identify what was important for the patient. When asked reasons for choice spontaneously, patients at one of the Party locations (St. Peters) most often said proximity to home, while for patients at the other Party location (Royal Surrey County) previous good experience at the hospital was as important as proximity to home. No other factors were considered important to any marked extent.
However, when patients were asked the prompted choice attribute question, the priority order changed. Top in importance was the expertise of the consultants and other healthcare professionals (for both hospitals) followed by the quality of nursing care, good previous experience at the hospital, the availability of specialist medical equipment, and treatment outcomes.
These findings on first inspection appeared contradictory, but can be explained. While many of the (prompted) attributes were considered to be important in choosing a hospital, they were not necessarily the things that differentiated hospitals in the local area. For example, a high proportion of respondents stated that consultant/healthcare professional expertise was essential, but presumably assumed that this expertise was available in all their local hospitals (ie was a hygiene factor).
Diversion questions – examples
Example 1: price diversion questions (Cineworld/City Screen phase 2 merger case)
These questions were asked of Cineworld customers. Note that this version of the questionnaire was the one used by the programmers (scriptwriters) in the market research agency who set up the online version of the questionnaire.
D2: Suppose you had known beforehand that tickets at all Cineworld cinemas had gone up by … (NOTE TO SCRIPTWRITER: INSERT AMOUNT FROM BELOW), and the price at all other cinemas had stayed the same. Would you have … ? PLEASE TICK ONE ANSWER
NOTE TO SCRIPTWRITER: RANDOMISE PRECODE ORDER BETWEEN INTERVIEWS (BUT ALWAYS END WITH DK/NOT SURE)
- Chosen not to go to the cinema at all
- Gone to another cinema to see this or another film
- Still have seen the film at the same cinema
- Don’t know/not sure
NOTE TO SCRIPTWRITER: INSERT PRICES AS FOLLOWS
London, Full-price ticket = 75p
London, Discounted ticket = 50p
Outside London, Full-price ticket = 50p
Outside London, Discounted ticket = 30p
NOTE TO SCRIPTWRITER: ASK D3 IF WOULD HAVE CHOSEN TO GO TO ANOTHER CINEMA (CODE 2 AT D2)
D3: Which other cinema would you have gone to instead? PLEASE TICK ONE ANSWER
NOTE TO SCRIPTWRITER: RANDOMISE ORDER (EXCEPT “OTHER” AND “DK” AT END).
- SCRIPTWRITER TO INSERT LIST PROVIDED OF LOCAL CINEMAS
- Other cinema
- Don’t know/not sure
NOTE TO SCRIPTWRITER: PRECODE LIST INCLUDES ANY OTHER CINEMA FROM SAME FASCIA IN THE LOCAL AREA, IF RELEVANT
There is much to note in this example, which shows the start of a suite of diversion questions included in an online survey of cinema customers contacted via email addresses provided by the Parties.
- First, it should be mentioned that the preceding section had asked questions about customers’ last visit to the Cineworld cinema of interest including how they travelled to the cinema, whether they came alone/with others and which film they saw. Responses to these questions were of interest in their own right, but they also helped respondents to get into the mind-set of when they last visited the cinema. This clearly established the visit that was the basis of the hypothetical question asked at question D2.
- Question D2 is a good example of a price diversion question. The amount of the price rise was determined by the type of ticket the customer said they had purchased and did not require the respondent to make any calculations themselves (which would have been the case if the question had suggested, for example, a 5% price rise). The order of the list of responses seen by the customer was randomised for each respondent to avoid any ordering biases that might arise. The wording of the responses is clear and they are mutually exclusive responses, covering all possibilities.
- Note also the inclusion of a ‘don’t know’ option for the customer at question D2. This is always important in diversion questions and in this case it might be argued that many customers were unlikely to be certain, when responding, about which films were showing at which cinemas and when the showings began (unless they had a clear memory of any research they may have done before deciding on the original visit). The provision of the ‘don’t know’ option prevents the forcing of customers into responses that might undermine some of the validity of the diversion analysis.
- Question D2 was designed to deter customers from saying they would divert to another Cineworld cinema by saying that prices had gone up at all cinemas in the chain. This approach was adopted (in this case) because a number of the surveyed cinemas had another cinema in the same chain close by. The disadvantage of the wording above is that it was not informative about the extent of diversion between Cineworld cinemas. An alternative, valid wording of question D2 (using the example of customers of the Queens Link Cineworld in Aberdeen) would have been “Suppose you had known before that tickets at the Aberdeen Queens Link Cineworld had…”. This approach has the opposite disadvantage in that many respondents to this question would have been likely to divert to the other Cineworld cinema in Aberdeen, which would not have been informative for calculating the version of a diversion ratio that excludes this as an option (ie excludes own-party diversion).
- Question D3 presented those respondents who at D2 said they would divert to another cinema with a list of the 12 closest other cinemas in the area (including those of the same fascia, where present). Twelve was considered to be the longest list practicable for an online survey and the CC decided to make the choice of cinemas included in the list as objective as possible by making it rule-based. This worked well in all locations except perhaps in London, where West End cinemas were not captured well by this approach.
Subsequent questions in this survey asked the forced diversion question.
Example 2: forced diversion questions (Ladbrokes/Coral phase 2 merger case)
Q9. Imagine that this Ladbrokes betting shop was closed for refurbishment for 6 months. Thinking of all the options open to you, what would you have done instead of visiting this betting shop today?
-
gone to another betting shop
-
placed bets or gambled online
-
gone to another gaming venue (e.g. bingo hall, casino, arcade)
-
saved money or spent it on something else
-
don’t know
If ‘gone to another betting shop’ at Q9:
Q10. Which other betting shop would you have gone to?
If gone to another Ladbrokes at Q10:
Q11. Now imagine that all Ladbrokes betting shops were closed for refurbishment for 6 months. What would you have done instead of visiting this betting shop today?
-
gone to another betting shop
-
placed bets or gambled online
-
gone to another gaming venue (e.g. bingo hall, casino, arcade)
-
saved money or spent it on something else
-
don’t know
If gone to another betting shop at Q11:
Q12. Which other betting shop would you have gone to?
This set of questions formed part of the questionnaire of a survey conducted by face-to-face interviewers in some Ladbrokes and Coral betting shops (the version above is the one that was used in Ladbrokes betting shops). Q9 takes care to say that the betting shop is closed for 6 months[footnote 35] rather than just closed. This avoids respondents saying that they would ‘come back later’ (so-called ‘temporal substitution’) or something similar, which would not be informative for our purposes.
Many of the Coral and Ladbrokes betting shops sampled had another betting shop of the same group in the local area giving rise to a lot of ‘own-party diversion’ (for example diversion from one Ladbrokes betting shop to another Ladbrokes betting shop). The sequence of questions in the example above shows how these respondents were subsequently asked a further question in which they would have to choose a different alternative (Q11). The advantage of this approach is that it enables a full sample of responses for calculating diversion ratios in 2 forms: one that allows for own-party diversion and another that does not. These measures are both potentially helpful in interpreting competition.
Example 3: example of a poor diversion question
Q: What would you be most likely to do if you wanted to place a bet or play a poker or casino game (for example, roulette, blackjack, slots, etc.) and before leaving home you were told your usual LBO was temporarily closed for refurbishment?
An analysis of responses to this question was used in evidence submitted to the CMA as part of a merger case. The question was included in both a telephone and an online survey. It does not follow the usual structure of a diversion question in which a particular visit to one of the Parties’ stores/outlets (in this case local betting offices – LBOs) is the premise of the question and the respondent is asked what they would do instead, if this option were not available. We do not know how many of the respondents to the Parties’ telephone and online surveys would have visited one of the Parties’ or any of the other fascia’s LBOs to gamble in the first place, as this had not been established in this or previous survey questions.
The preceding questions provided no context to enable the respondent to be thinking about a visit to a LBO. In fact, the questions immediately before asked if retail gamblers expect to spend more or less on retail gambling and, if less, a prompted list of possible reasons why this is the case including many options, almost all of which mentioned ‘online’. This may have made the respondents think of online alternatives more than they would have done otherwise, possibly influencing their answers to the diversion question.
Diversion ratio calculation – hypothetical example
As discussed above, the calculation of a diversion ratio using responses to a suite of diversion questions can be quite complex. Here we show the calculation from a hypothetical example of a cinema merger between Party A and Party B, with the results of an exit survey of cinema goers at Cinema A owned by Party A.
Q1: Suppose you had known beforehand that tickets at this cinema had gone up by £1. Would you have … ?
Responses from a sample of 956 customers:
-
10 - Not gone to the cinema or done anything else instead
-
736 - Gone to the same cinema
-
120 - Gone to another cinema instead
-
50 - Done something else instead
-
40 - Don’t know
Q2: Which cinema would you have gone to instead?
Responses from the subset of 120 customers who said that they would have ‘gone to another cinema instead’
-
18 - Cinema B (the merger Party’s cinema)
-
30 - Cinema C (owned by third party C)
-
48 - Cinema D (owned by third party D)
-
4 - Cinema E (owned by third party E)
-
20 - Don’t know
In this case the diversion ratio would be calculated as follows:
Diversion to the merger Party = 18+20*(18/(18+30+48+4)) = 21.6
Total lost sales = 10+120+50 = 180
Diversion ratio = 100*21.6/180 = 12%
This example involves simplifications, one of which is that it does not consider the situation where some diversion is to another cinema owned by cinema chain A. We can consider the effect of this by reviewing the calculations in the alternative scenario in which cinema C is owned by cinema chain A. We can now calculate 2 different versions of the diversion ratio:
Diversion ratio allowing own-party diversion (as before)
Diversion to the merger Party = 18+20*(18/(18+30+48+4)) = 21.6
Total lost sales = 10+120+50 = 180
Diversion ratio = 100*21.6/180 = 12%
Diversion ratio not allowing own-party diversion
Diversion to the merger Party = 18+20*(18/(18+30+48+4)) = 21.6 (as before)
Sales lost from cinema chain A = 10+120+50 – {30+20*30/(18+30+48+4)} = 144
Diversion ratio = 100*21.6/144 = 15%
-
https://www.gov.uk/government/publications/mergers-consumer-survey-evidence-design-and-presentation CC2com1/OFT1230, March 2011 ↩
-
As with all other survey findings, this depends on how robust the results are judged to be, and is only part of the evidence considered. ↩
-
There can be some overlap between these questions and those used to address cross-channel substitution. ↩
-
Many of the surveys considered as evidence in merger cases, including surveys commissioned by the CMA, suffer from low response rates and the consequent risk of a non-response bias which is difficult to quantify. This can affect the evidential weight that decision-makers place on the results of a survey. The effect of non-response bias can sometimes be partially mitigated by including a question in the survey from which the the results of the survey can be benchmarked from another source. For example, if date of birth is held in the Parties’ customer lists and age is asked in a customer survey, then the age distribution can be compared between the survey respondents and the customer lists and weights applied to adjust for any differences. ↩
-
Quotas for sub-populations may be set; the important principle is that the selection of customers within each sub-population is random. ↩
-
See section 3 of the Retail mergers commentary (CMA, 2017) for more details on filtering. ↩
-
In some circumstances it may even be possible to use the survey dataset, or estimates derived from it, as inputs to an econometric model ‘predicting’ diversion ratios for non-surveyed outlets. ↩
-
See the ‘Discussion of survey method - cinema merger case’ for a description of a research design incorporating this form of validation. ↩
-
This is not the normal practice of many market research agencies. However, in the CMA’s experience, problems often arise when briefing is delegated to/cascaded by field managers/supervisors, particularly for face-to-face surveys. ↩
-
For example, “Would this question have been clearer to you if I had asked … ?” ↩
-
For many surveys, it is important for the first question to determine the respondent’s age. Parental permission is required to interview anyone under the age of 16, and those under the age of 16 should either be treated as ineligible to participate in the survey, or should not be asked anything further until parental permission is secured. ↩
-
Hypothetical diversion questions are inevitably subject to this bias; this should always be carefully considered when interpreting findings based on them. ↩
-
Note that the interpretation of responses may be different depending on whether the question is asked as prompted or unprompted. An example of this is provided in Illustrations. ↩
-
Other, Don’t know and Not applicable response options should not be randomised or reversed, always appearing at the end of item lists. ↩
-
For example, in markets where branding is not very important. In a recent merger case involving 2 suppliers of pay-to-use (PTU) automatic teller machines (ATMs), the survey design involved free-finding recent customers of any PTU ATM, because we knew from the outset that it would be difficult to establish whether they had used one of the merger Parties’ machines specifically. ↩
-
In some merger contexts, for example those involving the provision of an ongoing service, it might be more appropriate to ask about switching suppliers (including reasons why the respondent has, or has not, done so). ↩
-
We note that in paper or online self-completion surveys, prompted versions of both types of question are likely to be unavoidable. ↩
-
For example, it is essential that supermarkets provide lighting, trolleys and accept payments by cash or card, but these are ‘hygiene factors’ that customers will take for granted as being offered by all supermarkets and so are not differentiating factors in the way that prices or location might be. ↩
-
The Authority for Competition and Markets in the Netherlands has conducted a number of surveys in merger cases in recent years that have used conjoint methods. See ‘Using Conjoint Analysis in Merger Control’ (ACM Working Paper, 2016). ↩
-
To do this, additional data such as customer home or work postcode may be required. ↩
-
In our experience, though, this is difficult to do unambiguously (for example Poundland/99p Stores, Celesio/Sainsbury’s). ↩
-
Either permanently, or for a reasonably extensive amount of time, so that the purchase cannot just be delayed. ↩
-
Further examples of diversion questions are provided in Illustrations. ↩
-
It is sometimes possible to test this assumption. For example, if a survey is being conducted in more than one area there may not be a sufficient number of respondents in any one area stating a change in behaviour as a result of a price increase, but responses can be aggregated across all areas to check the relationship between responses to the price and forced diversion questions. Where this has been done, the CMA has usually found them to be similar. ↩
-
Each survey is different and the list of options is usually more complex than this in practice. For example, diversion may be from a bricks-and-mortar outlet to another bricks-and-mortar outlet or to an online outlet, and vice versa. ↩
-
For example, own-Party supplier (OP) (= same supplier), other merger Party supplier (MP), third-party supplier (TP), or don’t know. ↩
-
See the Ladbrokes/Coral merger case questions in Illustrations for a fully worked example. ↩
-
Note that the examples given here are not exhaustive. ↩
-
This is referred to as ‘bundling’ in the economics literature. ↩
-
Examples of diversion ratio calculations are provided in Illustrations. ↩
-
However, note that it is usual to interview a customer once only for a survey and so frequent visitors to a store may be slightly under-represented in the achieved sample. ↩
-
If this is a price diversion question, they may be asked a subsequent forced diversion question. ↩
-
Unless the data is weighted. ↩
-
Departures from these assumptions tend to narrow the confidence intervals. However, as noted above, the use of the formula as it stands is not problematic, as there are other sources of error that have not been taken into account. ↩
-
An alternative is to say ‘permanently’ closed. This may be appropriate in markets where, for example, large infrequent purchases are made. ↩