Market Data Insights: October 2020
Updated 14 January 2021

© Crown copyright 2021
This publication is licensed under the terms of the Open Government Licence v3.0 except where otherwise stated. To view this licence, visit nationalarchives.gov.uk/doc/open-government-licence/version/3 or write to the Information Policy Team, The National Archives, Kew, London TW9 4DU, or email: psi@nationalarchives.gov.uk.
Where we have identified any third party copyright information you will need to obtain permission from the copyright holders concerned.
This publication is available at https://www.gov.uk/government/publications/market-data-insights/market-data-insights-october-2020
This month in brief
After the UK was officially in recession following 2 consecutive quarters of negative growth in the first half of 2020, there were signs of recovery in Q3 of 2020. However, there remains uncertainty over the nature and pace of recovery in various sectors and the economy as a whole. This is due to the second wave of the virus, the outcome of trade negotiations with the EU, and any permanent re-structuring of any sectors due to COVID-19.
By the end of September, the global death toll from COVID-19 exceeded 1 million. Alongside this, the UK recorded its highest daily tally of cases since May. To help curb the growth in cases the government introduced new measures to help limit the growth in cases. This included banning gatherings of more than 6 people, encouraging working from home and limiting weddings to 15 people. Large swathes of Scotland, Wales and North-East England also found themselves under local lockdowns.
There are concerns that these lockdowns and any possible further tightening of restrictions could lead to severe economic consequences. Many have predicted a double dip recession as prolonged closures could lead to bankruptcies and job losses in a wide range of sectors.
Credit Spreads as at 30 September 2020
| AAA | AA | A | BBB | ||||||
|---|---|---|---|---|---|---|---|---|---|
| 36.0 | 67.0 | 119.0 | 202.0 | ||||||
| ▼ 2.7% MoM | ▲ 1.5% MoM | ▲ 3.5% MoM | ▲ 4.1% MoM |
An asset’s ‘credit spread’ is the difference between its yield and that of a government issued bond of similar maturity. It is an indicator of the perceived riskiness of the asset. It represents how much investors want to be rewarded for investing in it instead of a lower risk government bond.
Over September, the credit spreads for AAA-rated investment grade credit widened. However other investment grade credit spreads have narrowed reflecting the uncertainty in the market.
Earnings
Average weekly earnings (AWE) is the lead indicator of short-term changes in earnings in the United Kingdom, and replaced the Average Earnings Index in January 2010. AWE for any month is the ratio of estimated total pay for the whole economy, divided by the total number of employees. As a result, AWE can be impacted by changes in rates of pay, and the composition of the labour force.
The chart below shows how the average weekly earnings has grown between 2010 and 2020 for the whole economy, as well as the public and private sectors.
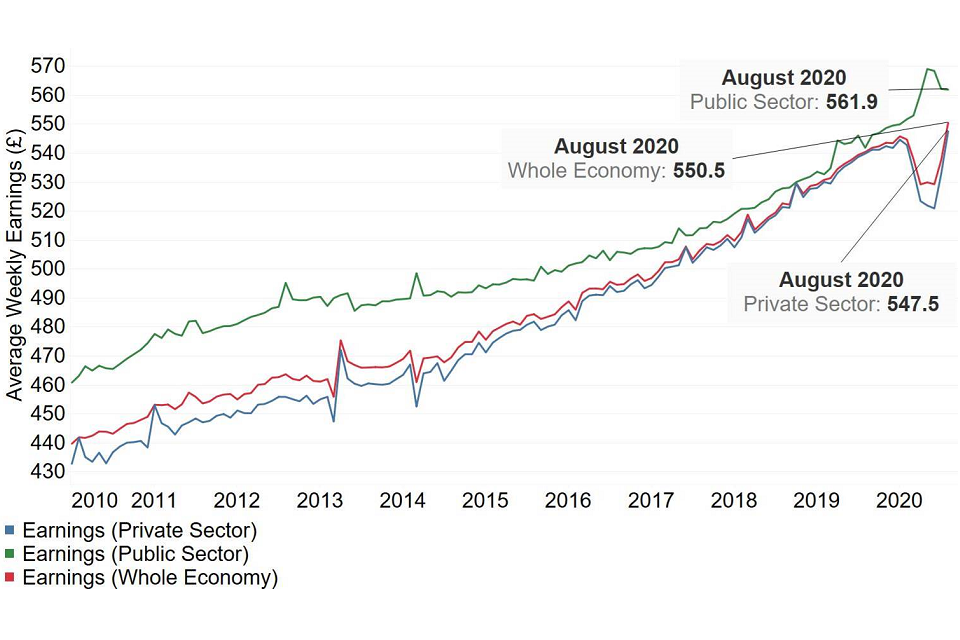
The average weekly earnings grew by 2.4% between July 2020 (£538) and August 2020 (£550). This increase has been driven by the private sector component where average weekly earnings increased by 2.7% over the month of August to £548. Average weekly earnings for the public sector remained level at £562 over the month.
As we can see from the graphs, the pattern of pay growth is correlated to the number of employees who are furloughed. This led to sharp falls in weekly wages in April as large pockets of the economy were being supported by the Coronavirus Job Retention Scheme. Over the past couple of months, as employees have returned to work from furlough, there has been an increase in the average weekly wages.
Inflation
The Consumer Price Index (CPI) measures the average change in prices over time that consumers pay for a basket of goods and services. CPIH is similar to CPI, in that it also measures inflation but it also includes a measure of owner occupiers’ housing costs.
The chart below shows CPIH inflation between 2010 and 2020, falling from around 4.5% in 2011/12 to around 0% in Q4 2015 before rising to almost 3% in Q4 2018. Since 2018 it has steadily fallen to 0.7% in September 2020
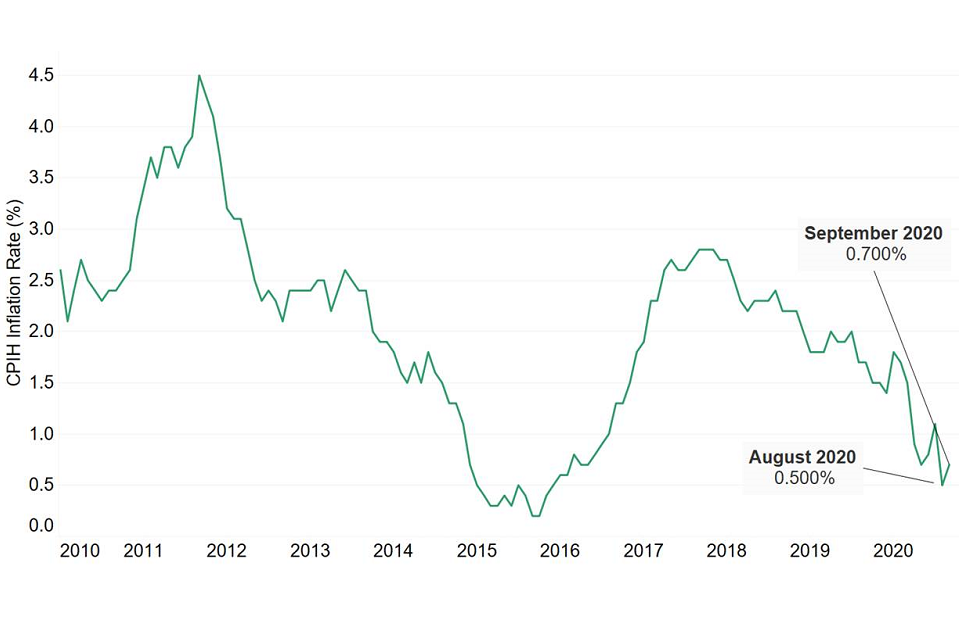
There was a small increase in the CPIH inflation rate to 0.7% in September 2020, up from 0.5% in August 2020.
The largest contributor was recreation and culture. Other contributors included transport costs, and cafe and restaurant prices as the ‘Eat Out to Help Out’ scheme came to an end. There were small downwards pressures applied on the index by the cost of furniture, household equipment and maintenance; food and drink; and games, toys and hobbies.
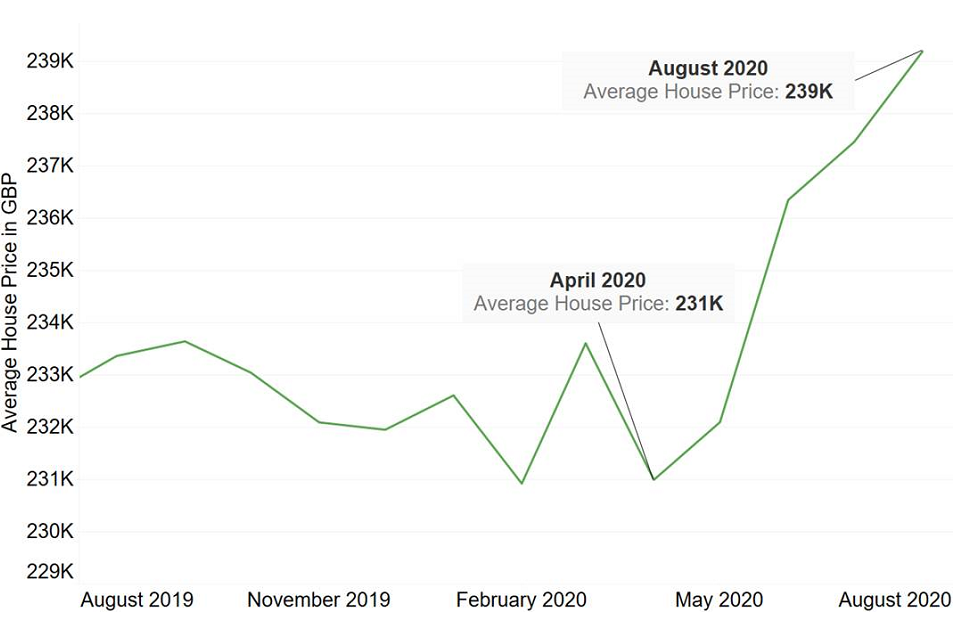
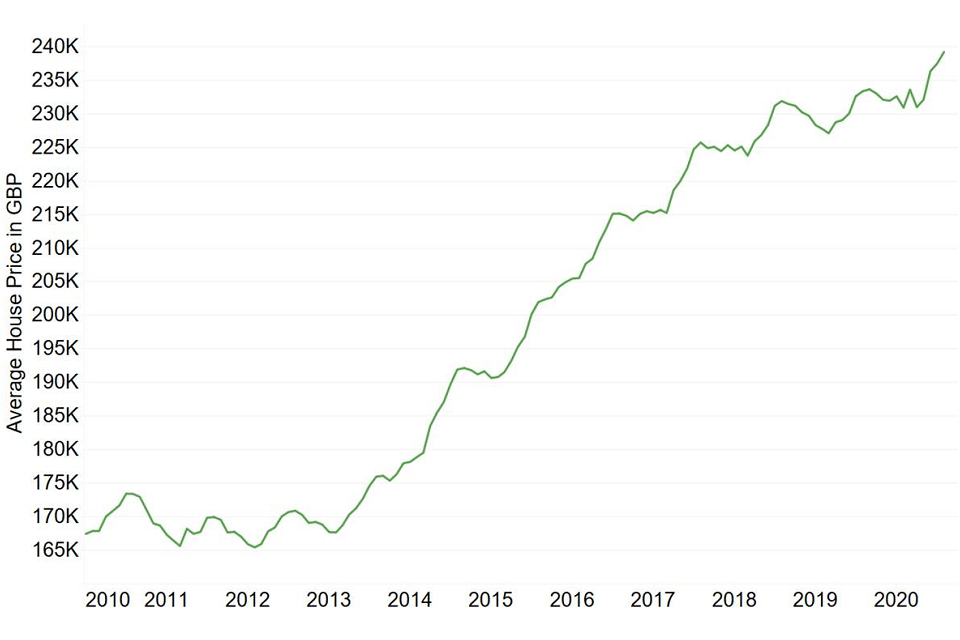
Property
Average UK house prices remained relatively stable between August 2019 (£233,000) and April 2020 (£231,000). Since the relaxation of COVID-19 restrictions, and the stamp duty holiday, there has been an increased demand in the UK housing market which has seen house prices rise sharply over recent months.
The chart below shows the average UK house price between 2010 and 2020. This was largely stable over the first few years (2010-2013), but has grown significantly over the last 7 years, achieving a growth of almost 50%.
Any material or information in this document is based on sources believed to be reliable, however we cannot warrant accuracy, completeness or otherwise, or accept responsibility for any error, omission or other inaccuracy, or for any consequences arising from any reliance upon such information. The facts and data contained are not intended to be a substitute for commercial judgement or professional or legal advice, and you should not act in reliance upon any of the facts and data contained, without first obtaining professional advice relevant to your circumstances. Expressions of opinion do not necessarily represent the views of other government departments and may be subject to change without notice.
Quality Assurance Scheme
The Government Actuary’s Department is an accredited organisation of the Institute and Faculty of Actuaries’ Quality Assurance Scheme.