Longitudinal linkage of administrative data; design principles and the total error framework
Updated 16 July 2021

© Crown copyright 2021
This publication is licensed under the terms of the Open Government Licence v3.0 except where otherwise stated. To view this licence, visit nationalarchives.gov.uk/doc/open-government-licence/version/3 or write to the Information Policy Team, The National Archives, Kew, London TW9 4DU, or email: psi@nationalarchives.gov.uk.
Where we have identified any third party copyright information you will need to obtain permission from the copyright holders concerned.
This publication is available at https://www.gov.uk/government/publications/joined-up-data-in-government-the-future-of-data-linking-methods/longitudinal-linkage-of-administrative-data-design-principles-and-the-total-error-framework
Louisa Blackwell and Nicky Rogers, Office for National Statistics
1. Introduction
Alongside many other National Statistical Institutes (NSI), the Office for National Statistics (ONS) is committed to increasing the use of administrative data in the production of statistics; to reduce costs, reduce respondent burden and to improve the quality and granularity of our statistics. ONS is currently progressing a programme of research which aims to increase the use of administrative data in the production of population and migration statistics. Much of the population and migration statistics transformation research in ONS involves longitudinal linkage of administrative data by diverse teams.
From an extensive review of the literature we realised that existing error frameworks did not support the use of longitudinally linked administrative data sets. We therefore developed an error framework to assess statistical error in administrative data sources to help fill this gap and applied it to longitudinally linked Home Office data used operationally at the border. This has further deepened our understanding of this data source and the findings from this research will help us address statistical design challenges of using longitudinally linked administrative data sets and, through the use of quality indicators, inform and support analytical use of these types of data.
This paper seeks to offer a template for the statistical design of data sets that are derived through the linkage of administrative data to produce longitudinal data sets. While the focus is on administrative data linkage, it could also be applied to other data blends, for example microdata linkage of survey and administrative data. We emphasise the importance of careful statistical design, prior to implementation. The idea is that the design should represent the optimal balance of user requirements, design features and statistical error management.
To support this, we propose an error framework. This is intended as a helpful taxonomy of the potential errors that are integral to administrative data sources, to be aware of in either evaluating admin-based sources or in designing new, integrated, longitudinal data sets. Some of the errors that we draw attention to are conceptual and so resistant to quantification, in any precise way at least. Some error can be quantified, and we highlight the use of scaling factor analysis, linkage error investigations, edge effects and the analysis of residuals. We are still developing our thinking regarding error management and the quantification of statistical error and uncertainty, so this paper reports on work that is still in progress. We provide examples from our application of this framework to help us understand administrative data, for estimating international migration and for the production of population estimates based on administrative data. We welcome comments and suggestions to further progress this exciting and valuable research area.
2. Statistical design
We like to use a metaphor from the construction industry when we think about statistical design. The focus here is on the statistical design of a longitudinally linked administrative data set. Think of it as you would the construction of a building. Where would you begin? Not with concrete, bricks and mortar. They come after the design work is complete. In building a longitudinal data set, it’s important to begin by thinking about what the data set is to be used for. We suggest to:
- gather the user requirements
- identify any structural constraints that may affect the design
- design, design, design. From the initial outline sketches down to the minutest detail
You wouldn’t leave any of the implementation to chance. The three phases of the design process merit expansion.
2.1 Gathering the user requirements
It is essential to have a clear and concise statement of what the aims and objectives are for the data, including the concepts and the variables that will be involved. We provide an example from the work we are currently doing on developing methods for measuring international migration. Questions to be answered include:
- what are the research questions that the data need to help to answer?
- is the intention to understand processes, to examine the correlates of longitudinal outcomes? Or are we seeking to produce robust measures and statistics?
- what is the population of interest? Can we account for this population in its entirety? Do we need a control population for comparison?
- what are the variables or concepts of interest?
- what needs to be defined? How is a migrant defined? Can this be identified in the source data sets?
- is our primary concern migration as a component of population change? If so, are we equally interested in immigration and emigration?
- are seasonal patterns of interest?
- what about internal migration? Is the internal migration of international migrants of interest? Do we seek to know how this differs to the internal migration patterns of non-migrants?
- are all international migrants of equal interest? Or are the migrants’ intentions the over-riding concern? For example, if migrants come or leave for study, work, family, safety or other reasons?
- do different migration policies apply to the different types of migrant?
- do we need to identify whether migrants have temporary, short-term or permanent intentions in the host country?
- how far beyond the migration event are we interested in? For how long do we need to observe post-migration outcomes? This can include social and economic outcomes, including measures of social integration.
- are life-course trajectories of interest? Patterns of partnering, family formation, death and cause of death.
- are inter-generational impacts of migration of interest? Do we seek to follow up children born before and/or after migration?
- how much granularity is required, in terms of for example demographic and socio-economic characteristics and geography? Is the intention to produce national, regional or local outcomes?
The research questions have implications for the frequency and spacing of observations. Ideally, the observation window would precede the migration event, but this would be an ambitious design, requiring international data sharing. If observation begins at the point of migration, the follow-up period needs to extend far enough to capture the outcomes of interest.
Variables that are of interest could be extensive. As a minimum, we probably need nationality, citizenship, country of birth, age, sex, ethnicity, marital status, education, year/date of first arrival, year/date of latest geography and departure details.
It is crucial to understand the user requirement for statistical quality. Is the intention to produce an evidence-base for policy? For planning? For national statistics? Will it form the basis for resource allocation? If so, at what level of geography? Do stakeholders have national or local interests? Is there an international stakeholder? These questions imply both the statistical design and the user appetite for statistical error.
2.2 Understanding users’ statistical quality requirements
Consistency
How important is it that the data are consistent over time? Will adjustment be required, for example for loss to follow-up, or attrition, from the data? We discuss the error associated with harmonisation over time below.
Another consideration is the user requirement for timely evidence. Can the user accommodate delays due to the follow-up required, for example to meet the definitional requirements? A ‘long-term’ migrant might be defined as one arriving and staying or leaving and staying away for at least 12 months. This implies a one year lag in identifying migrants. If this is unacceptable, consideration is required on estimating or modelling this.
The user requirement for accuracy
The user requirement for accuracy has implications for error management. For example, the design of record linkage involves a trade-off between false negative and false positive error. Is there a critical threshold of accuracy, measured in terms of statistical confidence, that the data must support? Does the user require statistical uncertainty measures? Does the accuracy requirement vary across the data set? For example, users may tolerate a given degree of missingness for some variables but not for others.
Accessibility
The statistical design may be influenced by user intentions regarding data access. If the intention is to provide the data set in its entirety to user researchers, the data preparation and processing requirements may be more onerous than if the intention is to keep the data in-house and supply outputs to users. For example, the degree of clarity and transparency required for a third party to use and understand the data may require extensive metadata, supporting documentation and guidance.
Relevance
Administrative data have their own user-driven operational design. In integrated data sets they are re-purposed to meet another set of requirements. This inevitably requires compromise. User consultation may be required as an ongoing process, to ensure that data design decisions are informed by known priorities, which may change over time. Likewise, close collaboration with data suppliers is essential, both to build knowledge and understanding of the data and to ensure that any changes to the administrative processes are known and can be accommodated. For example, we have collaborated with Home Office analysts and experts to understand the statistical benefits of exit checks data which have been collected for operational purposes. This has involved us understanding how data from multiple administrative systems, including (via carriers) passenger data, passport scans at the border, and from immigration records are integrated and linked.
If variables that are critical to users are not available in any of the source data sets, are there good proxies? How well do they correspond to the desired information? Can this be quantified?
2.3 Structural constraints that may affect the statistical design
A review of the relevant sources will identify the data sets available for integration. Coverage is a key consideration, discussed below in terms of coverage error. It is possible that more than one data source will be required to ensure that all of the population of interest is covered. For example, we have found differential treatment of armed forces, foreign armed forces and their respective families, and of people living in communal establishments in the administrative sources that we are using. Other questions to consider are:
- what topics are covered?
- what are the costs associated with the use of the data?
- are there any legal barriers, such as the need for respondents’ informed consent?
- are there any ethical concerns? Do you require ethics approval to use the data?
- are particular software skills required for data manipulation?
- what infrastructure is required to store and manipulate these data or data structure?
- what technical capacity is required to support growth in the scale and complexity of the data over time?
- are there any known risks to the continuity of sources? What control is there over future production? What are the risks that critical elements of the data will be changed or discontinued? What is the contingency if this happens?
- can resources and training be ensured to maintain continuity of the project?
- should each source be integrated to produce a linked data set, or would it be beneficial to retain some data as a comparator, possibly for calibration or adjustment?
- is the integration or linkage of these data sustainable over time?
Discontinuities in definitions and classifications between sources and over time are discussed below in the context of sources of statistical error.
3. Identifying the design options and optimising statistical error
The design stage requires a series of decisions that are influenced by user requirements, the data available and any structural constraints. They also require the optimal balance of different sources of potential error within the linked data set, bearing in mind user needs.
3.1 Role of the total error framework to support design and quality evaluation
To achieve the optimal balance of statistical error in design, it’s important to be aware of where errors might enter the data and how they propagate as data processing progresses. Corrective action at different processing stages provides opportunities for quality to improve over time, so error should not be assumed to be cumulative. Here it is useful to draw on the Total Survey Error Framework which has been developed to support statistical design (Groves et al 2004, Zhang 2012). This provides a useful taxonomy of the different potential sources of statistical error, relating mainly to administrative data. Not all types of error are measurable. But they need to be borne in mind, together with potential quality improvements over time, when designing a longitudinally linked data set. Here we introduce Zhang’s (2012) framework, subsequently developed further by Statistics New Zealand, to discuss more fully the sources of error involved in linking administrative sources.
The framework proposes a staged approach to understanding data quality, looking first at single data sets in Phase 1 before assessing error in the production of data sets created through the integration of multiple sources, in Phase 2. We have taken this framework a step further, to incorporate error that arises as a result of the longitudinal nature of our data sets. The next section describes the framework we have developed.
4. The error framework
In common with the framework proposed by Zhang, we consider the errors associated with both data objects (records) and their attributes (variables). However, in administrative data these are given by the source data sets, we are not designing the attributes as you might in a survey, we are repurposing what is already there. At the heart of our framework are data sets which we have not designed, they are what they are. We first address the errors to be considered in each individual source.
4.1 Framework for single longitudinal administrative sources
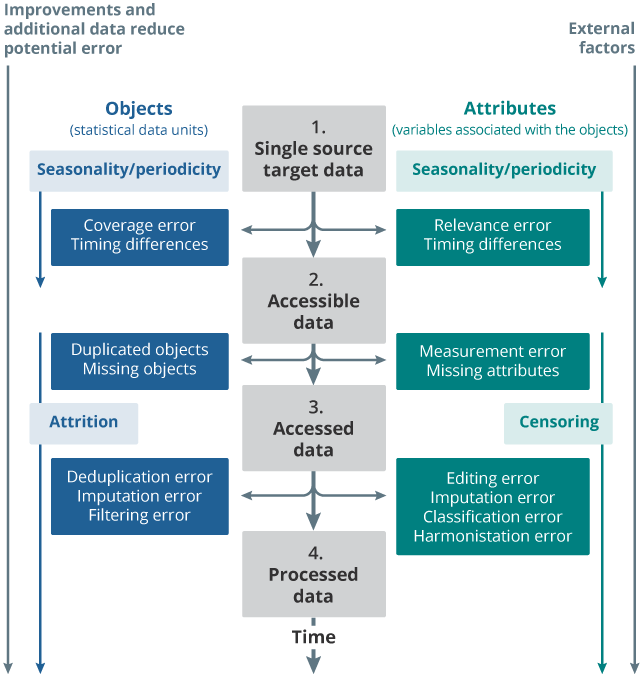
Download an image of the error framework for single longitudinal administrative sources. This framework is used to consider the statistical properties and errors in each single source before any integration of multiple sources. The single source framework identifies four different stages of the data journey – target data, accessible data, accessed data and processed data. Errors are represented as a conceptual difference between data at each of these stages. Errors are split between objects and attributes: errors occurring to objects relate to the entity the data are for, be that people, events, businesses for example. Errors relating to attributes relate to what you are measuring for the objects. Errors for both objects and attributes can affect each other (represented by a double arrow between the two). Not all types of errors will be applicable to each source of data and there may be other sources of error identified, particularly for processed data. It’s important to note too that data processing provides opportunities to address errors found in the data. While we draw attention to errors in the de-duplication process, for example, that process is also bringing improvements. If duplicate records are identified and resolved, it is likely that the improvement far outweighs the error introduced by this process. Likewise, editing resolved errors in the data, but may also introduce some marginal error.
The organising framework is time, as data pass through different processes and stages. The target data is conceptual – the ideal data to be collected. In the case of migration, this might be, for example, all travel events by migrants. However, what we actually get is the accessible data. The difference between what we want and what we get we refer to as frame error, for a full listing of the errors at for single sources please refer to tables in Appendices 1 and 2. Coverage errors occur if either our accessible data include objects that are not in our (ideal) target data, or if we are unable to access data we would ideally want, but are not available in the accessible data. Since the target data is a conceptual thing, it’s possible that the errors that differentiate the target and accessible data are not measurable, perhaps they can only at best be approximated. We also include here timing error, which arises if there is a gap between the objects we seek to observe and the time window when data were collected. In terms of the attributes, at this stage there may be validity error. Here we might find a difference between the ideal measures that we would like and the operational measure that has actually been collected. An example here would be age; we might prefer the precision afforded by having a person’s date of birth, but perhaps we can only access self-reported age in years. Again, there could be timing errors that impact attributes, depending on the preferred data collection window and the actual one.
The data that are actually accessed may be a subset of what is accessible, and here we find selection errors for objects. It is common for there to be duplication in administrative sources and we refer here to duplication error, for example if duplicate records are not indentified and reconciled. Conversely, there may be missing objects. These are objects which in theory should be in the data, but are missed. Trickiness arises if duplication and missingness cancel each other out, because any aggregate-level cross-sectional distribution could look acceptable, but may contain many compensating errors, which would reduce the longitudinal data available in the data set. In terms of attributes, at this stage there is potentially measurement error. This could arise for example through the misspelling of names, address details that haven’t been updated and the inclusion of system dates rather than interaction dates. There may be missing attributes, for all objects, or for a random or systematic subsample of objects. It’s useful to note at this stage that errors that impact either objects or attributes can corrupt the other, so data for objects may be unusable if they have completely missing attributes and attribute data may be useless unless linked to an object.
There are numerous sources of error as data are turned into processed data. The list here is not exhaustive. Error can arise through failure in deduplicating the accessed data. Either records that are actually different can be accidentally or mistakenly ‘deduplicated’, or actually duplicated records could be overlooked, remaining as duplicates in the data. Imputation should be approached with caution in a longitudinal data set. Record imputation could introduce spurious data, which thwarts longitudinal analysis. When we filter our data, we may erroneously include unwanted objects or exclude desirable ones. In terms of attributes, data editing can introduce erroneous attribute data. Imputation for missing values can introduce errors which, though they look like reasonable approximations cross-sectionally, they could introduce spurious findings in longitudinal analysis. There is the risk of classification error, if attributes are mis-classified into the wrong group. In a similar vein, harmonising values of attributes to conform to an ideal target concept could possibly introduce error.
Given that these data are being collected through time, this increases the scope for external factors to impact on the data. For example, policy changes, technological developments, political or even ecological events. Longitudinal data additionally suffers from attrition, whereby data objects are lost to follow-up. This may be as a result of measurement errors, non-response or, for example, through an unobserved death or departure. Some attributes may change, for example a person’s nationality or their surname, which may impact record linkage and create loss to follow-up. It is possible that censoring introduces error, for example through the non-inclusion of events which occur just outside of the data observation window or insufficient data are available for the event which has occurred. There is also the possibility of periodicity error - where it is possible that data capture isn’t frequent enough, or the collection of data on attributes isn’t adequately frequent. In a related way, there may be inadequate capture of seasonal events.
Our initial thinking, drawing on the Total Survey Error literature, was that error propagates through the framework through time, building at each stage. We believed it to be cumulative. But it is more nuanced than that. While error can accumulate over time, or can be corrected over time, there is also the possibility that compensating errors may complicate matters. Compensating errors, such as undercoverage which is masked by duplicates in the data, may be invisible in cross-sectional comparisons. They will, however, compound in longitudinal analysis. We explain this further in the context of the multiple source framework below.
4.2 Framework for integrated longitudinal administrative sources
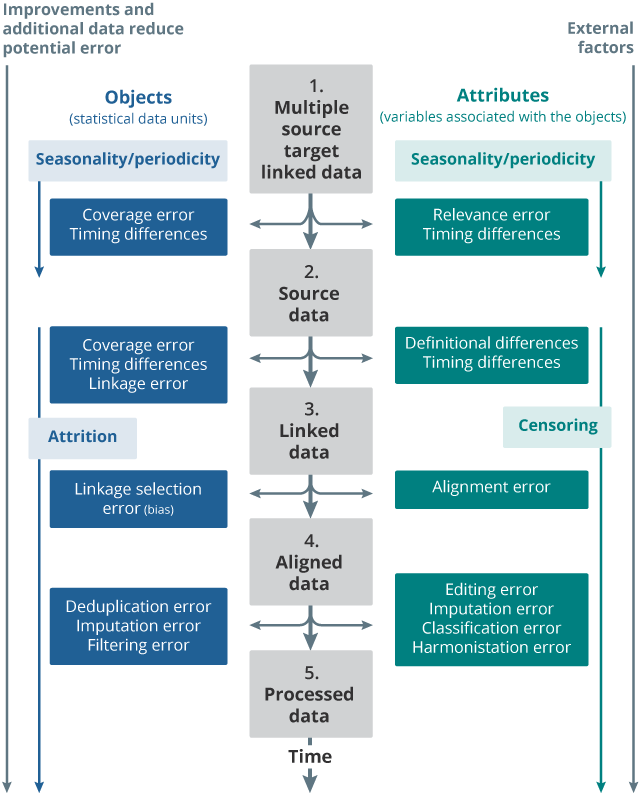
Download an image of the error framework for multiple longitudinal administrative sources. It consists of five stages – target linked data, source data, linked data, aligned data and processed data. Errors are represented as a conceptual difference between data at each of these stages. Many of the errors in the multiple source framework are conceptually similar to those in the single source framework. The main difference is the fact that we are measuring errors between the source data sets and the ideal target linked data (rather than target data) as well as errors between the source data sets to be linked. These conceptually similar errors have the same name between the single source and the multiple source frameworks. For example, timing differences, coverage error, relevance error, imputation error, selection error and processing error.
In the multiple source framework, target linked data are different to the target data for each individual source. Your target linked data are likely to be specific to the group of objects that you hope to measure through linkage of multiple sources. Here we consider linkage error. This can be error arising from linking objects together incorrectly (false positive error) and failing to link objects together that should have been linked (false negative error). This is likely to occur where there is no common unique identifier and linkage is dependant on attributes such as name, date of birth and address used as linkage keys.
Linkage error can occur through duplication of objects in the source data sets resulting in falsely linked objects; missing or mis-recorded attribute data such as name, address or date of birth resulting in missed links (false negatives). Linkage errors can undermine the reliability of statistical outputs that are based on analysis of longitudinally linked administrative data. Where possible, strategies are needed to address linkage error. In any event, linkage errors should be estimated and well documented to inform the fitness for purpose of the linked data set.
For the final stage (processed data), processing may have occurred in the single source or in the multiple source framework. For example, imputation may have already occurred at single source, or it may be done after linkage. Sources of error in the multiple source framework are also described in Appendix 3.

: s f subscript i j k equals census subscript i j k divided by a b p e subscript i j k
The purpose in applying the administrative data error framework is twofold. Firstly, it is essential to identify and examine sources of error to make statistical design decisions in the production of further linkage. We note the interaction between different sources of error, and the need to seek data designs that are optimal for the intended purpose of the linked data set. For example, there may be a trade-off between linkage, coverage and imputation error. In our experience, records that have poor quality data, possibly through measurement error, are also harder to link. Perhaps this is due to the quality of the identifiers used for linkage. One option is to develop sophisticated record linkage methods to minimise false negative matches (therefore accepting more false positives) and in this way you could aim to maximise the coverage of objects in the linked data set. But there is a possibility that the attributes that relate to these objects are also of poor quality, and will generate either missingness in the attribute fields, or will require imputation. Imputation is often undesirable in longitudinal data, since it can introduce spurious outcomes (discussed in the context of single-source errors above). The avoidance of missing data and imputation may be the over-riding concern, rather than maximising coverage.
The second application of the error framework is to support understanding and reporting of the statistical properties of a longitudinally linked administrative data set. The framework could also be applied to data sets where administrative and survey data have been integrated. In the next section we discuss some of the quality indicators that we have used to quantify error identified in the framework.
5. Quality indicators
5.1 Scaling factors
We have used scaling factors extensively to gain insights into the coverage and completeness of administrative sources. The basic idea is to find a benchmark against which to compare the administrative data. Here we illustrate scaling factors with research to understand the quality of Administrative-Based Population Estimates (ABPEs)[footnote 1]. The 2011 ABPEs are compared against 2011 census data, the latter assumed to be the ‘gold standard’. The scaling factors are calculated as:

: l s f subcript i j k equals log open paren census i j k divided by a b p e subscript i j k close paren
Where:
abpei,j,k is the admin-based population estimate for Local Authority (LA), i = 1, …, 348,[footnote 2]
by j = 1,2, sex
and k = 0, …, 90, age
and censusi,j,k is the corresponding census estimate
This research makes the assumption that census is an external benchmark representing the ‘true’ population size. For the purpose of modelling, we normalise the scaling factors by logging them:
Download images showing the logged scaling factor profiles for females and the logged scaling factor profiles for males in all 348 local authorities in England and Wales. These profiles allow the clear identification of local authorities where the ABPEs have outlier values; further research identified the cause of error in most cases to be the result of coverage error arising from the administrative sources in areas where there were armed forces, foreign armed forces and their dependants, who typically interact with administrative data systems differently to the general population.
5.2 Quantification of false positive and false negative matching
Where record linkage has been done it is valuable to assess the quality of record matching that has been achieved. You can assess the quality of data by:
- undertaking an assessment of linkage rates. Linkage rates are usually calculated using source data as the denominator. This can also involve further automatic matching, possibly using relaxed matching criteria, together with clerical review.
Linkage rates should be calculated for each data source that has been linked. The linkage rate is calculated as:

Linkage rates can only ever be 100% when we expect all individuals in Source A to be in Source B with certainty. Lower linkage rates could be due to linkage error, or other factors such as coverage error, selection error or simply the absence of individuals or a population sub-group from one of the data sources.
- undertaking a quality assessment of linked and unlinked record pairs to estimate false negative and false positive rates. For example taking a sample of linked records and reviewing these clerically to check whether there are matches that appear to be erroneous. Likewise, a re-examination of unmatched residual records can shed light on false negative matching.
A very conservative approach to false positive matching typically creates higher false negative match rates, meaning more true matches are missed. In terms of data linkage quality metrics, the strategy may be to maximise precision, which is calculated as:

Alternatively, a statistical priority could be to maximise recall (also known as sensitivity) to assess the proportion of actual links that have been classified correctly. This is calculated as:

This is a useful exercise because missed matches can introduce bias in the data if particular sub-groups of records are more or less likely to link.
5.3 Edge effects
In longitudinal administrative data sets we have become aware of edge effects which may impact the use of the data for statistical outputs. We are in the process of exploring these empirically. At this stage we can identify them conceptually as:
- left-focused initial quality improvements. It is reasonable to assume that in the early stages of administrative data collection and processing, there will be initial quality issues which will become apparent and be corrected as the data system beds down to a ‘business-as-usual’ production system. The effect may be a slight degradation of data quality in the earliest data which diminishes over time.
- right-focused incompleteness. At whichever point a data extract is taken the data become right-censored; there will be events or objects that sit outside, after the point at which the data cut is taken. We refer to this in the error framework as censoring error. Right-focused incompleteness is similar but slightly different. This refers to incomplete information within the data extract, either in objects or in attributes, which arises because of the data cut-off. So, for example, there may be missing attribute data for an object because the attributes are collected and/or processed after the cut-off date. This could render the object data unusable.
- right-concentrated retrospective edits. In a live processing environment which is creating longitudinal data it is possible that data errors can be corrected retrospectively. For example, false negative matches could be corrected in the light of new demographic information which generates new record matches. This may lead to quality improvements which would appear in new data extracts for data periods that were covered in previous extracts. The scale of retrospective editing is important to understand because it should inform advice to users about certainty in the sources extract being used. Logically we could expect the retrospective edits to be focused around the later dates that the extract covers; this is something to be tested empirically.
5.4 Analysis of residuals
To begin investigating the migration outcomes for visa nationals studying in the UK on study visas, we have linked exit checks data from the Home Office to Higher Education Statistics Agency (HESA) data for international students in higher education. A key interest is migrants’ residency on completion of their studies.
The HESA data included all non-EU students who should require a visa to study in England and Wales. We matched this against exit checks data for migrants on a study visa sponsored by an institution covered by the HESA data. Match rates of 80% and 74% were achieved for 2015/16 and 2016/17, respectively. This multi-source linkage is work in progress. So far the data have been linked using deterministic matching, so the unlinked data will contain false negative matches.
Download an image showing the age distribution of the matched and unmatched data following HESA/ exit checks matching for males. From these distributions based on residuals from deterministic matching only it is impossible to know the extent to which the matched data set is representative of all non-EU nationals in higher education. As well as falsely unmatched records, the HESA residuals could include non-EU nationals who hold non-study visas, for example because they are also in employment or hold family visas. Further matching and investigation is underway.
6. Concluding comments
Administrative data are collected and processed for operational purposes. Statisticians are committed to maximising the use of administrative data for statistical purposes. It is possible that the data quality issues that are determined by operational considerations are at odds with statistical quality imperatives. It would be wrong to assume that the two things coincide. So, for example, an operational objective might be to avoid false positive matching of records at all costs because of the potentially adverse operational consequences of such errors. Strict matching criteria to avoid false matches will result in high false negative matches, which would be made if the matching criteria were relaxed to some degree. Here the operational and statistical imperatives disagree.
Given that our intention as statisticians is to repurpose administrative data, it is incumbent upon us to understand their design, and the errors that have entered the data at each stage of their collections and processing journey, alongside the improvements that have been made. To support this, we have developed an error framework for longitudinally linked administrative data. It isn’t a model, it’s merely a list, not yet exhaustive, to support the careful consideration of sources of error.
We suggest two-fold application. The first is to understand sources of error, both in single source and multi-source administrative data sets. This is to support the iterative design of new longitudinal data sets. We recall our building metaphor here, to underline the critical importance of careful statistical design. If you try to build a structure without plans, specifications, structurally sound design, there’s a real risk it will fall down, either during construction of soon after. So it is with the design of longitudinal administrative data sets; careful design will ensure that the data’s statistical properties are optimised to suit the users’ requirements.
The second use of the framework is to support understanding of statistical properties for reporting purposes, to support use of the data. We are in the process of developing quality indicators to help us to understand administrative data quality and to support the analysis of admin-based data. We include some of these indicators here and welcome further suggestions and comment.
7. Recommendations
Our recommendations for the longitudinal linkage of administrative data for statistical purposes embrace three areas:
Conceptual development
- Acceptance or acknowledgement that operational data quality and statistical data quality are different and can be in conflict.
- Revisit the Generic Statistical Business Process Model (GSBPM) and adapt for use of administrative data. This should reflect the processes for administrative data collection, processing, and its use in the production of statistics.
Implementation
- Endorse Accelerated Data Onboarding Project Team (ADOPT) model which we have trialled for data acquisition within ONS for understanding and managing data quality.
- Follow best practice in statistical design, and map and manage statistical error throughout.
- Maintain a continuous feedback loop with data suppliers to deal with quality issues as they arise.
- Use a secondment model to integrate analysts and researchers into teams in Government Departments who regularly work on the administrative data in question.
Quality and error management
- Develop criteria for acceptance of longitudinal statistical outputs and measures.
- Raise awareness of the risks of not managing and reporting error with end-users.
- Develop quality indicators that are intuitive and easily interpretable – for example the ‘nutritional indicators’ developed by Statistics Canada.
- Building an uncertainty toolkit and applying this.
8. References
Groves, R. M., F. J. Fowler Jr., M. Couper, J. M. Lepkowski, E. Singer and R. Tourrangeau, (2004), Survey methodology, Wiley, New York.
Office for National Statistics, 2019, Developing our approach for producing admin-based population estimates, England and Wales: 2011 and 2016.
Statistics New Zealand Guide to reporting on administrative data errors
Zhang, L. (2012), Topics of statistical theory for register‐based statistics and data integration. Statistica Neerlandica, 66: 41-63. doi:10.1111/j.1467-9574.2011.00508.x
9. Appendices
9.1 Errors in the single source framework
| Objects | Attributes |
|---|---|
| Frame error: Coverage error Assessing objects that are not in the target data, or not being able to access objects that are in the target data. Timing differences Objects in the ideal target data that are not accessible because of a discrepancy in the time window for obtaining observations. |
Relevance error: Validity error The difference between ideal measurement of attributes sought about an object and the operational measure used to collect it. Timing differences A conceptual discrepancy in the timing of the measurement of attributes between the ideal target data and accessible data. |
| Selection error: Duplicated objects Objects that are represented more than once in the accessed data. Missing objects Objects that in theory are accessible but are not in the accessed data. |
Measurement error: Measurement error Errors arising from attributes that are not recorded accurately. Missing attributes Attributes that are missing from the accessed data (could be for specific objects or all of the objects). |
| Processing error: Deduplication error Errors arising from deduplication of objects in the accessed data set. This could include both deduplicating objects that are actually different (false positive error) or failing to deduplicate objects that are the same (false negative error). Imputation error Errors arising from the imputation of missing objects. Filtering error Errors arising from the selection or de-selection of accessed objects to an ideal target set. |
Processing error: Editing error Errors arising from editing the value of an attribute. This could include editing as a result of validation or QA checks. Imputation error Errors arising from the imputation of missing attribute values. Classification error: Errors arising from classification of values into groups or derivation of new attributes. Harmonisation error: Errors arising from the harmonisation of values of attributes to an ideal or target concept |
Table 1: Single source errors
9.2 Longitudinal error
| Objects | Attributes |
|---|---|
| Attrition The loss of research objects or units over time. Occurs naturally, through death (or an unobserved migration). Also occurs through failure of follow-up, a refusal to take part, in the case of survey data, or through missing information or linkage failure, in administrative sources. |
Censoring Where the value of a measurement or observation is only partially known. Right censoring is when the research object drops out of the data before the end of the observation window or does not experience the event of interest during the observation window. Left censoring is when the event of interest has already occurred, before the observation window begins. |
| Periodicity/seasonality error Objects are not observed because the data capture is not frequent enough (periodicity) nor adequate to capture seasonality in the data (seasonality). |
Periodicity/seasonality error Measurement of attributes over time are not frequent enough (periodicity) nor adequate to capture seasonality in the data (seasonality). |
Table 2: Longitudinal error – applies to both single source events and multisource longitudinal data sets
9.3 Errors in the multiple source framework
| Objects | Attributes |
|---|---|
| Frame error: Coverage error Observing objects that are not in the target linked data, or not being able to access objects that are in the target linked data. Timing differences Objects are not observed due to conceptual discrepancies in the timing of the capture between the target linked data and source data. |
Relevance error: Relevance error The differences between ideal measurement of attributes sought about an object and the operational measures used to collect it in each source data set. Timing differences A conceptual discrepancy in the timing of the measurement of attributes between the target linked data and the source data. |
| Coverage error: Coverage error Objects are not linked due to discrepancies in the coverage of objects between data sources. Timing differences The difference between observed objects in source data sets due to the data being captured at different times. Linkage error Errors arising from linking objects together incorrectly (false positive error) and failing to link objects together that should have been linked (false negative error). |
Mapping error: Definitional differences The differences between how attributes are operationally measured in each of the source data sets. Timing differences The differences between the values of attributes for a linked object between source data sets caused by the data being captured at different times. |
| Identification error: Linkage selection error (bias) Errors arising from the selection of linked objects (or de-selection of unlinked objects) due to biases in the linkage, or through error in the resolution of conflicting links. |
Comparability error: Alignment error Errors arising from the alignment of the conflicting values of attributes across sources. |
| Processing error: Imputation error Errors arising from the imputation of missing objects. Filtering error Errors arising from the selection or de-selection of accessed objects to an ideal target set. |
Processing error: Editing error Errors arising from editing the value of an attribute. This could include editing as a result of validation or QA checks. Imputation error Errors arising from the imputation of missing attribute values. Classification error Errors arising from classification of values into groups or derivation of new attributes. Harmonisation error Errors arising from the harmonisation of values of attributes to an ideal or target concept. |
| Attrition The loss of research objects or units over time. Occurs naturally, through death (or an unobserved migration). Also occurs through failure of follow-up, a refusal to take part, in the case of survey data, or through missing information or linkage failure, in administrative sources. |
Censoring Where the value of a measurement or observation is only partially known. Right censoring is when the research object drops out of the data before the end of the observation window or does not experience the event of interest during the observation window. Left censoring is when the event of interest has already occurred, before the observation window begins. |
| Periodicity/seasonality error Objects are not observed because the data capture is not frequent enough (periodicity) nor adequate to capture seasonality in the data (seasonality). |
Periodicity/seasonality error Measurement of attributes over time are not frequent enough (periodicity) nor adequate to capture seasonality in the data (seasonality). |
Table 3: Multiple source errors
-
The Office for National Statistics published admin-based population estimates for years 2011 and 2016 in June 2019, for more details see the ABPE v3 publication ↩
-
At the time of the 2011 Census there were 349 local authorities in England and Wales ↩