Gender pay gap employer understanding and actions 2019
Published 22 December 2020

© Crown copyright 2020
This publication is licensed under the terms of the Open Government Licence v3.0 except where otherwise stated. To view this licence, visit nationalarchives.gov.uk/doc/open-government-licence/version/3 or write to the Information Policy Team, The National Archives, Kew, London TW9 4DU, or email: psi@nationalarchives.gov.uk.
Where we have identified any third party copyright information you will need to obtain permission from the copyright holders concerned.
This publication is available at https://www.gov.uk/government/publications/gender-pay-gap-employers-action-and-understanding-2019/gender-pay-gap-employer-understanding-and-actions-2019
Employers’ Understanding of the Gender Pay Gap and Actions to Tackle it
Research Report on the 2019 Survey
James Murray, Paul Rieger and Hannah Gorry – OMB Research
January 2020
Note: Most of the figures in this report have been converted into data tables. This is to make them accessible to as many people as possible, including people using screen readers and other assistive technologies. We have kept the original figure titles as they are often referred to elsewhere in the report.
1. Executive summary
1.1 Introduction
The government has introduced gender pay gap (GPG) transparency regulations[footnote 1] which are designed to encourage large employers to take informed action to close their GPG where one exists. These regulations came into force in April 2017 and affect around 10,000 employers across the private, voluntary and public sectors.
This report provides results from the 2019 research which was conducted shortly after the deadline for employers to publish their second set of GPG data. The survey covered large employers’ understanding of the GPG, their experiences of complying with the regulations, and the actions they were taking to close their GPG (or ensure one did not develop). It followed on from previous surveys in 2017 and 2018. Where available, comparative results have been provided from these earlier surveys to track any changes over time.
This research consisted of a telephone survey of 900 large employers (with 250 or more staff), and 32 follow-up qualitative interviews to explore the key issues in more detail. It took place between June and September 2019.
1.2 Understanding of the GPG
Understanding of the GPG has continued to rise. Overall, 89% of respondents (typically senior HR staff) felt they had a good understanding of what the GPG is and how it is calculated, up from 82% in 2018 and 48% in 2017 (when the survey was conducted shortly before large employers had to report their GPG data for the first time). Most of the remainder described themselves as having a reasonable understanding but were not sure of the specifics.
In most cases respondents were reasonably confident that this knowledge extended to the top levels of their organisation. Over a quarter (28%) believed their board/leadership team had a very good understanding of the GPG and approaching two-thirds (63%) felt they had a fairly good understanding. Again, this has improved over time, particularly since the 2017 baseline survey when just 71% judged their leadership team to have a very or fairly good understanding of the issue (compared to 91% currently).
1.3 Experiences of the regulations
Most of the surveyed employers (88%) chose to publish their 2018 GPG data on the official government portal in March 2019 (in the month before the deadline). Two-thirds of this group (69%) stated that they had always intended to publish their results relatively late on, compared with 28% who planned to publish earlier but had been delayed.
Among those who always intended to publish in March or later, the primary reason was simply that they had worked towards the statutory deadline as there was no requirement to publish earlier (mentioned by 49% of this group). Others had intentionally aimed for March publication to allow time to gather, analyse and check the data (21%). A significant proportion gave more strategic reasons such as fitting in with other business priorities (20%) or integrating the reporting into their wider business cycle (10%).
Among those who had hoped to publish earlier, the most common causes of delays included staffing/resource issues (25%) and the emergence of more urgent business priorities (20%). Others explained that it took longer than expected to complete the associated tasks, such as gathering the data (15%), running the analysis (18%) or obtaining internal sign-off (19%).
The vast majority (89%) obtained internal sign-off from their leadership team prior to publishing and over half (58%) had also used the GPG viewing service to review results from other organisations. However, in each case this represents a fall from the levels seen in the 2018 survey. The qualitative interviews suggested that some employers are less concerned now that the reporting process has become more established and/or they are more familiar with the likely level of their GPG.
When asked to rate the overall ease of complying with the GPG reporting regulations, over half of respondents (56%) judged it to be very or fairly straightforward. Only 15% found the process difficult, with the remainder describing it as neither difficult nor straightforward (28%). In terms of the individual tasks involved, the greatest challenge was felt to be gathering the necessary data, with only 53% finding this straightforward and 20% experiencing difficulties. In comparison, 88% found it straightforward to submit their results on the portal, 70% to understand what they were required to do and 61% to calculate their results.
The survey provided strong evidence that employers found the compliance process easier second time around. The proportion judging the overall process to have been straightforward increased from 35% in the 2018 survey (conducted shortly after the deadline for the first year of GPG reporting) to 56% in the 2019 survey. There were similar increases for all of the individual aspects of the GPG requirement (understanding what they had to do, gathering the data, calculating their results, submitting their results).
A third of respondents (31%) offered specific suggestions for how GEO could make the reporting process easier or quicker in the future. These most commonly related to either improving the clarity of the existing guidance (11%) or providing more information on how to deal with specific circumstances such as bonuses, non-standard working arrangements or salary sacrifice (8%).
1.4 GPG engagement and communication
As seen in the 2018 survey, most respondents believed that the requirement to measure and report their GPG data had resulted in a greater engagement with the issue at senior-level within their organisation over the last year. Around two-thirds agreed that it had increased awareness of gender pay issues at board level (70%) and prompted board-level discussion or conversation about their GPG (63%). Approaching half (47%) also reported that this had resulted in the board taking action to address their GPG in the last year. However, actions were not always driven by the board. Some employers had taken steps to address their GPG without these actions being instigated by their senior leadership team.
The larger the employer the more likely they were to report each of these impacts, and they were also more prevalent within public/voluntary sector organisations and among those with a higher GPG.
Furthermore, the majority (57%) believed that the GPG reporting had provided a platform for increased focus on wider equality and diversity within their organisation. The qualitative interviews explored this further. In most cases they identified an indirect impact of the regulations, whereby employers’ recognition of equality and diversity as an increasingly important and relevant topic had been heightened by the publicity surrounding the reporting of the GPG results. However, a minority described a more direct influence, where the need to report a GPG figure and subsequently consider ways of reducing had led to board-level consideration of their wider equality and diversity practices/policies.
While senior-level engagement with the GPG was common, most organisations reported that there had been little response to their latest GPG results among their employees (consistent with the results seen in the 2018 survey). Overall 81% said there had been little or no staff reaction, 16% indicated there had been some (but not widespread) attention paid to their results and only 2% reported widespread reaction. Even among those with a high GPG of over 20% just 3% reported widespread staff reaction.
This may be linked to employers typically doing little to communicate their results to staff. Just 15% had adopted a comprehensive and active staff engagement strategy, 52% had drawn their attention to it but nothing further, and 31% had done no promotion at all. However, the likelihood of adopting a comprehensive staff engagement strategy increased with the size of the employer’s GPG, rising to 25% among those with a GPG in excess of 20%.
1.5 Reducing the GPG
Priority
Employer attitudes to reducing the GPG varied widely, with 23% allocating it a high priority, 38% a medium priority and 35% a low or non-priority. There has been little change in this regard since the regulations came into force, with the current results almost identical to those seen in the 2017 baseline survey.
The larger an employer’s GPG, the more likely they were to treat it as a high or medium priority (ranging from 66% of those with a GPG in excess of 20%, down to 47% of those with a GPG of up to 5%). However, those organisations that did not have a GPG at all were also most likely to allocate a high or medium priority to maintaining this situation (66%).
Within the qualitative sample, the introduction of the regulations was generally said to have increased the priority afforded to closing the GPG (and in most cases employers had not measured or seriously considered their GPG before this). However, most reported little or no change in priority in the period since the regulations came into force, either because the underlying factors affecting this had not changed or because the initial plans they had put in place around reducing their GPG were long-term in nature and therefore required a consistent level of commitment. A minority indicated that priority had increased as a result of seeing their GPG widen and/or finding out that it was higher than expected. Conversely, a small number reported that engagement had dipped following an initial ‘spike’ of interest when the regulations were first introduced (although this had not led to a reduction in the importance placed on equality and diversity more widely).
Those treating their GPG as a high priority were typically driven by a desire to do the right thing and be fair/non-discriminatory (64%). Around a quarter (23%) felt that diversity was good for their business (in terms of profitability, productivity, staff engagement) and the same proportion (23%) highlighted the potential impact on their reputation as a motivating factor.
Employers who saw their GPG as a medium priority gave a wide range of reasons, covering both motivations and barriers. The most common positive driver was that addressing their GPG was felt to be the right thing to do (22%), and 15% also explained that it was not a greater priority because they either did not have a GPG or only had a small GPG. However, a quarter (26%) believed there was little or nothing they could do (for example, due to the nature of their sector or a lack of female applicants), 15% referenced other more important priorities and 13% highlighted that the GPG was a long-term issue that would take time to solve.
Among those who viewed their GPG as a low or non-priority, the most common reason was that they believed there was little or nothing they could to about it (40%). Most of the remainder had little desire to address their GPG. 17% indicated that decisions on who to employ and how much to pay were based on ability not gender, 17% referenced more important priorities, and 10% did not see the GPG as important or relevant. However, a quarter (25%) believed did not need to prioritise it because they did not have a GPG or only had a small GPG.
Most employers interviewed in the qualitative phase were not able to easily identify anything which might spur them to increase the priority placed on addressing their GPG. This was typically because they felt they were already doing enough in this area or because they attributed their GPG to wider societal or cultural issues which they saw as outside their control. Some felt that it was more important for the government to take action at a broader level to address the underlying causes of the GPG, rather than attempting to encourage or facilitate individual employers to do more. However, a minority felt that providing information which demonstrated the commercial benefits of reducing the GPG could increase engagement among their senior management.
Diagnosis
Three-quarters (76%) of employers that had a GPG had tried to identify or diagnose the underlying causes of this. This proportion increased with employer size, ranging from 70% of those with 250 to 499 staff to 86% of those with 1,000 or more staff. These results were consistent with those seen in the 2018 survey.
The qualitative interviews found that, irrespective of whether they had undertaken any formal diagnosis, employers generally felt that they understood the causes of their GPG (although the depth of understanding varied). In some cases, this had deterred them from carrying out any diagnosis. While some employers were motivated to investigate the causes of their GPG in order to understand and help address any potentially unfair practices, others were instead driven by a desire to explain/justify their GPG figure and avoid reputational damage.
Employers typically adopted a range of approaches to diagnosis. The most common involved examining the gender balance in their organisation in different areas (91%) and how salaries and bonuses differed by gender within broadly comparable roles (87%). The majority had also looked at the number of part time workers by grade/occupation (76%) and their application, recruitment and promotion rates by gender (66%).
However, the qualitative findings show that most employers had adopted a relatively cursory and narrow approach to diagnosis, with analysis limited to their GPG data rather than incorporating other complementary data sources. Furthermore, employers rarely reported a direct link between this diagnosis and the development of specific, dedicated actions to close their GPG. Rather they felt that by diagnosing the causes of their GPG, they were able to reassure themselves that they were not inadvertently treating women unfairly and, in some cases, confirm that their existing actions to address it were appropriate.
Most employers in the qualitative sample felt that it had been relatively straightforward to both undertake the diagnosis and interpret the resulting data. However, this was to some extent a reflection of the cursory nature of this activity. The ease of the process also differed depending on the size/complexity of their workforce, the functionality/range of their internal systems, and the availability of experienced/qualified staff.
While most surveyed employers had attempted to diagnose the causes of their GPG, only a quarter (26%) had referred to the GEO guidance on this topic. Furthermore, the qualitative interviews found that the guidance was generally regarded as too general, lacking concrete examples or clear direction, and not providing anything new.
Complementary information
The vast majority (88%) of employers had produced some form of complementary information about their GPG, in addition to simply publishing the data required by the regulations. In most cases this included an explanation of the reasons for their GPG (73%). Around half had produced details of how their GPG had changed over time (53%), information on their wider diversity activity (51%), more detailed analysis of their GPG data (46%) and information on the legal requirements and the difference between GPG and equal pay law (46%).
In addition to contextual information, half of employers (50%) had produced details of the actions they had developed or implemented to address their GPG. This proportion increased among larger organisations (ranging from 39% of those with 250 to 499 staff to 63% of those with 1,000 or more staff) and public/voluntary sector employers (62% compared with 46% for the private sector).
Employers who had a GPG were significantly more likely to have produced complementary information on the topic, and there was generally a correlation between this and the size of their GPG. This pattern was particularly evident when it came to actions to address their GPG. 68% of those with a high GPG of over 20% had developed any actions compared to 28% of those with a zero or negative GPG.
The qualitative interviews uncovered a range of reasons for not developing GPG actions. In some cases, this was simply because they did not have a GPG or felt it was small enough not to be a concern. Others did not think there was anything they could do to reduce their GPG, highlighted more important business priorities or had insufficient resources to do so. A minority expressed reservations about the GPG measure itself and did not feel that it accurately reflected their approach to equality and diversity.
In most cases where employers produced complementary GPG information this was made available to the wider public. Three-quarters (73%) of all surveyed employers had externally published at least some additional information. More specifically, a third (35%) had published details of the actions they had developed to address their GPG.
Among those who had developed any GPG actions, 50% had published the same (or more) detail as in their internal plans/documents, 19% had published less detail (a summary or abbreviated version) and 29% had not published these externally at all.
Actions
Many of the GPG actions taken by employers focussed on staff working practices, with 44% offering or promoting flexible working (for example, part time, home working, job sharing) and 36% promoting shared parental leave policies. Others concentrated on the organisation’s HR practices, such as reviewing their existing policies (40%) and improving or altering their recruitment (37%) or promotion (27%) processes. Training also featured heavily, with 30% introducing or continuing mandatory unconscious bias training and 37% introducing or improving other equality and diversity training.
The qualitative interviews found that these actions were usually not developed specifically or exclusively to address their GPG. Rather, most employers described actions which they had implemented to provide a fair and equitable working environment. These actions had often been introduced prior to the GPG regulations, but many employers had subsequently refined and amended them in light of their GPG results. However, there were also cases where employers had introduced new, specific actions as a direct result of the increased focus on the GPG.
A variety of approaches were reported in the qualitative interviews when it came to developing GPG actions. In most cases, a relatively informal process was described with actions developed over a period of time through discussion between senior management and HR. Although less common, some employers (usually larger and/or public sector) had adopted a more considered, staged approach, sometimes directly based on detailed analysis and diagnosis of their GPG.
The degree to which actions to tackle the GPG had been reviewed and amended since employers had first measured their GPG varied. Most employers in the qualitative sample felt that tackling the GPG was a long-term goal, requiring long-term policies, and they did not consider it necessary to formally review or change these policies regularly. Instead, they explained that the actions they had in place would be amended as and when necessary.
The vast majority of surveyed employers who had developed GPG actions had allocated overall accountability for ensuring these happened to a member of the senior management team (89%). They were somewhat less likely to have tasked a specific individual/team with implementing each one (72%) and less than half had incorporated specific timescales for when each action must be implemented (46%). Three-quarters (75%) had a process to formally review the relevance of the actions and assess whether further actions were required, but formal processes to evaluate their impact on the organisation’s GPG were less widespread (58%).
Almost a quarter of employers (23%) had referred to the GEO guidance on producing an action plan, rising to 34% of those who had already developed any actions to address their GPG. The qualitative interviews found that most employers instead referred to the GPG reports, commentaries and action plans produced by other organisations, which provided them with specific examples of relevant actions.
Among those in the qualitative sample who had seen it, the GEO guidance was often described as clear and well laid out. However, perceptions were typically negative when it came to the content, with most finding it too general and lacking specific details about concrete actions they could take.
Expectations
Approaching half (44%) of employers believed their median GPG would improve over the next 5 years, although few expected a significant improvement (4%). Just 3% anticipated that it would get worse. Expectations were more positive when focussing on the longer-term outlook. 54% expected their GPG to improve over the next 10 years, with 15% predicting significant improvement.
The higher the employer’s current GPG, the more positive they were that this would narrow in future. Among those with a high GPG (greater than 20%), 62% expected it to improve over the next 5 years, and 71% over the next 10 years. Those who had developed actions to address their GPG were also more likely to anticipate that it would improve (58% over the next 5 years and 72% over the next 10 years).
The qualitative interviews found a strong consensus that reducing the GPG is a long-term project for both individual employers and the UK as a whole. Many employers felt that they were not in full control of whether their GPG would close, due to the wide range of contributory factors.
When asked what would help them close their GPG, few employers in the qualitative sample suggested (further) government guidance or advice. Instead, many felt that the government should focus its resources on addressing the underlying, societal issues which contribute to the GPG.
1.6 Future GPG measurement and reporting
The survey results indicate that many employers will continue to work towards the regulatory deadline rather than choosing to publish earlier. The majority of employers (73%) did not plan to publish their next set of GPG data until the final quarter of the reporting period (January 2020 or later). More specifically, a third (32%) only intended to publish in the week before the deadline (late March 2020).
When asked their views on the metrics that they were required to report, the large majority felt that the proportion of women in each pay quartile was very or fairly useful (84%). Over two-thirds (69%) found the differences in mean/median hourly rate useful but there was less consensus on the metrics relating to bonuses. 57% felt the proportion paid bonuses was useful and 50% found the differences in mean/median bonus pay useful. There was little change from the 2018 survey in this regard.
1.7 Conclusions
Compliance with the GPG regulations has become easier and less burdensome as employers are now more familiar with the requirements and have established processes in place. The impact of the regulations on understanding of the GPG has also continued, and almost all of those responsible for their organisation’s GPG reporting now have good knowledge.
The GPG engagement levels reported in 2018 have been sustained, and the regulations have also contributed to increased engagement with wider equality and diversity issues. However, not all employers are striving to diagnose and address their GPG, with some primarily focussed on explaining and justifying their results. This situation is relatively static, and changes in underlying attitudes are rare.
Half of employers have developed any actions to close their GPG, and there are signs that this has increased over the last year. It should be noted that some employers do not have a GPG and therefore have little need to take action. Among those with a GPG of over 5%, the proportion developing actions rose to 60%. Where actions have been taken, these are often connected to wider priorities around equality and diversity (where addressing the GPG is just one of a number of objectives), and the implementation of dedicated, GPG-specific actions remains uncommon.
Employers typically feel that they are already placing an appropriate level of priority on the GPG (and doing all they can to address it). Many believe that the government should focus on addressing the wider societal and cultural drivers of the GPG rather than encouraging/facilitating employers to do more.
However, there is evidence that not all employers understand what they could or should be doing to address their GPG, so there is still a role for appropriate guidance (which needs to be as specific as possible and include concrete examples of how employers can make a difference).
2. Introduction
This report details the findings from a study carried out by OMB Research, commissioned by the Government Equalities Office (GEO). The research provides evidence on large employers’ understanding of the gender pay gap (GPG), their experiences of complying with the GPG transparency regulations, and the actions they are taking to close their GPG (or ensure that one does not develop).
The research used both quantitative and qualitative methods and was conducted between June and September 2019.
2.1 Background
The government has committed to closing the gender pay gap. The GPG is an overall measure which reflects differences in median[footnote 2] hourly earnings and labour market participation by gender. Currently the overall gender pay gap for all employees is 17.9%, the lowest since records began.[footnote 3]
New regulations introducing mandatory gender pay gap reporting for large employers aim to encourage employers to take informed action to close their GPG where there is one. These regulations came into force in April 2017 and require private and voluntary sector organisations with 250 or more employees to publish GPG statistics every year.[footnote 4] The same requirements have been introduced for public sector organisations in England (and non-devolved authorities operating across England, Scotland and Wales) by amending the Specific Duties regulations made under Section 153 of the Equality Act 2010.
The Government Equalities Office (GEO) commissioned OMB Research to develop a robust research programme to measure large employers’ understanding of the GPG, understand their experiences of complying with the transparency regulations, and identify the actions they are taking to close their GPG (or ensure that one does not develop).
This report provides results from the 2019 survey, which followed on from an initial baseline survey in 2017 and a further survey in 2018.[footnote 5] Comparative results from these previous surveys have been provided where available to identify any changes over time.
The primary aims of the 2019 research were:
- to provide insight on employers’ understanding of the GPG, covering both HR and board-level staff
- to understand employers’ experiences of complying with the regulations, including how and when they published their statistics, how easy or difficult they found the process, and any impact on board-level awareness and actions
- to gather detail on the level of priority employers allocate to reducing their GPG, the extent to which they have attempted to diagnose the causes of their GPG, the actions they are taking (or planning) to address it, and the success of any such actions to date
- to understand the perceived barriers to taking action
The research took place between late June and early September 2019, so around 3 to 4 months after the deadline for employers to publish their 2018 GPG data.
2.2 Methodology
The research consisted of a quantitative survey of large employers, supplemented by qualitative in-depth interviews with a selection of those who participated in the main survey.
Quantitative survey
Telephone interviews were conducted with 900 large employers between 17 June and 6 August 2019, and covered private, voluntary and public sector organisations with 250 or more employees. These interviews lasted an average of 21 minutes and were conducted with HR directors/managers or other senior staff who confirmed they had responsibility for dealing with their organisation’s response to the GPG transparency regulations.
The sample frame consisted of all employers that had reported their 2018 GPG data on the government portal as of the 4 June 2019.[footnote 6] However, this list contained some employers that were out of scope for the research (for example, those with fewer than 250 employees who chose to voluntarily report their GPG results). All such employers were removed, and the final sample therefore consisted solely of organisations that were subject to the GPG transparency regulations.
The portal data identified those employers classified as public sector for the purposes of the GPG legislation. However, all other employers were classified on the portal as private sector, with no separate identification of voluntary sector organisations. The sample was therefore matched against databases of registered charities and social non-profit companies held by the Charity Commission, the Scottish Charity Regulator (OSCR) and the National Council for Voluntary Organisations (NCVO) to identify voluntary sector employers.
Interlocking quotas were set on sector and size band to ensure good coverage of the large employer population. While these quotas were largely representative of the target population, the voluntary and public sectors were over-sampled to allow robust sub-analysis. For example, public sector organisations account for 16% of the in-scope universe but made up 30% of the interviews conducted. This resulted in statistical confidence intervals of ±4.8% for the private sector, ±5.5% for the voluntary sector and ±5.5% for the public sector.[footnote 7] Table 1 sets out the profile of all in-scope employers in the sample frame along with the profile of the achieved interviews.
Table 1: Universe and achieved interviews by sector and size
| Sector | Size | Universe (in-scope): Number | Universe (in-scope):: % | Interviews: Number | Interviews: % |
|---|---|---|---|---|---|
| Private | 250 to 499 employees | 3,599 | 35% | 185 | 21% |
| Private | 500 to 999 employees | 2,029 | 20% | 104 | 12% |
| Private | 1,000 or more employees | 1,961 | 19% | 101 | 11% |
| Private | Sub-total: Private | 7,589 | 74% | 390 | 43% |
| Voluntary | 250 to 499 employees | 593 | 6% | 139 | 15% |
| Voluntary | 500 to 999 employees | 265 | 3% | 62 | 7% |
| Voluntary | 1,000 or more employees | 182 | 2% | 43 | 5% |
| Voluntary | Sub-total: Voluntary | 1,040 | 10% | 244 | 27% |
| Public | 250 to 499 employees | 590 | 6% | 97 | 11% |
| Public | 500 to 999 employees | 336 | 3% | 55 | 6% |
| Public | 1,000 or more employees | 692 | 7% | 114 | 13% |
| Public | Sub-total: Public | 1,618 | 16% | 266 | 30% |
| Total | 10,247 | 100% | 900 | 100% |
To account for the disproportionate sampling approach and ensure the research results were representative, the final survey data was then weighted back to the true sector and size profile of all large GB employers subject to the regulations (as per the in-scope universe detailed above).
To provide representative coverage of the full range of different private sector employers, additional sub-quotas were set on Standard Industrial Classification (SIC) code for this group.
The sample drawn from the GPG portal did not include telephone numbers, and these were identified and appended via a combination of automated and manual searches. In some cases, several organisations in the sample shared the same contact details (for example, where the GPG results were reported separately for different subsidiaries but the same individual was responsible in each case). The sample was therefore de-duplicated to ensure that each employer/individual only appeared once, to avoid burdening them with multiple research requests.
Qualitative depth interviews
In addition to the main survey, a total of 32 qualitative follow-up interviews were completed between 1 July and 9 September 2019. These in-depth interviews were conducted by telephone and lasted an average of 30 minutes.
The sample consisted of 2 different groups:
- Longitudinal sample: 13 interviews were conducted with employers who were also interviewed in the equivalent qualitative phases of the 2017 and/or 2018 research, allowing a detailed analysis of how their views and plans had developed over time.
- Fresh sample: 19 interviews were conducted with employers who were interviewed in the 2019 quantitative survey.
In each case, these respondents had previously given consent to be contacted for follow-up research on the GPG for GEO.
Interlocking quotas were set on business size and sector, and the achieved interview profile is set out in Table 2.
Table 2: Qualitative interviews by employer sector and size
| Size (employees): 250 to 499 | Size (employees): 500 to 999 | Size (employees): 1,000 or more | Total | |
|---|---|---|---|---|
| Private sector | 8 | 6 | 7 | 21 |
| Voluntary sector | 2 | 2 | 2 | 6 |
| Public sector | 1 | 2 | 2 | 5 |
| Total | 11 | 10 | 11 | 32 |
Further quotas were set based on the size of each employer’s GPG, based on the data reported on the government portal for 2018. These quotas were intentionally skewed towards employers that had a larger GPG (greater than 5%) in order to better understand the actions taken by these organisations. The achieved interviews were distributed as follows:
- Median GPG of 20% or more: 10 interviews
- Median GPG of 6% to 19%: 16 interviews
- Median GPG of less than 6% (including no GPG): 6 interviews
As far as possible within the constraints of the above quotas, the qualitative sample was also structured to provide a good spread of employers by SIC code, level of priority allocated to addressing their GPG, and whether or not they had developed actions to address their GPG.
2.3 Analysis and reporting conventions
This report contains findings from both the quantitative survey and the qualitative follow-up interviews. Where results are based on the qualitative data, this is clearly identified.
Quantitative reporting
Throughout this report, references to ‘all employers’ and the ‘total’ columns in the charts and tables refer only to the employer population sampled for the survey (GB private, public and voluntary sector organisations with 250 or more employees who reported their 2018 GPG data on the government portal).
Unless explicitly noted, all quantitative findings are based on weighted data. Unweighted bases (the number of responses from which the findings are derived) are displayed on tables and charts as appropriate to give an indication of the robustness of results.
The quantitative data presented in this report is from a sample of large employers rather than the total population. This means the results are subject to sampling error. Differences between sub- groups and changes over time are commented on only if they are statistically significant at the 95% confidence level (unless otherwise stated). This means that there is at least a 95% probability that any reported differences are real and not a consequence of sampling error.[footnote 8]
When interpreting the data presented in this report, please note that results may not sum to 100% due to rounding and/or respondents being able to select more than one answer to a question.
Where relevant, this report contains analysis of the survey results by the size of employers’ median GPG. This analysis is based on the 2018 figures published by each organisation on the government portal (which were confirmed during the survey).
Qualitative reporting
The qualitative phase of the research was based on interviews with a small sample of employers (32 interviews). Although the weight of opinion has sometimes been provided for clarity and transparency, these findings should be treated as indicative and cannot necessarily be extrapolated to the wider population.
Direct quotations have been provided as illustrative examples. However, in some cases these have been abbreviated and/or paraphrased for the sake of brevity and comprehension (without altering the original sense of the quote).
3. Understanding of the GPG
This chapter explores employers’ awareness and understanding of the gender pay gap. More specifically, it covers understanding of:
- what the GPG refers to and how it’s calculated
- the difference between closing the GPG and ensuring equal pay between men and women
3.1 Respondent understanding of the GPG
Overall, 89% of respondents felt they had a good understanding of what the GPG is and how it is calculated (Figure 1). Most of the remainder (10%) believed they had a reasonable understanding.[footnote 9]
Figure 1: Self-reported understanding of the GPG
| Limited understanding of what it refers to | Reasonable understanding but not how it’s calculated | Good understanding of what it is and how it is calculated | |
|---|---|---|---|
| Total | 0% | 10% | 89% |
| Private sector | 0% | 10% | 90% |
| Public and voluntary sector | 0% | 12% | 88% |
| 250 to 499 employees | 0% | 12% | 88% |
| 500 to 999 employees | 1% | 11% | 88% |
| 1,000 or more employees | 0% | 7% | 93% |
Base: all respondents (Base, Don’t know). Total (900, 0%). Private (390, 0%), public and voluntary (510, 0%). 250 to 499 employees (421, 0%), 500 to 999 (221, 0%), 1,000 or more (258, 0%)
There were no statistically significant differences by sector, but respondents from larger employers of 1,000 or more staff were more likely to have a good understanding of the GPG (93% compared with 88% of respondents from organisations with fewer than 1,000 staff).
Figure 2 shows that understanding of the GPG has continued to improve. The proportion with a good understanding increased from 48% in 2017 to 82% in 2018 and 89% in 2019. The greatest increase was seen between the 2017 survey (conducted after the transparency regulations came into force but before the deadline for employers to publish their first set of GPG data) and the 2018 survey (conducted shortly after the deadline for reporting their first year of GPG data). This pattern was evident across all sectors and employer sizes.
Figure 2: Proportion reporting a good understanding of the GPG (over time)
| 2017 survey | 2018 survey | 2019 survey | |
|---|---|---|---|
| Total | 48% | 82% | 89% |
| Private sector | 47% | 81% | 90% |
| Public and voluntary sector | 53% | 85% | 88% |
| 250 to 499 employees | 43% | 80% | 88% |
| 500 to 999 employees | 47% | 83% | 88% |
| 1,000 or more employees | 60% | 85% | 93% |
Base: all respondents (2017, 2018, 2019). Total (900, 900, 900). Private (406, 391, 390), public and voluntary (494, 509, 510). 250 to 499 employees (412, 391, 421), 500 to 999 (214, 236, 221), 1,000 or more (274, 273, 258)
Findings from the qualitative interviews support the survey evidence of increased understanding of the GPG. Some respondents explained that the process of calculating and reporting their data had led to greater engagement with, and clarity about, the topic.
“In the early days we would have confused GPG with equal pay. Before the reporting, it was not often talked about.” (1,000 or more, Voluntary Sector)
3.2 Difference between GPG and equal pay
The above data refers to respondents’ own perceptions of their understanding. To explore their knowledge in more detail, they were provided with 3 different scenarios and asked to indicate whether each one referred to a breach of equal pay law, a GPG issue (but not a breach of equal pay law) or neither. The scenarios were as follows:
-
A company where there is a difference in the average annual pay of men and women just because more women work part time.
-
A company where there is a difference in the average hourly pay of men and women because women work in less senior roles.
-
A company where men and women are paid a different hourly rate for doing the same job.
As set out in Figure 3 below, 89% of respondents correctly identified that scenario 3 referred to a breach of equal pay law and 81% correctly identified that scenario 2 referred to a GPG issue. This suggests that most of those responsible for their organisation’s GPG reporting have a clear understanding of what constitutes a breach of equal pay law and what constitutes a GPG issue.
However, there was less consensus on scenario 1 and only 27% of respondents correctly identified that this was neither a breach of equal pay law nor a GPG issue. Most of the remainder (61% of all respondents) believed that this was a GPG issue.
Figure 3: Scenarios to explore understanding of the difference between GPG issues and breaches of equal pay law
| Breach of equal pay law | GPG issue | Neither | Don’t know | |
|---|---|---|---|---|
| Scenario 1: A company where there is a difference in the average annual pay of men and women just because more women work part time | 9% | 61% | 27% | 4% |
| Scenario 2: A company where there is a difference in the average hourly pay of men and women because women work in less senior roles | 5% | 81% | 11% | 3% |
| Scenario 3: A company where men and women are paid a different hourly rate for doing the same job | 89% | 9% | 1% | 1% |
Base: all respondents (900)
In comparison to the 2018 survey, there was no change in the proportion of respondents selecting the correct answer at scenarios 2 and 3. However, the proportion identifying scenario 1 as neither a breach of equal pay law nor a GPG issue has fallen (from 40% in 2018 to 27% in 2019).
While this might imply that detailed knowledge of the GPG has reduced, there could be other reasons for the comparatively low proportion selecting the correct answer at this scenario. These scenarios were relatively difficult to assess during a telephone interview due to the amount of information needing to be retained and the subtle nuances of each one, and scenario 1 may also be affected by a human nature bias whereby respondents are drawn to select a definitive answer rather than the ‘neither’ option. Furthermore, some respondents may have classified scenario 1 as a GPG issue because they interpreted the higher proportion of women in part time roles as an underlying cause of the GPG (for example, if this limits their potential for promotion/higher pay). Finally, there was also a minor wording change to scenario 1 in 2019 (changing ‘more women work fewer hours’ to ‘more women work part time’) which could have contributed to the fall in the proportion selecting the correct response.
Respondents from public and voluntary sector organisations were slightly more likely than their private sector counterparts to know that scenario 2 was a GPG issue (85% compared with 80%) and scenario 3 was a breach of equal pay law (94% compared with 87%). In contrast, private sector respondents were most likely to correctly identify that scenario 1 was neither a breach of equal pay law nor a GPG issue (29% compared with 18% of those from the public or voluntary sectors).
Respondents were also asked to assess their leadership team or board’s understanding of the gender pay gap and the difference between this and equal pay (Figure 4). Over a quarter (28%) felt that this group had a very good understanding, with two-thirds (63%) describing it as fairly good.
Figure 4: Leadership team’s perceived understanding of the GPG and the difference from equal pay
| Very poor understanding | Fairly poor understanding | Fairly good understanding | Very good understanding | |
|---|---|---|---|---|
| Total | 1% | 8% | 63% | 28% |
| Private sector | 1% | 8% | 64% | 26% |
| Public and voluntary sector | 1% | 5% | 60% | 33% |
| 250 to 499 employees | 1% | 8% | 67% | 23% |
| 500 to 999 employees | 2% | 10% | 56% | 32% |
| 1,000 or more employees | 1% | 4% | 62% | 32% |
Base: all respondents (Base, Don’t know). Total (900, 1%). Private (390, 0%), public and voluntary (510, 2%). 250 to 499 employees (421, 1%), 500 to 999 (221, 0%), 1,000 or more (258, 1%)
The proportion judging their leadership team to have either a very or fairly good understanding of the GPG and how it differs from equal pay was broadly similar across the different sectors and employer sizes (ranging from 88% to 94%). However, respondents from private sector employers and organisations with 250 to 499 staff were comparatively less likely to describe their leadership team as having very good understanding (26% and 23% respectively).
The previous survey data suggested that knowledge of the GPG at senior-level had risen since large employers were required to measure and report their data, with the proportion reporting a very or fairly good understanding increasing from 71% in 2017 to 87% in 2018. As shown in Table 3, perceived understanding has risen again in 2019, but to a lesser extent (up to 91%). This increase over the last year was evident in the private sector (from 85% to 90%) but there was no change among public/voluntary sector employers.
Table 3: Leadership team’s perceived understanding of the GPG and the difference from equal pay (over time)
| Year | Total | Sector: Private | Sector: Public and voluntary | Size: 250 to 499 | Size: 500 to 999 | Size: 1,000 or more | |
|---|---|---|---|---|---|---|---|
| Very or fairly good understanding | 2017 | 71% | 70% | 74% | 68% | 72% | 77% |
| Very or fairly good understanding | 2018 | 87% | 85% | 93% | 86% | 87% | 91% |
| Very or fairly good understanding | 2019 | 91% | 90% | 93% | 90% | 88% | 94% |
Base: All respondents (2017/2018/2019). Total (900/900/900), Private (406/391/390), Public and voluntary (494/509/510), 250 to 499 (412/391/421), 500 to 999 (214/236/221), 1,000 or more (274/273/258)
The qualitative interviews provide additional insight into understanding of the GPG among employers’ leadership teams. Some respondents reported that this was not consistent across their senior staff, with big differences in overall levels of engagement and understanding among different members of their leadership team. In particular, less engaged leaders (those placing a lower priority on closing the GPG) were often also felt to be less clear about the difference between the GPG and equal pay.
“There isn’t an appetite to address the issue…Some directors don’t really understand what GPG is. They see that there isn’t a problem with equal pay, so don’t see why GPG should be any different.” (500 to 999, Private sector)
4. Experiences of the regulations
This chapter looks at employers’ experiences of the second year of the GPG regulations. Specifically, it covers:
- how employers reported their GPG data
- when employers published their results and the reasons for this
- the ease of complying with regulations
- views on how the process could be made easier or quicker in future
For all the survey questions reported in this chapter, employers were asked to focus on their experiences of reporting their 2018 GPG results (Year 2 of the regulations). Where available, comparative results have been provided from the previous annual survey, which focussed on employers’ experiences of reporting their 2017 results (Year 1 of the regulations).
4.1 Reporting of GPG data
As shown in Figure 5, most surveyed employers (91%) published one set of GPG data for their entire organisation.[footnote 10]
Figure 5: Whether GPG results were published separately for different subsidiaries
| Separate GPG data for different subsidiaries | One set of GPG data for whole organisation | |
|---|---|---|
| Total | 8% | 91% |
| Private sector | 9% | 89% |
| Public and voluntary sector | 5% | 95% |
| 250 to 499 employees | 5% | 94% |
| 500 to 999 employees | 6% | 93% |
| 1,000 or more employees | 16% | 83% |
Base: all respondents (Base, Don’t know). Total (900, 1%). Private (390, 1%), public and voluntary (510, 1%). 250 to 499 employees (421, 1%), 500 to 999 (221, 0%), 1,000 or more (258, 1%)
Larger employers with 1,000 or more staff were most likely to have published separate data for different subsidiaries (16%).
The vast majority of employers (89%) obtained internal sign-off from their leadership team or board prior to publishing their latest GPG results (Figure 6). However, this represents a fall from the level seen in the 2018 survey (96%).
Figure 6: Proportion getting internal sign-off from their leadership team or board (over time)
| 2018 survey | 2019 survey | |
|---|---|---|
| Total | 96% | 89% |
| Private sector | 97% | 88% |
| Public and voluntary sector | 95% | 93% |
| 250 to 499 employees | 96% | 85% |
| 500 to 999 employees | 95% | 92% |
| 1,000 or more employees | 98% | 94% |
Base: all respondents (2018, 2019). Total (900, 900). Private (380, 390), public and voluntary (488, 510). 250 to 499 employees (368, 421), 500 to 999 (233, 221), 1,000 or more (267, 258)
Evidence from the qualitative interviews suggests that the lower proportion obtaining senior sign-off on their results is due to increased familiarity with both the reporting requirements and the size of their GPG.
Some respondents noted that their leadership team had become less interested in their GPG results and how they were calculated after the first year of reporting. They described an initial high level of interest (and in some cases concern) when their first set of results was being calculated.
This was usually due to uncertainty over the level of their GPG and the potential public relations impact of a high GPG. However, this level of engagement had always not been sustained in subsequent years, typically because concerns about the size of their GPG and/or the impact of reporting it had diminished.
“Interest in the figures themselves has certainly reduced. There is much less nervous interest among senior managers.” (1,000 or more, Private sector)
Figure 7 shows that a similar picture was seen when it came to use of the GPG viewing service to review results from other organisations. The proportion of employers doing this fell from 73% in 2018 to 58% in 2019.
Figure 7: Proportion using the GPG viewing service (over time)
| 2018 survey | 2019 survey | |
|---|---|---|
| Total | 73% | 58% |
| Private sector | 72% | 56% |
| Public and voluntary sector | 76% | 65% |
| 250 to 499 employees | 71% | 50% |
| 500 to 999 employees | 72% | 60% |
| 1,000 or more employees | 78% | 71% |
Base: all respondents (2018, 2019). Total (900, 900). Private (380, 390), public and voluntary (488, 510). 250 to 499 employees (368, 421), 500 to 999 (233, 221), 1,000 or more (267, 258)
As set out in Table 4, employers who had a GPG were more likely to both obtain sign-off from their leadership team before publication and use the GPG viewing service.
Table 4: Internal sign-off and use of the GPG viewing service (by size of GPG)
| Has a GPG: Yes | Has a GPG: No | Size of GPG: More than 20% | Size of GPG: 11% to 20% | Size of GPG: 6% to 10% | Size of GPG: Less than 6% | |
|---|---|---|---|---|---|---|
| Got internal sign-off from leadership team or board | 91% | 83% | 94% | 90% | 88% | 91% |
| Used GPG viewing service | 62% | 47% | 66% | 66% | 52% | 57% |
Base: All respondents. Has GPG (678), has no GPG (222), more than 20% (229), 11% to 20% (209), 6% to 10% (115) less than 6% (125)
4.2 Timing of publication
The deadline for publishing their 2018 GPG data on the portal was 4 April 2019 for private/voluntary sector employers and 30 March 2019 for public sector employers. Among the surveyed employers, 88% did not publish their final GPG data until March 2019 or later (in the month before the deadline or after the deadline).
As detailed in Figure 8, over two-thirds (69%) of the employers who submitted their GPG results in March 2019 or later indicated that they had always planned to publish around that time (rather than something delaying them).[footnote 11]
Figure 8: Reason for not publishing GPG results until March 2019 or later
| Planned to publish earlier but was delayed | Always planned to publish March 2019 onwards | |
|---|---|---|
| Total | 28% | 69% |
| Private sector | 27% | 70% |
| Public and voluntary sector | 29% | 67% |
| 250 to 499 employees | 26% | 70% |
| 500 to 999 employees | 28% | 69% |
| 1,000 or more employees | 30% | 67% |
Base: all who published in March 2019 or later (Base, Don’t know or can’t remember). Total (726, 3%). Private (326, 3%), public and voluntary (400, 4%). 250 to 499 employees (336, 4%), 500 to 999 (177, 3%), 1,000 or more (213, 3%)
Those employers that had always planned to publish in March 2019 or later were asked why they had decided not to do so earlier (Table 5). This question was asked unprompted and respondents were able to provide multiple reasons.
Table 5: Reasons for intentionally not publishing GPG results until March 2019 or later
| All who planned to publish in March 2019 or later | |
|---|---|
| Just worked towards deadline or no requirement to do it earlier | 49% |
| To allow time to gather or analyse or check the data | 21% |
| Other more important or competing priorities | 20% |
| To fit in with wider business cycle (for example, annual reporting, all companies in the group reporting together) | 10% |
| To allow time to get internal approval or sign off (for example, from senior management/board) | 9% |
| Wanted to see results from other organisations first | 3% |
| Wanted to avoid negative publicity or media attention | 2% |
| Wanted to see how other organisations reported or explained their results | 2% |
| Staffing issues (for example, understaffed, changes in key personnel) | 2% |
| Due to reliance on external parties (for example, payroll or other service providers) | 2% |
| To allow time to produce supporting documentation | 1% |
| Other reasons | 1% |
| Don’t know | 2% |
Base: All who always planned to publish in March 2019 or later (496)
As shown above, half (49%) of the employers who had always planned to publish in March 2019 or later indicated that they had simply worked towards the statutory deadline as there was no requirement to publish earlier. In addition, significant proportions had intentionally aimed for March publication to allow time for key tasks such as gathering, analysing and checking the data (21%) or obtaining internal sign-off (9%). One-fifth (20%) highlighted other more important or competing priorities, and 10% had decided on March to fit in with their wider business cycle.
Those employers that intended to publish before March 2019 but had been delayed were asked what had caused this (Table 6). Again, this question was asked unprompted and respondents were able to provide multiple reasons.
Table 6: Factors that delayed publication of GPG results until March 2019 or later
| All who intended to publish before March 2019 but were delayed | |
|---|---|
| Staffing/resource issues (for example, key staff leaving or unavailable) | 25% |
| Other more urgent priorities | 20% |
| Time taken to get internal approval or sign off (for example, from senior management/board) | 19% |
| Time taken to run the analysis/calculations | 18% |
| Time taken to gather the data | 15% |
| Time taken by 3rd parties to provide the data or analysis (for example, payroll providers, specialist consultants) | 7% |
| Time taken to produce supporting documentation | 6% |
| System changes or issues (for example, payroll software) | 3% |
| Difficulties registering on the portal (for example, PIN issues) | 2% |
| Identified calculation/data errors | 2% |
| Other factors | 6% |
| Don’t know | 2% |
Base: All who planned to publish before March 2019 but were delayed (206)
A quarter of this group (25%) reported that the delay was down to staffing and resource issues and a fifth (20%) indicated that other more urgent priorities had pushed back their GPG reporting. The other most widespread reasons all related to the amount of (unforeseen) time required to complete the various tasks, such as getting internal sign-off (19%), running the analysis (18%), gathering the data (15%), receiving the data from 3rd parties (7%) or producing their supporting documentation (6%).
A minority of the surveyed employers (7%) had modified and resubmitted their GPG results after they first published them. This group were asked why they had needed to do this (Table 7).
Table 7: Reasons for modifying GPG results after first publishing them
| All who modified their data after publishing | |
|---|---|
| Amended or added supporting documentation or narrative commentary | 33% |
| Identified a calculation error or incorrect data themselves | 25% |
| Amended details about their organisation (for example, size, sector, contact details) | 9% |
| Informed by GEO that there was an issue with their data | 6% |
| Don’t know reason | 19% |
| Did not change results or not aware that changed results | 13% |
Base: All who modified and resubmitted their results (65)
Around a third had resubmitted their results because the data was incorrect, with 25% identifying the error themselves and 6% being informed by GEO. A similar proportion (33%) had simply amended or added supporting documentation (for example, a link to their narrative commentary or GPG report) rather than changing their data.
4.3 Ease of complying
Employers were asked to rate the overall process of complying with the GPG reporting regulations on a 5-point scale, where 1 meant it was very difficult and 5 meant it was very straightforward.
Figure 9 shows that while perceptions varied, over half (56%) described it as very or fairly straightforward. Only 15% found the process difficult, with the remainder judging it to have been neither difficult nor straightforward (28%).
Figure 9: Overall ease of complying with the regulations
| Very difficult | Fairly difficult | Neither difficult nor straightforward | Fairly straightforward | Very straightforward | |
|---|---|---|---|---|---|
| Total | 5% | 10% | 28% | 35% | 21% |
| Private sector | 5% | 10% | 29% | 34% | 21% |
| Public and voluntary sector | 3% | 9% | 26% | 40% | 21% |
| 250 to 499 employees | 6% | 10% | 27% | 34% | 22% |
| 500 to 999 employees | 4% | 10% | 29% | 36% | 20% |
| 1,000 or more employees | 3% | 10% | 30% | 36% | 19% |
Base: all respondents (Base, Don’t know). Total (900, 1%). Private (390, 1%), public and voluntary (510, 1%). 250 to 499 employees (421, 1%), 500 to 999 (221, 1%), 1,000 or more (258, 2%)
Public and voluntary sector organisations were slightly more positive about the process, with 61% finding it straightforward (compared with 54% of private sector employers). There was no difference in ease of compliance by employer size.
As shown in Table 8, there is strong evidence that employers found the process easier second time around. The proportion judging it to have been straightforward increased from 35% in the 2018 survey (conducted shortly after the deadline for the first year of GPG reporting) to 56% in the 2019 survey.
Table 8: Overall ease of complying with the regulations (over time)
| Year | Total | Sector: Private | Sector: Public and voluntary | Size: 250 to 499 | Size: 500 to 999 | Size: 1,000 or more | |
|---|---|---|---|---|---|---|---|
| Very or fairly straightforward | 2018 | 35% | 31% | 44% | 33% | 39% | 33% |
| 2019 | 56% | 54% | 61% | 57% | 57% | 54% |
Base: All respondents (2018/2019). Total (868/900), Private (380/390), Public and voluntary (488/510), 250 to 499 (368/421), 500 to 999 (233/221), 1,000 or more (267/258)
Respondents were also asked to rate their experiences of the different tasks involved, using the same 5-point scale (Figure 10).
Figure 10: Ease of completing the different tasks associated with the regulations
| Very difficult | Fairly difficult | Neither difficult nor straightforward | Fairly straightforward | Very straightforward | |
|---|---|---|---|---|---|
| Understanding what you were required to do | 4% | 7% | 19% | 36% | 33% |
| Gathering the necessary data | 5% | 14% | 26% | 34% | 20% |
| Calculating your results | 3% | 11% | 22% | 37% | 24% |
| Submitting your results on the portal | 1% | 2% | 4% | 20% | 68% |
Base: all respondents (Base, Don’t know). Total (900, 1%, 2%, 3%, 5%).
As shown above, the vast majority of employers found it easy to submit their results on the portal, with 88% judging this task to be straightforward (and 68% rating it as very straightforward).
While the feedback was generally still positive, reaction was somewhat more divided for the other tasks. 70% found it straightforward to understand what they were required to do, 61% to calculate their results and 53% to gather the necessary data. Of all the tasks, employers were most likely to report issues with gathering the data, with a fifth (20%) describing this as very or fairly difficult.
As with the overall rating for ease of complying with the GPG regulations, the ease of completing each of the key tasks has improved since the 2018 survey (conducted shortly after the Year 1 reporting deadline). Figure 11 shows that this was most apparent for understanding what they were required to do. Less than half (47%) of employers found this straightforward in the 2018 survey, but this rose to 70% in 2019.
Figure 11: Proportion rating each task as very/fairly straightforward (over time)
| 2018 survey | 2019 survey | |
|---|---|---|
| Understanding what you were required to do | 47% | 70% |
| Gathering the necessary data | 41% | 53% |
| Calculating your results | 53% | 61% |
| Submitting your results on the portal | 81% | 88% |
Base: all respondents. 2018 (868), 2019 (900).
As detailed in Table 9 below, in the 2019 survey private sector organisations were less likely than public and voluntary sector ones to have found each task straightforward. There were no consistent differences by employer size.
Table 9: Ease of completing the different tasks associated with the regulations (by sector and size)
| Proportion finding each task very/fairly straightforward | Sector: Private | Sector: Public and voluntary | Size: 250 to 499 | Size: 500 to 999 | Size: 1,000 or more |
|---|---|---|---|---|---|
| Understanding what you were required to do | 68% | 75% | 67% | 73% | 70% |
| Gathering the necessary data | 52% | 57% | 56% | 55% | 48% |
| Calculating your results | 59% | 67% | 64% | 60% | 58% |
| Submitting your results on the portal | 87% | 93% | 88% | 91% | 86% |
Base: All respondents. Private (390), Public and voluntary (510), 250 to 499 (421), 500 to 999 (221), 1,000 or more (258)
Respondents were asked if they had any specific suggestions for how GEO could help make the reporting process significantly easier or quicker in future (Table 10). Approaching a third (31%) made any such suggestions, and these typically related to either the clarity of the existing guidance (11%) or a need for more information on how to deal with specific circumstances such as bonuses, non-standard working arrangements, part time staff or salary sacrifice (8%).
Table 10: Suggestions for how GEO could help make the reporting process easier or quicker
| Total | |
|---|---|
| Easier to understand or clearer guidance | 11% |
| - Simplify the guidance | 5% |
| - Who to include and exclude | 3% |
| - How to calculate the figures | 2% |
| - Other suggestions on clarity of guidance | 2% |
| More guidance on how to deal with specific circumstances | 8% |
| - Bonuses | 2% |
| - Non-standard working arrangements (for example, term-time only) | 1% |
| - Part time workers | 1% |
| - Salary sacrifice | 1% |
| - Other suggestions on specific circumstances | 5% |
| Change the requirements or calculations | 5% |
| Downloadable software or templates to calculate their GPG results | 2% |
| More or clearer communications about the time-scales required | 2% |
| Case studies or examples or benchmarks from other organisations | 1% |
| Better or improved accessibility to the portal (for example, technical improvements, easier access for different individuals) | 1% |
| Dedicated helpline or point of contact | 1% |
| Training or workshops or seminars or webinars | 1% |
| External checks or reviews of calculations | 1% |
| Other suggestions | 4% |
| No suggestions for how GEO could make process easier/quicker | 69% |
Base: All respondents (900)
There were no notable differences by size or sector when it came to the suggestions provided.
5. GPG engagement and communication
This chapter looks at the response to employers’ latest GPG results among their senior leadership and other staff. Specifically, it covers:
- impact of the regulations on board-level awareness and action
- how GPG results were communicated and the reaction among staff
5.1 Impact of GPG regulations on board-level engagement
Most respondents believed that the requirement to measure and report their GPG data had resulted in a greater engagement with the issue at senior-level within their organisation over the last year.
As detailed in Figure 12 below, around two-thirds agreed that it had increased awareness of gender pay issues at board level (70%) and prompted board-level discussion or conversation about their GPG (63%). Approaching half (47%) reported that it had also resulted in the board taking action to address their GPG in the last year (or, if they had no GPG, to ensure that one did not develop).
The 2019 survey also included a new question to assess whether the requirement to measure and report their GPG data had provided an opportunity or platform for increased focus on wider equality and diversity issues within their organisation. Over half (57%) of surveyed employers agreed that this was the case.
Figure 12: Impact of the regulations on board-level engagement with the GPG over the last year
| Strongly disagree | Disagree | Neither agree nor disagree | Agree | Strongly agree | |
|---|---|---|---|---|---|
| Increased awareness of gender pay issues at board level | 3% | 11% | 16% | 48% | 22% |
| Prompted board level discussion or conversation about your GPG | 3% | 16% | 14% | 44% | 19% |
| Resulted in the board taking action to address your GPG | 5% | 21% | 23% | 39% | 8% |
| Provided an opportunity or platform for increased focus on wider equality and diversity issues | 4% | 17% | 20% | 43% | 15% |
Base: all respondents (Base, Don’t know). Total (900, 1%, 4%, 4%, 1%).
Figure 13 shows that there has been little change in the board-level impacts of the regulations between the first year of reporting (as covered in the 2018 survey) and the second year of reporting (as covered in the 2019 survey).
Figure 13: Proportion agreeing that there was an impact on board-level engagement with the GPG (over time)
| 2018 survey | 2019 survey | |
|---|---|---|
| Increased awareness of gender pay issues at board level | 69% | 70% |
| Prompted board level discussion or conversation about your GPG | 67% | 63% |
| Resulted in the board taking action to address your GPG | 46% | 47% |
| Provided an opportunity or platform for increased focus on wider equality and diversity issues | N/A | 57% |
Base: all respondents. 2018 (868), 2019 (900).
As shown in Table 11, the larger the employer the more likely they were to report each of these impacts on board-level engagement. These impacts were also more prevalent within public and voluntary sector organisations than private sector companies.
Table 11: Impact of the regulations on board-level engagement with the GPG over the last year (by sector and size)
| Proportion agreeing that the regulations have… | Sector: Private | Sector: Public and voluntary | Size: 250 to 499 | Size: 500 to 999 | Size: 1,000 or more |
|---|---|---|---|---|---|
| Increased awareness at board level | 67% | 77% | 62% | 71% | 82% |
| Prompted board-level discussion or conversation | 59% | 76% | 53% | 69% | 76% |
| Resulted in board taking action | 45% | 51% | 35% | 52% | 62% |
| Provided opportunity or platform for increased focus on wider equality and diversity issues | 53% | 69% | 44% | 62% | 74% |
Base: All respondents. Private (390), Public and voluntary (510), 250 to 499 (421), 500 to 999 (221), 1,000 or more (258)
These impacts were also more widespread among employers that had a GPG, particularly those with a larger GPG (Table 12). For example, 56% of those with a median GPG of over 20% reported that their board had taken action to address this, compared to 40% of those with no GPG (zero or negative).
Table 12: Impact of the regulations on board-level engagement with the GPG over the last year (by size of GPG)
| Proportion agreeing that the regulations have… | Has a GPG: Yes | Has a GPG: No | Size of GPG: More than 20% | Size of GPG: 11% to 20% | Size of GPG: 6% to 10% | Size of GPG: Less than 6% |
|---|---|---|---|---|---|---|
| Increased awareness at board level | 72% | 63% | 75% | 73% | 72% | 66% |
| Prompted board-level discussion or conversation | 68% | 51% | 75% | 65% | 63% | 64% |
| Resulted in board taking action | 49% | 40% | 56% | 45% | 52% | 43% |
| Provided opportunity or platform for increased focus on wider equality and diversity issues | 61% | 44% | 66% | 58% | 62% | 60% |
Base: All respondents. Has a GPG (678), has no GPG (222), more than 20% (229), 11% to 20% (209), 6% to 10% (115), less than 6% (125)
Qualitative insight
The qualitative interviews provide further insight into the impact of the regulations on board-level engagement with the GPG. Overall, the introduction of the regulations was said to have prompted an increased interest in the GPG as a measure (what it means, how it is calculated) and in employers’ own results. The only employers reporting no impact at all explained that their board- level staff had already been highly engaged with GPG prior to the regulations coming into force.
As found in the 2018 research, the type and nature of conversations and decision making at a board level varied depending on the size of employers’ GPG and the (perceived) causes. While some primarily wanted to understand the underlying reasons for their GPG in order to determine how to reduce it, others were more concerned with explaining their GPG figure and demonstrating that it did not necessarily relate to unfair or unequal employment policies or practices.
“Certainly, the board were keen to know what the cause of the figure was. They were worried about how it would look and they wanted to explain it.” (1,000 or more, Private sector)
Respondents reported differences in exactly how the regulations had resulted in their board taking action to tackle their GPG.
In a minority of cases, action was said to be driven primarily by the senior leaders themselves (usually with one individual in particular seen as a key influencer). However, more commonly, HR directors and managers had used their GPG results as a means of encouraging the board to approve new actions.
“We have done more on GPG since the regulations have come in. It is us [HR] who are driving it, but the board have taken the issues on board much more as there is a number they can look at.” (250 to 499, Private sector)
Furthermore, some respondents explained that the introduction of the GPG regulations had contributed to an increased awareness of, and interest in, diversity and equality issues more widely. This increased focus was driven both directly and indirectly by the regulations:
- In a minority of cases, the need to report a GPG figure and subsequently consider ways of reducing it was said to have led to board-level conversations about the impact of existing practices and policies on different employee groups (not just by gender).
- In most cases, employers’ recognition of equality and diversity as an increasingly important and relevant topic within society as a whole had been heightened by the publicity surrounding the reporting of the GPG results. They explained that they were already prioritising equality and diversity issues, but this had been boosted to some extent by the increased focus on the GPG.
“There has been more focus on diversity and inclusion over the past few years…it was going that way, but yes the GPG reporting has played into that.” (250 to 499, Voluntary Sector)
As referenced previously, the qualitative interviews also suggest some drop-off in senior-level engagement and interest in the GPG results themselves since the first year. However, as discussed in more detail in chapter 6.1, reduced interest and engagement in their annual GPG figures does not always mean reduced interest in taking actions to tackle the GPG itself.
5.2 Communication of GPG results and staff reaction
As detailed in Figure 14, only a minority (15%) of employers had adopted an active engagement strategy to communicate their GPG results to their employees. Half (52%) had drawn their attention to it but nothing further, and a third (31%) had not done any promotion or engagement with staff. This mirrored the results seen in the 2018 survey.
While communication of GPG results to clients, suppliers, investors and other external stakeholders was less common, the proportion that had done any form of promotion or engagement had increased since the 2018 survey (from 36% to 46%).
Figure 14: How latest GPG results were communicated to employees and stakeholders (over time)
| For employees | For clients, suppliers, investors and other stakeholders | |
|---|---|---|
| Adopted a comprehensive and active engagement strategy: 2018 survey | 16% | 5% |
| Adopted a comprehensive and active engagement strategy: 2019 survey | 15% | 7% |
| Drawn their attention to it but nothing further: 2018 survey | 50% | 31% |
| Drawn their attention to it but nothing further: 2019 survey | 52% | 39% |
| Not done any promotion or engagement activity: 2018 survey | 32% | 60% |
| Not done any promotion or engagement activity: 2019 survey | 31% | 51% |
Base: all respondents (Base, don’t know approach for employees, Don’t know approach for stakeholders). 2018 (868, 2%, %), 2019 (900, 2%, 4%).
Private sector organisations were least likely to have communicated results to their staff. 34% had not done any promotion or engagement activity compared with 21% of public and voluntary sector employers. However, the proportion that had adopted a comprehensive and active staff engagement strategy was similar (15% and 16%). A similar pattern was evident when it came to communicating their GPG results to external stakeholders.
Larger organisations with 1,000 or more staff were most likely to have adopted an active engagement strategy. 22% did this with their employees and 11% with external stakeholders (compared with 11% and 4% respectively for organisations with 250 to 499 staff).
Those employers that had a GPG were also more inclined to actively engage with their staff about their results (19% compared with 5% of those with no GPG). This proportion tended to increase in line with the size of their GPG, ranging from 25% of those with a GPG of over 20% down to 13% of those with a GPG of less than 6%.
As shown in Figure 15 below, most organisations (81%) reported that there had been little or no response to their GPG results by their employees, and only 2% reported widespread staff reaction (for example, asking questions, raising concerns). There has been no change since the 2018 survey in this respect.
Figure 15: Employee reaction to latest GPG results (over time)
| 2018 survey | 2019 survey | |
|---|---|---|
| There has been widespread reaction to them | 2% | 2% |
| There has been some attention paid to them but not widespread | 17% | 16% |
| There has been little or no reaction from staff | 81% | 81% |
Base: all respondents (Base, Don’t know). 2018 (868, 1%), 2019 (900, 1%).
The proportion of employers reporting widespread staff reaction to their GPG results was similarly low across all sectors and sizes (1% to 2%). However, large organisations of 1,000 or more employees were comparatively more likely to have experienced at least some staff attention about their results (27% compared with 15% of those with fewer than 1,000 employees).
Table 13 shows that employers with a GPG were more likely to report that their staff paid at least some attention to the results (21% compared with 9% of those with no GPG). This rose to 26% among those with a large GPG of over 20%, although only 3% of this group reported widespread reaction from their employees.
Table 13: Employee reaction to their GPG results (by size of GPG)
| Has a GPG: Yes | Has a GPG: No | Size of GPG: More than 20% | Size of GPG: 11% to 20% | Size of GPG: 6% to 10% | Size of GPG: Less than 6% | |
|---|---|---|---|---|---|---|
| Widespread reaction to them | 2% | 1% | 3% | 1% | 3% | 0% |
| Some attention paid but not widespread | 19% | 8% | 23% | 19% | 14% | 18% |
| Little or no reaction from staff | 77% | 91% | 72% | 79% | 80% | 81% |
| Don’t know | 1% | 0% | 1% | 1% | 2% | 0% |
Base: All respondents. Has a GPG (678), has no GPG (222), more than 20% (229), 11% to 20% (209), 6% to 10% (115), less than 6% (125)
6. Reducing the GPG
This chapter looks at the extent to which employers are seeking to reduce their gender pay gap, and the approaches they are adopting to do so. Specifically, it covers:
- the degree to which reducing the GPG is a priority and the reasons behind this
- the extent to which employers have attempted to diagnose the causes of their GPG
- the types of complementary GPG information that employers produced or published
- the specific actions or measures developed to reduce their GPG and how these are implemented and monitored
- expectations of how they GPG will change in future, and the perceived success of any actions implemented
- use of relevant GEO guidance
6.1 Priority given to reducing their GPG
There was a broad spectrum of employer attitudes when it came to the perceived importance of reducing their GPG (or ensuring they continued to have no GPG). As set out in Figure 16, a quarter (23%) considered this to be a high priority and over a third (38%) saw it as medium priority, but 35% viewed it as a low priority or not a priority at all.
Figure 16: Priority given to reducing the GPG
| Not a priority at all | A low priority | A medium priority | A high priority | |
|---|---|---|---|---|
| Total | 10% | 25% | 38% | 23% |
| Private sector | 11% | 25% | 38% | 23% |
| Public and voluntary sector | 9% | 24% | 40% | 22% |
| 250 to 499 employees | 15% | 31% | 34% | 18% |
| 500 to 999 employees | 8% | 27% | 39% | 21% |
| 1,000 or more employees | 5% | 12% | 45% | 33% |
Base: all respondents (Base, Don’t know). Total (900, 4%). Private (390, 3%), public and voluntary (510, 4%). 250 to 499 employees (421, 2%), 500 to 999 (221, 4%), 1,000 or more (258, 5%)
The larger the employer, the more likely they were to allocate a high or medium priority to reducing their GPG (78% of those with 1,000 or more staff, 61% of 500 to 999, 52% of 250 to 499). There was no difference in priority levels between private and public/voluntary sector organisations.
Table 14 shows that, at the overall level, there has been no change since the baseline survey in the proportion of employers treating the GPG as a high priority (23% to 24% in each of the 3 annual surveys). While the proportion allocating it either a high or medium priority rose in 2018, it has since fallen back to the level seen in 2017. This pattern is broadly consistent across the different employer sectors and sizes.
Table 14: Priority given to reducing the GPG (over time)
| Year | Total | Sector: Private | Sector: Public and voluntary | Size: 250 to 499 | Size: 500 to 999 | Size: 1,000 or more | |
|---|---|---|---|---|---|---|---|
| High priority | 2017 | 24% | 24% | 26% | 24% | 21% | 29% |
| High priority | 2018 | 23% | 22% | 26% | 18% | 24% | 32% |
| High priority | 2019 | 23% | 23% | 22% | 18% | 21% | 33% |
| High or medium priority | 2017 | 61% | 59% | 68% | 56% | 61% | 72% |
| High or medium priority | 2018 | 69% | 68% | 72% | 61% | 70% | 82% |
| High or medium priority | 2019 | 61% | 61% | 63% | 52% | 61% | 78% |
Base: All respondents (2017/2018/2019). Total (900/900/900). Private (406/391/390), Public and voluntary (494/509/510). 250 to 499 (412/391/421), 500 to 999 (214/236/221), 1,000 or more (274/273/258)
As detailed in Table 15 below, employers that did not have a GPG were in fact more likely to treat the GPG as a high priority (29% compared with 21% of those with a GPG).[footnote 12] However, among those that did have a GPG, the priority allocated to addressing it increased among those with a median GPG in excess of 20% (66% viewed it as a high or medium priority, with 27% describing it as a high priority).
Table 15: Priority given to reducing the GPG (by size of GPG)
| Has a GPG: Yes | Has a GPG: No | Size of GPG: More than 20% | Size of GPG: 11% to 20% | Size of GPG: 6% to 10% | Size of GPG: Less than 6% | |
|---|---|---|---|---|---|---|
| High priority | 21% | 29% | 27% | 15% | 23% | 18% |
| High or medium priority | 60% | 66% | 66% | 60% | 61% | 47% |
Base: All respondents. Has a GPG (678), has no GPG (222). More than 20% (229), 11% to 20% (209), 6% to 10% (115), less than 6% (125)
Figure 17 details employers’ reasons for the priority given to reducing their GPG. This question was asked unprompted and respondents were able to provide multiple reasons. All reasons mentioned by at least 5% of respondents in each priority group have been shown.
Figure 17: Reasons for priority given to reducing the GPG
High priority:
- Right thing to do, want to be fair and non-discriminatory: 64%
- Diversity is good for business (for example, profit, productivity, engagement): 23%
- Important to our reputation (for example, image, attracting and retaining staff): 23%
- Want to know reasons for our GPG and address any issues: 12%
- Have a GPG (overall or in certain areas): 10%
- Legal requirement or regulation: 5%
Medium priority:
- Little or nothing we can do (for example, nature of sector, few female applicants): 26%
- Right thing to do, want to be fair and non-discriminatory: 22%
- Other more important priorities: 15%
- Don’t have a GPG or only have a small GPG: 15%
- Long term issue and will take time to solve: 13%
- Employ or pay on ability, not gender or other factors: 10%
- Diversity is good for business (for example, profit, productivity, engagement): 8%
- Have a set pay scale or structure: 7%
- Want to know reasons for our GPG and address any issues: 6%
- GPG is a wider social or cultural issue: 6%
- Have a GPG (overall or in certain areas): 5%
Low or non-priority:
- Little or nothing we can do (for example, nature of sector, few female applicants): 40%
- Don’t have a GPG or only have a small GPG: 25%
- Employ or pay on ability, not gender or other factors: 17%
- Other more important priorities: 17%
- Have a set pay scale or structure: 11%
- Don’t see the GPG as important or relevant: 10%
- GPG calculations aren’t nuanced enough: 7%
- Long term issue and will take time to solve: 6%
- Already comply with equal pay law: 6%
Base: all respondents. High priority (205), medium priority (351), low or non-priority (310). Chart only shows respondents mentioned by at least 5% of respondents in each priority group.
Among those allocating a high priority to reducing their GPG, this decision was primarily driven by moral or ethical considerations. Two-thirds (64%) highlighted a desire to do the right thing, be fair and non-discriminatory. Around a quarter (23%) also mentioned that diversity was good for their business and the same proportion (23%) referred to the potential impact on their reputation as a motivating factor.
Those employers treating their GPG as a medium priority gave a wide range of reasons, covering both motivations and barriers. The most common positive driver was that addressing their GPG was the right thing to do (22%). A significant proportion (15%) also explained that it was not a greater priority because they either did not have a GPG or only had a small GPG. However, a quarter (26%) believed there was little or nothing they could do (due to the nature of their sector, lack of female applicants), 15% referenced other more important priorities and 13% highlighted that the GPG was a long-term issue that would take time to solve.
The most common reason for treating the GPG as a low or non-priority was that employers felt there was little or nothing they could to about it (40%). A further 25% believed they did not need to prioritise it because they only had a low (or no) GPG. Most of the remainder had little desire to address their GPG. 17% indicated that decisions on who to employ and how much to pay were based on ability not gender, 17% referenced more important priorities, and 10% did not see the GPG as important or relevant.
Qualitative insight
The reasons for the different levels of priority described in the quantitative findings were echoed in the qualitative interviews. However, the latter provided additional nuance about current priority levels, the reasons for this and who within the organisation was driving it. They also explored whether employers had changed the priority they afforded to reducing their GPG and the reasons. Finally, they investigated what might prompt an increase in GPG priority, including employers’ thoughts on what the government could potentially do to encourage or facilitate this.
Current priority level
Respondents explained that senior-level staff determined the overall priority allocated to reducing their GPG, although they were often advised and encouraged by HR and/or other equality and diversity staff. Some reported that new roles (primarily focussed on equality and diversity) had been created since the implementation of the GPG reporting regulations. These new members of staff were said to have increased the priority placed on both equality and diversity in general, and on closing the GPG specifically.
“We have an equality and diversity director, so at a global level there is a push in this direction which impacts the approach in the UK. GPG is included in that.” (1,000 or more, Private sector)
Employers in the qualitative sample described the same range of factors affecting their attitudes towards closing their GPG as reported in the 2018 research, and these are summarised below:
- importance of being a fair and ethical employer
- size of their GPG
- perceived ability to close their GPG
- perceived cost associated with closing their GPG
- their opinion of the GPG as a measure of fair employment practices
In addition to these factors, some employers were now also considering the change in their GPG from Year 1 to Year 2. This initial indication of whether the situation was improving or getting worse had influenced some organisations’ sense of urgency.
These factors combine to determine the priority afforded to closing their GPG (or stopping a GPG from developing). However, this priority was always set against the relative importance of other priorities, both equality and diversity related and more broadly. As such, while some employers indicated that closing the GPG was a high priority, none of them described it as one of their top priorities overall.
The 2018 qualitative research identified 5 attitudinal groups based on a combination of the priority afforded to closing the GPG and the employer’s broad attitude towards the GPG as a measure of fair and equitable employment practices. The same groupings were observed during the 2019 study, and these are summarised in Figure 18 below.
Figure 18: Attitudes towards closing the GPG
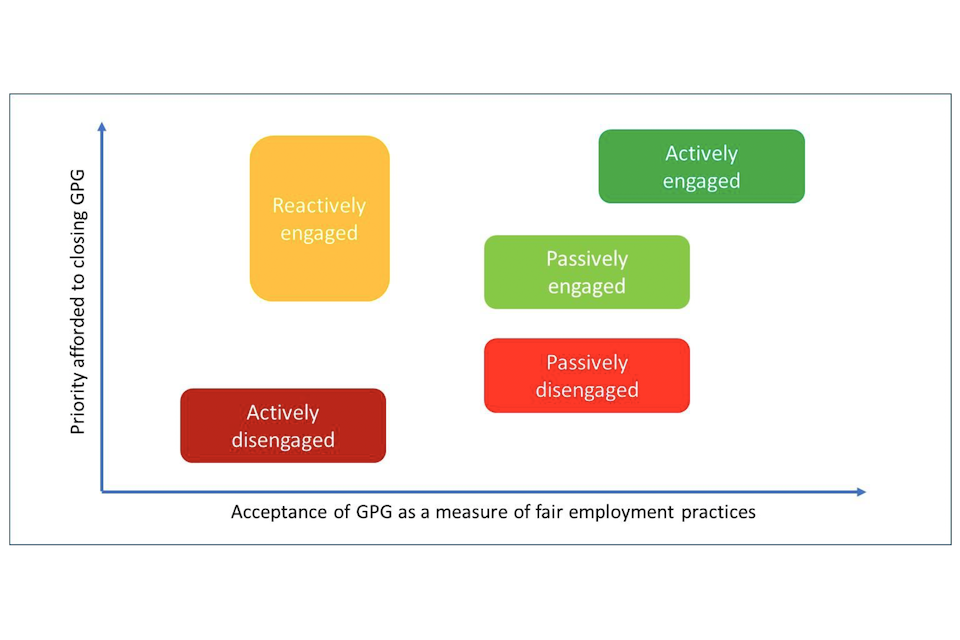
In line with both the 2017 and 2018 findings, most employers in the qualitative sample described a somewhat passive attitude towards reducing their GPG.
Passively engaged employers typically saw tackling their GPG (or taking measures to prevent a GPG from developing) as important/beneficial but not urgent. In most cases, their GPG was considered less critical than other priorities such as overcoming skills shortages, dealing with commercial pressures and addressing other equality and diversity issues. As such, it was felt to be a worthwhile ambition, rather than a core priority.
Some of these organisations were still adopting a ‘wait and see’ approach to their GPG. They felt that 2 years’ data was not adequate to identify clear trends that they could rely upon.
“It still isn’t a big priority. There isn’t enough data to see trends and without that we [HR] can’t really make a case for doing anything.” (250 to 499, Private sector)
Passively disengaged employers also felt that the GPG was a legitimate measure but did not believe that their results warranted any significant (or urgent) action. This group included some organisations with no GPG at all (although it should be noted that others with no GPG reported a high priority to maintaining this position) and some with what they regarded as an ‘acceptable’ GPG. A GPG was usually considered acceptable if it was in-line or lower than the average reported for their sector, or in some cases simply lower than they had anticipated.
“We see ensuring an equitable approach to employing staff as more important than the GPG itself. Plus, we are not looking too bad compared with other firms.” (250 to 499, Private sector)
While some of this group still sought to understand the factors causing their GPG, they could not see any genuine need to take action (other than any measures or policies they already had in place prior to the GPG regulations). Some employers had already observed a reduction in their GPG without taking any new or specific actions, and therefore described a lack of urgency around taking any further action.
Only a minority of employers in the qualitative sample were actively engaged with reducing their GPG. These organisations were motivated by a desire to be as fair as possible and address inequality across all areas of their operations. Most described a long-term commitment to addressing their GPG which preceded the introduction of the regulations.
A small proportion of the qualitative sample remained sceptical about the GPG calculations and the appropriateness of the measure. They usually felt that their GPG did not reflect how fair or ethical they were as an employer and/or that it was caused by factors outside their control. Some of these employers (typically those with larger GPGs) were reactively engaged. They still placed a priority on finding ways to tackle their GPG because they were concerned about the negative impact on their reputation, even though they were not convinced that it was a useful or accurate measure. Others were actively disengaged, and their sole focus was on explaining their GPG rather than trying to reduce it. They often felt that the measure failed to take into consideration broader factors such as the availability of women candidates in their sector, and in some cases believed that the measures they would need to take to reduce their GPG would be detrimental to their wider equality and diversity.
“We can see that there is value in going through the process of the calculations and looking at the issue, but given how the calculations are done, the figure is meaningless.” (500 to 999, Public sector)
Changes in priority
The qualitative interviews explored how attitudes towards closing the GPG had changed over time within each individual organisation. This included assessing whether the initial introduction of the regulations had influenced attitudes, and whether these attitudes had then changed since this point.
In most cases the introduction of the regulations was said to have increased the priority afforded to closing the GPG. Many employers stated that they had not previously measured or seriously considered their GPG before the announcement of the new regulations. Only a small minority (larger and/or public sector employers) had already been focussed on measuring and tackling their GPG before this point.
“The regulations were a catalyst for looking at GPG specifically within the wider strategy for equality and diversity.” (1,000 or more, Private sector)
Echoing the quantitative findings, most employers in the qualitative sample reported little or no change in the priority afforded to closing their GPG in the period since the regulations came into force. Most explained that the underlying factors affecting their attitudes had not changed, or that the initial plans they put in place around reducing their GPG were long-term in nature and therefore required a consistent level of commitment.
“The level of commitment is the same. You have to look at GPG in the long-term, especially with a small workforce like ours. Our approach is set out in a strategic plan over the next 6 years.” (250 to 499, Public sector)
“There is a consistent view that the measure is inaccurate, so nothing has changed.” (500 to 999, Public sector)
However, a minority explained that their GPG priority had subsequently increased as a result of seeing their GPG widen and/or finding out that it was higher than expected. They explained that senior leaders had been prompted to consider how to close it because they were now convinced that a problem existed.
Other employers also described an increase in activity in terms of taking action to tackle their GPG (and in their understanding of how to do so). They explained that their plans and intentions had evolved, been reviewed or been amended following ongoing analysis of their GPG results and/or examination of what other employers were doing to close it.
In a small number of cases, employers’ engagement with reducing their GPG had dipped slightly following an initial ‘spike’ of interest when the reporting regulations were first introduced. This had resulted in some organisations shifting from a state of either passive or reactive engagement, to one of passive disengagement (and lower priority). This occurred for the following reasons:
- their GPG had decreased in the second year of the regulations
- the negative impact of their GPG results (in terms of press coverage, feedback from customers or scrutiny from staff) was less than they feared
- senior managers were less concerned about the negative reputational impact after seeing the results of other employers in their sector
However, although these employers described a dip in engagement with the GPG results themselves, most explained that this had not affected the importance placed on equality and diversity more widely or reduced their focus on delivering the type of actions and policies which were likely to close their GPG (although this may not be their primary purpose).
“Momentum has continued to build around the diversity and inclusion policy. GPG is part of this.” (1,000 or more, Private sector)
It is also important to note that most employers in the qualitative sample reported that equality and diversity as a whole had become an increasingly important focus in recent years. While the GPG was only one element of this, many explained that the introduction of the regulations had facilitated (or contributed to) increased consideration of their wider policies and practices on equality and inclusion.
Increasing the priority placed on closing the GPG
The qualitative interviews explored respondents’ views on what might impact the level of priority they placed on closing their GPG. This covered both internal and external influences, including what the government could potentially do to encourage or facilitate employers to tackle their GPG.
The vast majority of employers felt that the priority they were already placing on tackling their GPG was appropriate, given their circumstances and the influencing factors outlined above. As such, most were not able to easily identify anything which might spur them to increase this priority level. Furthermore, many employers stressed that while they might not be prioritising the closing of their GPG specifically, they were engaging in a range of policies and activities to foster equality in the workplace. They therefore did not feel that an increased focus on reducing their GPG itself was necessary.
As mentioned previously, the priority placed on closing the GPG was often closely linked to the employer’s perceived ability to do so. A number of less engaged employers felt that there was very little they could do to address their GPG, often attributing their GPG to wider societal or cultural issues. Some of these suggested that specific guidance and education about what (if anything) individual employers in their sector could do to reduce their GPG would be useful and potentially encourage them to think about the issue in more detail.
“Perhaps if we understood the barriers to women applying in our sector a bit more, and how to address those, we might feel more optimistic about changing things.” (250 to 499, Private sector)
However, these employers were generally sceptical about whether any such actions existed. Some felt that it was more important for the government to take action at a broader level to address the underlying causes of the GPG (for example, encouraging more women to consider certain sectors as feasible career paths). They felt that this would be a more appropriate and effective use of public money than encouraging individual employers to do more.
Other respondents explained that they might be able to increase the priority placed on closing the GPG if their leadership teams were convinced of the commercial benefits of doing so. They explained that if it was clear that having a smaller GPG than the competition made a significant impact on their ability to attract clients or good quality job applicants, then senior managers would be more likely to set firm policies or targets on reducing it.
“If they could help us in HR come up with compelling business reasons and make the board understand what a gap might mean for business…” (500 to 999, Private sector)
Several public sector organisations explained that they did not have the available resources to focus any more time and attention on closing their GPG. They described cuts in budgets as having a significant impact on their ability to investigate the causes of their GPG and/or ways to tackle it. Therefore, they saw increased funding or other financial support as the only way they would be able to increase GPG priority levels within their organisation.
“I suppose if more funding was available to fund initiatives and planning, we might place more importance on it.” (1,000 or more, Public sector)
Actively disengaged and reactively engaged employers generally had reservations about the GPG measure as an accurate reflection of how fair or ethical they were. As such, they typically felt that nothing would encourage them to increase the priority afforded to closing their GPG while the current calculations were in use. Some explained that if they felt more confident that their headline GPG figure genuinely represented their approach to equality and diversity, they would be more motivated to take action to close it.
“Maybe if we had more faith in the figures, we would be more inclined to do something about it.” (250 to 499, Private sector)
6.2 Diagnosing the causes of their GPG
As shown in Figure 19, three-quarters (76%) of those employers that had a GPG indicated that they had tried to identify or diagnose the underlying causes of this. This proportion increased with employer size, ranging from 70% of those with 250 to 499 staff to 86% of those with 1,000 or more staff.
This was consistent with the 2018 survey results.
Figure 19: Proportion that had tried to identify or diagnose the underlying causes of their GPG (over time)
| 2018 survey | 2019 survey | |
|---|---|---|
| Total | 76% | 76% |
| Private sector | 74% | 75% |
| Public and voluntary sector | 82% | 81% |
| 250 to 499 employees | 73% | 70% |
| 500 to 999 employees | 77% | 77% |
| 1,000 or more employees | 82% | 86% |
Base: all that had a GPG (2018, 2019). Total (576, 678). Private (246, 288), public and voluntary (330, 390). 250 to 499 employees (226, 299), 500 to 999 (156, 165), 1,000 or more (194, 214)
Those employers who had tried to diagnose the causes of their GPG were asked to provide details of what they had done (from a prompted list of actions). As set out in Table 16, the vast majority had looked at the gender balance across different departments and staff types within their organisation (91%) and at how salaries and bonuses differed by gender within broadly comparable roles (87%).
Three-quarters (76%) had examined the number of part time workers, two-thirds (66%) application, recruitment and promotion rates, approaching half (46%) the proportions leaving the organisation, and a fifth (20%) differences in performance scores.
Table 16: Actions taken to try and diagnose the causes of their GPG
| Proportion that had looked at… | All who had tried to diagnose causes of their GPG |
|---|---|
| The gender balance in your organisation by pay grade, job types or departments | 91% |
| Salaries and bonuses by gender within broadly comparable roles | 87% |
| The number of part-time workers by grade and occupation | 76% |
| The proportion of women applying for, recruited into and promoted into different grades and roles | 66% |
| The proportion of women and men leaving the organisation each year, by grade or role | 46% |
| Differences in performance scores between men and women at appraisals, reviews | 20% |
| Anything else to diagnose the causes of your GPG[footnote 13] | 17% |
| Don’t know | 2% |
Base: All who had tried to diagnose the causes of their GPG (527)
Figure 20 shows that a quarter of employers (26%) had referred to the guidance published by the GEO on diagnosing the causes of the GPG. Public and voluntary sector organisations were most likely to have accessed this guidance (38% compared with 22% of private sector employers) and use also increased with employer size (ranging from 21% of those with 250 to 499 staff to 34% of those with 1,000 or more staff).
Figure 20: Proportion that used the GEO guidance on diagnosing the causes of their GPG
| Percentage | |
|---|---|
| Total | 26% |
| Private sector | 22% |
| Public and voluntary sector | 38% |
| 250 to 499 employees | 21% |
| 500 to 999 employees | 26% |
| 1,000 or more employees | 34% |
Base: all respondents (Base, Don’t know). Total (900, 6%). Private (390, 6%), public and voluntary (510, 7%). 250 to 499 employees (421, 5%), 500 to 999 (221, 6%), 1,000 or more (258, 9%)
Employers that had a GPG were also comparatively more likely to have used the GEO guidance on diagnosing its causes (29% compared with 17% of those with no GPG).
Qualitative insight
The approach employers took to diagnosing the causes of their GPG was explored in the qualitative interviews. Employers described the process of decision-making around whether and how to conduct a diagnosis. They also discussed the ease with which they were able to identify the causes of their GPG, the impact of any external assistance they used and what other forms of external support they would have benefitted from or could benefit from in the future.
Irrespective of whether they had undertaken any formal diagnosis, employers generally felt that they understood the causes of their GPG (if they had one) to at least some extent. However, while most believed they were aware of the overall factors influencing their GPG, the depth of understanding varied. Some had identified specific, tangible issues in particular departments or areas of their businesses. Others had identified (or just assumed) that their GPG was down to a more general issue, often described as being outside of their control (for example, low numbers of female applicants in their sector).
“It is obvious why there is a gap. We have a split between low paid jobs that are more typically attractive to women, and our technical roles which are only ever done by men…there are literally no women who do this type of work.” (250 to 499, Private sector)
The exact causes cited by respondents varied by sector, but the most commonly mentioned was a lack of women either in senior positions or within higher paid roles/departments within the organisation.
Deciding whether and how to try and diagnose the causes of their GPG
The decision to try and diagnose the causes of their GPG was usually said to be driven by senior leaders. However, the detail of how exactly to approach this diagnosis was typically decided by HR or finance teams.
“We run additional analysis to look at the drivers of the GPG. This is done by us [HR department] at the request of the Board.” (250 to 499, Private sector)
In a minority of cases (where the leadership team were less engaged with the GPG), HR staff decided to explore the causes of their GPG themselves. Some wanted to use this additional data to increase senior staff’s engagement with the issue and help gain approval for potential actions to tackle their GPG.
Among those employers that had tried to diagnose the causes of their GPG, the motivations varied and were largely driven by their attitudes to the GPG measure and the size of their GPG.
Most employers who accepted the GPG as a legitimate measure of fair employment practices were primarily motivated by a desire to understand any potentially unfair practices taking place in order to address these.
“We already know that a big cause of the figure is having the catering staff on the payroll, but we drilled down into the data further to make sure that there was nothing else going on.” (500 to 999, Public sector)
Employers who did not fully accept the GPG as a legitimate measure of fair employment practices were primarily motivated by a desire to justify their GPG figure and avoid negative PR and damage to their reputation. They wanted to be able to use additional analysis in the information they provided to explain their GPG figures. In these cases, the diagnosis of causes was not used as a starting point for action planning.
“We did lots of analysis, cutting the data in multiple ways. Some of the board were sceptical about how the GPG is calculated and wanted to get under the skin of it to support their opinion.” (1,000 or more, Private sector)
All employers in the qualitative sample who had tried to diagnose the causes of their GPG had first done this during Year 1 of the regulations. This was because most had not calculated their GPG before and wanted to better understand their results (for the range of reasons outlined above). In some cases, employers had undertaken repeat/additional diagnostic analysis in Year 2. However, other employers had not seen the need to diagnose the causes again, believing that these were unlikely to have changed over the course of a year.
“We do some additional analysis on the results every year, depending on what the board want to know.” (250 to 499, Private sector)
“After the first submission we looked at different cohorts to identify imbalances…we only needed to do that once.” (250,499, Voluntary Sector)
Most employers had undertaken the diagnosis activity after calculating their GPG results but prior to publishing these on the portal. The specific time of year varied from employer to employer, but in most cases it was between January and April (reflecting the fact that most did not publish their results until shortly before the deadline).
Approach to diagnosing the causes of their GPG
The approach to diagnosing the causes of GPG adopted by employers was usually determined by a combination of the needs/demands of senior leaders (for example, responding to specific questions they had about the GPG) and the capabilities, knowledge and priorities of the team carrying out the work (usually HR, but sometimes finance/payroll or data analysis teams).
Employers in the qualitative sample described different approaches to diagnosis. Figure 21 shows how these can be categorised according to the level of detailed analysis conducted and the breadth of data sources considered. The size of each box approximately represents the proportion of employers falling into each segment, although the small size of the qualitative sample should be considered when interpreting this.
Figure 21: Approaches to diagnosing the causes of their GPG
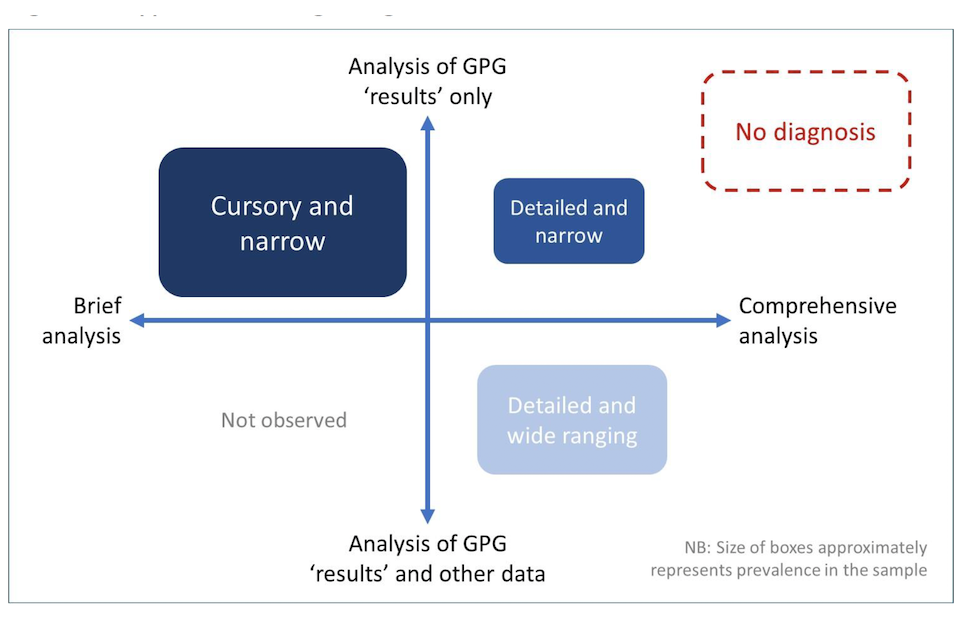
The individual segments are consistent with those identified in previous GEO research exploring the development of GPG action plans.[footnote 14]
As illustrated above, a number of employers in the qualitative sample had not carried out any diagnosis activity. This applied to almost all of those with a low or no GPG (5% or below). The one exception was an employer who, despite having no GPG at the overall level, had identified a GPG within particular areas of the business and had therefore attempted to explore the reasons for this.
Those employers who had a median GPG above 5% were represented in all of the segments shown in Figure 21. Most commonly they had adopted a relatively narrow approach to diagnosis, with analysis limited to their GPG data rather than incorporating other complementary data sources.
The different segments are described in more detail below.
No diagnosis
Some employers had not sought to diagnose the cause of their GPG at all. Often this was because they did not have a GPG (or only a negligible one) or because their GPG was in line with other organisations in their sector.
Others believed that the reasons for their GPG were ‘obvious’ and/or outside of their control, so diagnosis was not required. In some of these cases, employers attributed their GPG to the limited interest in their sector (for example, construction, engineering) among women in general. Some had reservations about the GPG being a legitimate measure of fair employment practices and therefore saw no value in exploring the causes of their results.
“We didn’t consider doing any sort of diagnosis. It is pretty obvious why there is a gap and it’s not that big. I don’t think we would really know what to do anyway to be honest.” (250 to 499, Private sector)
Cursory and narrow
Many employers in the sample reported no formal analysis beyond discussion of their GPG results (and likely causes) among HR and senior managers, or a relatively quick and basic exploration of their GPG results by key individuals. Such activity usually took place immediately after the GPG results had been calculated and shared with senior managers. The time spent on diagnosis was described as short (a matter of hours rather than days) and the results were not always reported formally.
“I did some basic analysis to see which departments had a GPG…it was just another part of the process of reporting really, it didn’t take long.” (1,000 or more, Private sector)
In some cases, employers already had an idea of the likely causes of their GPG, either through regular, on-going analysis of their workforce profile (as part of a wider equality and diversity or HR strategy) or through a ‘common sense’ understanding of their organisation’s structure. As such, the diagnosis was primarily undertaken to confirm these assumptions. In other cases, they wanted to gain a general understanding of what was driving their GPG in order to explain it when reporting their results.
“After the first run of data I did some analysis. It wasn’t done in a formal way, it helped to confirm that we didn’t have an equal pay issue.” (500 to 999, Private sector)
Employers adopting this less involved approach to diagnosing the causes of their GPG did not always report a direct link between the diagnosis and the development of specific, dedicated actions to close their GPG. However, many in the sample explained that, as part of their overall approach to equality and inclusion, they were still undertaking actions which would ultimately result in a reduction in their GPG (even though they were not specifically designed for this purpose). These broader actions often pre-dated the implementation of the GPG regulations.
Detailed and narrow
A minority of employers adopted a more formal and systematic approach to (re)analysing their GPG data but did not seek to overlay or accompany it with any other sources. They described re-visiting the data on multiple occasions in order to check a range of hypotheses or answer questions raised by senior managers. The time taken varied and was not always easy for respondents to quantify. However, they usually described it as involving several days of their own or other team members’ time.
“The internal analyst team and I spent a lot of time looking at the different ways of cutting the data.” (1,000 or more, Private sector)
Detailed and wide ranging
Most employers who took a more formal and systematic approach to diagnosing the causes of their GPG also described use of additional data to inform the process (for example, the profile of leavers and joiners at different pay grades/departments or the gender split in uptake of flexible working). They used this additional data to better understand how policies and practices were impacting recruitment, retention and development of staff across their organisation and within specific business units. This detailed approach was slightly more common among larger employers.
This group described a relatively high degree of planning and interaction when analysing their GPG. Some used teams of expert analysts within their organisations and/or liaised with other departments to gain access to relevant data. Again, the time taken varied and was not always easy for respondents to quantify, but it was usually said to have involved a number of days in total (across all staff involved).
Furthermore, some described a staged process, with initial analysis reported back to senior managers before the next phase of investigation was undertaken. This methodical approach provided confidence that they had explored all possible causes of their GPG.
“We could see that the imbalance wasn’t at a leadership level, so we adopted a staged approach to look at different departments and levels.” (250 to 499, Voluntary Sector)
In a minority of cases, employers reported that this formal analysis of their GPG data had directly informed the development and implementation of specific actions or plans to close their GPG. For example, some had reviewed or changed recruitment practices for particular grades or types of role. However, others did not identify a direct link. Rather they felt that by diagnosing the causes of their GPG, they were able to reassure themselves that they were not inadvertently treating women and men unfairly and in some cases confirm that their existing actions were appropriate.
“We could see that the GPG was driven by gender balance in the top quartile, but we already knew that anyway…we are doing things to attract and support women, like a women’s network, but that isn’t because of the GPG figures.” (1,000 or more, Private sector)
Type of analysis undertaken
The qualitative interviews provided further insight into the actions that employers had taken to try and diagnose the causes of their GPG. They found that awareness and understanding of the specific actions reported in the quantitative survey (see Table 16) was somewhat inconsistent.
While most employers in the qualitative sample had some understanding of how to go about establishing the causes of their GPG, a minority had little or no idea of how to do this. This lack of knowledge was often accompanied by a low priority placed on closing the GPG. However, this was not always the case, and some employers wanted to know how the issue could be tackled but felt that the drivers of their GPG were likely to be complex and difficult to unpick.
“We did some basic analysis, but we didn’t really know exactly what to look at or how to do it. We are just HR people, not analysts.” (1,000 or more, Private sector)
Furthermore, although employers typically had some idea of how to diagnose the causes of their GPG, not all of these described a detailed, in-depth understanding of the different approaches.
The quantitative survey found that the most widely taken diagnosis actions were looking at the gender balance in different areas of the organisation, how salaries and bonuses differed by gender within broadly comparable roles, the number of part time workers by grade and occupation, and application/recruitment/promotion rates by gender. These actions were also common within the qualitative sample and were widely understood. They were described as common-sense and logically linked to the GPG, and employers often explained that these were already being done as part of more general analysis of the workforce or as part of their wider equality and diversity activities.
In contrast, other possible actions (for example, breaking down leavers by gender and looking at differences in performance scores by gender) were often not associated with the GPG by employers because they were not directly related to pay and remuneration. As such, these activities were less likely to have been considered or carried out (or, if they were, they were generally not included in the GPG diagnosis process).
“We looked at the appraisal structure and how performance is measured as part of the staff excellence workstream, but that was not GPG related…we didn’t see that as necessary.” (250 to 499, Public sector)
The type and extent of the actions taken to diagnose their GPG were also influenced by employers’ specific circumstances. Most explained that they only looked at data that was already collected or readily available, and often restricted this analysis to areas they felt were likely to have an impact on pay or staff recruitment, retention and development. As such, certain measures were less likely to be undertaken than others (as reflected in the quantitative data). For example, some employers explained that they did not collect staff appraisal or performance data in a consistent way, or did not consider it likely to impact their GPG.
“No, we haven’t looked at staff appraisals. Our issue is mostly about part-time working.” (1,000 or more, Private sector)
Ease of diagnosing the causes of their GPG
Most employers who had attempted to diagnose the causes of their GPG felt that this was relatively easy to do. However, as mentioned above, not all employers had attempted detailed or comprehensive analysis. They felt that what they did attempt was straightforward but had not gone further due to a lack of knowledge about what to do and/or how to do it, or a perceived lack of need. Furthermore, some employers had anticipated that the task would be too difficult, complex or time-consuming to make it worth trying.
“It would cost us time and money that we don’t have to do more detailed work on this. Getting all the data from different systems and figuring it all out would not be worth it.” (500 to 999, Private sector)
More details are provided below, looking firstly at the ease of taking action to diagnose the causes of their GPG and secondly at the ease of interpreting the resulting data.
Ease of taking actions
The ease with which employers were able to gather data and organise the relevant staff to carry out the actions to diagnose their GPG varied across the qualitative sample. This depended on a number of factors:
- The size and complexity of the workforce. Organisations with multiple, diverse departments and business units sometimes described the process of gathering the necessary data as relatively time-consuming. Typically, those with smaller headcounts faced less of an issue in this regard.
- The type of analysis being conducted. Some employers attempting to conduct more detailed and wide-ranging analysis explained that the process of gathering the data was time-consuming and complex. It sometimes included not only transfer of digital files, but also discussion with other teams or departments to ensure the correct and most current information was being used. However, most did not feel that this had prevented them from carrying out the intended analysis.
- The types of systems in place. In some cases, employers reported a challenge associated with pulling data from multiple systems (for example, payroll, HR) that were not integrated, or were not easy to use in conjunction with one another. Particular problems were reported with old systems or those from different organisations (for example, where they had been brought together through merger or acquisition). Overcoming these challenges was sometimes described as impossible, and therefore a barrier to carrying out (more detailed) diagnosis.
- The availability of resources. Employers looking to draw data from multiple systems or liaise with staff across different departments as part of their diagnosis activity sometimes noted that this was a drain on the time of HR staff. Where teams were described as stretched or prioritising other issues, this made the process of gathering data and carrying out the analysis slower and more of a burden.
Ease of understanding and interpreting the data
The ease with which employers were able to understand and interpret the data they collected to diagnose their GPG also varied.
Most employers that had conducted relatively straightforward analysis of their GPG results (looking at how this differed by role or department) felt that spotting trends in the data was quite simple. In cases where more detailed analysis was undertaken, the HR teams often had to rely on the expertise of in-house analysts to make sense of the output. Many medium and large employers in the sample described fairly extensive HR, finance and analytical in-house teams and, as such, they were usually confident that they had been able to accurately and effectively interpret the data.
“We are lucky. We are big enough to have good systems and people who can run the analysis.” (500 to 999, Private sector)
However, some employers described the process of interpreting data to identify the drivers of their GPG as challenging. Larger organisations with complex workforces sometimes felt that the situation regarding remuneration, recruitment and retention was too complex for a clear set of drivers to be evident. Some added that they did not have time to consider the data in any greater detail, especially when they felt they were already doing much to address the likely causes of their GPG.
Furthermore, some employers explained that their analysis of the data had not provided any real clarity on what was driving the GPG beyond what they described as their ‘common-sense’ understanding about the balance of men and women in senior roles. They noted that the underlying question they wanted answering was about what causes women to make particular choices around applying for jobs and promotions and it was not possible to address this through the available data/analysis.
“It is one thing identifying where in the organisation the gaps exist, but that isn’t the real question. We need to know what drives behaviour.” (1,000 or more, Voluntary Sector)
External support to help diagnose the causes of their GPG
Very few employers in the qualitative sample had used any external support when trying to diagnose the causes of their GPG. Many felt that this was not necessary as they had sufficient understanding and expertise in-house. In other cases, they had simply not considered whether support was available.
“There was no need. We have a good payroll and HR team.” (250 to 499, Voluntary Sector)
A small minority explained that their use of Acas and GEO guidance or attendance at seminars/webinars on calculating and reporting their GPG had given them an initial understanding of the issues, and therefore enabled them to carry out some form of diagnostic activity. However, they were generally unable to pinpoint more specific impacts of the guidance.
It was more common for employers to have sought support and guidance in a less formal manner. This usually involved looking at the commentaries and action plans submitted by other employers on the GPG reporting portal. This had given them an indication of what might be driving their own GPGs. Some had also researched this online and read relevant articles.
“I looked at other businesses’ reports to see what they were doing. That was useful, it gave us some ideas and reassurance that we were looking at the right sort of things.” (1,000 or more, Private sector)
GEO guidance on diagnosing the causes of GPG
Use of GEO guidance on diagnosing the causes of the GPG was very limited in the qualitative sample. Many respondents could not recall seeing or hearing about the guidance at all, although some of these explained that they would have consulted the guidance had they know it existed.
“I would have looked at it and taken it on its merits.” (250 to 499, Voluntary Sector)
The small minority of respondents who remembered using the GEO guidance did not find it particularly useful. While they had not always looked at the document in detail, some felt that it did not provide any information that they did not already know.
“It was of no use to me at all. It stated the obvious. These are things that HR people should already know.” (500 to 999, Public sector)
Some employers felt that the guidance did not provide sufficient detail or concrete direction. The document was described as ‘wishy washy’, focusing on broad themes but without clear direction on exactly what should be done (specific calculations) or what the diagnosis results would mean (in terms of actions needed). Others found the guidance too broad in terms of the type of employers it covered. They wanted more sector-specific information, or information which better reflected their particular circumstances.
“It was very vague, very generic. Like the GPG measurement, it assumes consistent pay over the whole year. Our situation is more complex than that, so this wasn’t helpful.” (1,000 or more, Private sector)
Unmet support and guidance needs
Respondents were asked what (else) might help them diagnose the causes of their GPG. Most could not describe any unmet needs in this area. Some commented that they ‘do not know what they do not know’ and it was therefore impossible to speculate on what else might help.
Furthermore, many employers felt that they were already doing what they needed to in this regard, so additional support was unnecessary.
“There is no need, the reasons are really simple and obvious.” (250 to 499, Private sector)
Employers who felt that the way the GPG results are calculated is too blunt and generic suggested that the most meaningful way of helping them understand their underlying GPG issues would be to make changes to the calculations themselves. Others explained that providing easily accessible sector benchmarks on GPG was more important than guidance about diagnosing it.
They wanted to better understand the degree to which their GPG was driven by external factors, rather than what they were doing internally.
However, some suggestions were made about the types of support that would be most useful.
Provision of specific, concrete examples of the calculations and analysis required was most often mentioned. This would provide surety and confidence to HR teams with limited experience in analytical tasks. Some employers added that they would have welcomed easy access to practical advice and direction through seminars or webinars.
“I would want it to explain exactly how to do it. That means the formulas and calculations.”
(1,000 or more, Private sector)
Some employers pointed out the importance of linking guidance on diagnosing the causes of GPG to potential actions that could be taken to address these. They felt that this would constitute more practical, actionable support than information which solely dealt with understanding the causes.
“The best thing would be practical help and assistance, linked to taking action…explaining exactly what you need to do.” (500 to 999, Private sector)
An easy way of learning what other employers had done to diagnose their GPG was also considered potentially beneficial. Some employers felt that online forums or networks could be useful for HR staff to discuss the pros and cons of different approaches. Others simply wanted case studies of relevant examples. They wanted to see examples from their own sector and size band, and from organisations with similar sized GPGs.
“I would like to see best practice examples of diagnosis, especially offering low cost solutions for public sector organisations.” (1,000 or more, Public sector)
Some employers stressed the importance of addressing the fact that the causes of the GPG can be complex and interwoven. They pointed out that any guidance on diagnosis needs to explain that multiple factors may be causing the GPG. For example, one respondent described the importance of raising awareness among businesses that effective diagnosis required more than just analysing how pay breaks down across roles.
“I think they need to raise awareness about doing this type of diagnosis and explain that it can actually help reduce the GPG in the end.” (250 to 499, Private sector)
6.3 Complementary GPG information produced by employers
All surveyed employers were asked whether, in addition to publishing the data required by the regulations, they had produced any other information on their GPG. They were read out a list of various types of additional information and asked whether they had produced each one (irrespective of whether it was published externally or was for internal use only). The results are summarised in Figure 22 below.
Figure 22: Complementary GPG information produced
| Percentage | |
|---|---|
| An explanation of the reasons for your GPG | 73% |
| Details of how your GPG has changed over time | 53% |
| Information about your organisation’s other diversity policies and actions | 51% |
| More detailed analysis of your data, above that required by the regulations | 46% |
| Information on the legal requirements and how GPG differs from equal pay law | 46% |
| Details of any existing actions that you have already taken to reduce your GPG | 45% |
| Details of any new actions that you are putting in place to address your GPG | 38% |
| Comparisons with your sector, key competitors or other similar employers | 38% |
| Targets for reducing your GPG | 14% |
| Anything else | 4% |
| None of these | 11% |
Base: all respondents (Base, don’t know). Total (900, 1%).
The vast majority of employers (88%) had produced some form of complementary information about their GPG. In most cases this included an explanation of the reasons for their GPG (73%). Around half had produced details of how their GPG had changed over time (53%), information on their wider diversity activity (51%), more detailed analysis of their GPG data (46%) and information on the legal requirements and the difference between GPG and equal pay law (46%).
In addition to contextual information, half of employers (50%) had produced details of the actions they had developed to address their GPG. 45% provided details of existing ones which they had already implemented and 38% details of new ones they were putting in place (most reported a mix of both existing and new actions).
In the previous surveys, the questions asked about GPG actions were different and the results are therefore not directly comparable. However, in 2018 only a third (34%) of employers reported that they had developed a formalised strategy to address their GPG (irrespective of whether the actions had been implemented yet). In comparison, in 2019 half (50%) of all employers had produced details of the GPG actions they had developed, suggesting an increase in this respect.
As detailed in Table 17, public and voluntary sector organisation were more likely than their private sector counterparts to have produced each type of additional information (with the exception of targets for reducing their GPG). The proportion producing these also increased in line with employer size.
Table 17: Complementary GPG information produced (by sector and size)
| Sector: Private | Sector: Public and voluntary | Size: 250 to 499 | Size: 500 to 999 | Size: 1,000 or more | |
|---|---|---|---|---|---|
| An explanation of the reasons for your GPG | 69% | 83% | 69% | 72% | 81% |
| Details of how your GPG has changed over time | 49% | 66% | 45% | 53% | 67% |
| Information about your organisation’s other diversity policies and actions | 46% | 64% | 44% | 51% | 61% |
| More detailed analysis of your data, above that required by the regulations | 42% | 56% | 37% | 48% | 58% |
| Information on the legal requirements and how GPG differs from equal pay law | 42% | 57% | 37% | 46% | 60% |
| Details of any existing actions that you have already taken to reduce your GPG | 42% | 56% | 35% | 50% | 58% |
| Details of any new actions that you are putting in place to address your GPG | 34% | 50% | 27% | 43% | 54% |
| Comparisons with your sector, key competitors or other similar employers | 33% | 52% | 30% | 42% | 48% |
| Targets for reducing your GPG | 14% | 15% | 10% | 15% | 21% |
| Anything else | 4% | 5% | 2% | 5% | 6% |
| None of these | 13% | 3% | 14% | 8% | 7% |
| Don’t know | 1% | 1% | 1% | 2% | 1% |
| Net: Developed any actions (new or existing) | 46% | 62% | 39% | 55% | 63% |
Base: All respondents. Private (390), Public and voluntary (510). 250 to 499 (421), 500 to 999 (221), 1,000 or more (258)
Table 18 shows that employers who had a GPG were also significantly more likely to have produced additional information on the topic, and in most cases there was a correlation between this and the size of their GPG (those with a GPG in excess of 20% were typically more likely to have produced each type of additional information).
This pattern was particularly evident when it came to actions to address their GPG. 57% of those with a GPG had developed any actions, compared to 28% of those with a zero or negative GPG. Those with a high GPG of over 20% were particularly likely to have done this (68%).
Table 18: Complementary GPG information produced (by size of GPG)
| Has a GPG: Yes | Has a GPG: No | Size of GPG: More than 20% | Size of GPG: 11% to 20% | Size of GPG: 6% to 10% | Size of GPG: Less than 6% | |
|---|---|---|---|---|---|---|
| An explanation of the reasons for your GPG | 78% | 59% | 87% | 81% | 74% | 61% |
| Details of how your GPG has changed over time | 59% | 37% | 64% | 62% | 54% | 49% |
| Information about your organisation’s other diversity policies and actions | 52% | 47% | 62% | 51% | 51% | 36% |
| More detailed analysis of your data, above that required by the regulations | 48% | 38% | 49% | 46% | 46% | 52% |
| Information on the legal requirements and how GPG differs from equal pay law | 50% | 31% | 57% | 53% | 44% | 42% |
| Details of any existing actions that you have already taken to reduce your GPG | 51% | 27% | 61% | 53% | 46% | 36% |
| Details of any new actions that you are putting in place to address your GPG | 45% | 18% | 54% | 51% | 35% | 31% |
| Comparisons with your sector, key competitors or other similar employers | 43% | 24% | 44% | 46% | 39% | 40% |
| Targets for reducing your GPG | 16% | 8% | 17% | 19% | 15% | 12% |
| Anything else | 4% | 3% | 6% | 3% | 3% | 4% |
| None of these | 8% | 17% | 3% | 9% | 9% | 17% |
| Don’t know | 1% | 1% | 1% | 0% | 4% | 1% |
| Net: Developed any actions (new or existing) | 57% | 28% | 68% | 59% | 48% | 41% |
Base: All respondents. Has a GPG (678), has no GPG (222). More than 20% (229), 11% to 20% (209), 6% to 10% (115), less than 6% (125)
As set out in Figure 23, in most cases where employers produced complementary information around their GPG this was made available to the wider public (for example, on their website or in published GPG reports). For example, 60% of employers had externally published an explanation of the reasons for their GPG, 12% had produced this but just for internal use, and 26% had not produced this at all.
Where employers had taken or planned any actions to address their GPG, these were also typically shared externally. 31% published details of existing actions they had taken and 29% published details of new actions they were putting in place (compared with 14% and 10% respectively who had developed actions but only for internal use).
However, where employers undertook comparisons with other relevant employers, this was more likely to have been restricted to internal use (23% compared with 15% who published this externally).
Figure 23: External publication of complementary GPG information
| Published externally | Only internal | Did not produce this | |
|---|---|---|---|
| An explanation of the reasons for your GPG | 60% | 12% | 26% |
| Details of how your GPG has changed over time | 40% | 13% | 46% |
| Information about your organisation’s other diversity policies and actions | 31% | 18% | 48% |
| More detailed analysis of your data, above that required by the regulations | 26% | 18% | 53% |
| Information on the legal requirements and how GPG differs from equal pay law | 32% | 12% | 53% |
| Details of any existing actions that you have already taken to reduce your GPG | 31% | 14% | 54% |
| Details of any new actions that you are putting in place to address your GPG | 29% | 10% | 60% |
| Comparisons with your sector, key competitors or other similar employers | 15% | 23% | 61% |
| Targets for reducing your GPG | 7% | 7% | 85% |
Base: all respondents (Base, Don’t know if published externally, Don’t know if produced this information). Total (900, 0% to 1%, 1%).
Table 19 summarises the proportion of employers that externally published any complementary GPG information, and the proportion that published any actions to address their GPG. Approaching three-quarters (73%) had published additional information, with a third (35%) publishing actions.
These proportions increased among public/voluntary sector organisations and were also higher among larger employers.
Table 19: Proportion that externally published any complementary GPG information and actions to address their GPG
| Total | Sector: Private | Sector: Public and voluntary | Size: 250 to 499 | Size: 500 to 999 | Size: 1,000 or more | |
|---|---|---|---|---|---|---|
| Externally published any complementary GPG information | 73% | 69% | 86% | 69% | 74% | 79% |
| Externally published details of actions to address their GPG | 35% | 32% | 46% | 28% | 38% | 46% |
Base: All respondents. Total (900). Private (390), Public and voluntary (510). 250 to 499 (421), 500 to 999 (221), 1,000 or more (258)
The likelihood of publishing information and actions externally also typically increased in line with the size of employers’ GPG (Table 20).
Table 20: Proportion that externally published any complementary GPG information and actions to address their GPG (by size of GPG)
| Has a GPG: Yes | Has a GPG: No | Size of GPG: More than 20% | Size of GPG: 11% to 20% | Size of GPG: 6% to 10% | Size of GPG: Less than 6% | |
|---|---|---|---|---|---|---|
| Externally published any complementary GPG information | 77% | 63% | 87% | 79% | 66% | 65% |
| Externally published details of actions to address their GPG | 41% | 19% | 54% | 44% | 24% | 28% |
Base: All respondents. Has a GPG (678), has no GPG (222). More than 20% (229), 11% to 20% (209), 6% to 10% (115), less than 6% (125)
Figure 24 shows that 50% of the employers that had developed any GPG actions published the same (or greater) amount of detail as in their internal documents and plans. A fifth (19%) published an abbreviated version and 29% did not publish any of their actions externally.
Figure 24: Level of detail published externally about GPG actions
| Percentage | |
|---|---|
| Did not publish actions externally | 29% |
| Published less detail than in internal plans or documents | 19% |
| Published same amount of detail | 46% |
| Published more detail than in internal plans or documents | 4% |
Base: all who had taken or planned actions (Base, don’t know). Total (488, 1%).
Qualitative insight
Reflecting the survey findings, the majority of employers in the qualitative sample had produced some form of GPG documentation beyond that required by the reporting regulations. Employers chose to publish additional information to ensure that the reason for their GPG was clearly explained and/or to demonstrate a commitment to closing it. They felt that doing so would enhance their reputation among customers, potential employees and the wider public. Some added that it was important that these documents were up-to-date and evolved over time, as this would demonstrate their on-going commitment to addressing the GPG.
“The narrative covers the last 12 month’s activity. It’s important to show what we’ve been doing recently on these issues.” (1,000 or more, Private sector)
Most employers made their GPG reports/narrative commentaries available to staff via newsletters or on their intranet. A minority had conducted staff forums and discussions following publication of their Year 1 results. They had considered it important to provide staff with an opportunity to ask questions, and some had also used these forums as a means of exploring the possible causes of, and solutions, to their GPG.
Where employers had developed actions to close their GPG, most had included these in an accompanying narrative commentary or GPG report. These were made available on employers’ own websites and also via a link on the GEO portal.
In addition, some employers had produced more detailed written plans or strategy documents. However, few described dedicated GPG-specific action plans. Instead, these tended to be broader equality and diversity or HR strategies which included the GPG alongside a range of other areas. While some organisations chose (or, in the case of certain public sector organisations, were required) to publish such documents in full on their websites, others described them as internal documents. They noted that they contained detailed information that it was not necessary to share, or that would not be easily understood by third parties. Therefore, some referenced or included abridged versions of these strategies in their publicly available GPG commentaries/reports.
“The DandI strategy is not published, but the fact that we have one is set out as one of the broad actions in the GPG report.” (1,000 or more, Private sector)
“The equality and diversity strategy is an internal document, available to staff. But it is more detailed than the GPG plan that is published…it’s just in the interest of brevity really.” (1,000 or more, Private sector)
Employers reported different approaches to the format and content of strategies, plans and other complementary GPG documents. These ranged from very brief, bullet-pointed summaries of intentions relating to closing the GPG to long, detailed reports containing a wide range of measures, timescales for delivering them or progress already made.
“The DandI strategy has GPG issues like training for women and recruitment policies set out in the relevant sections.” (1,000 or more, Private sector)
The majority of those producing shorter, more succinct documents reported a lack of need to take much action to close their GPG. Others were planning to create more detailed documents in future or also had more detailed (internal) strategies in place.
“We haven’t got a GPG plan. Nothing is really formally written down other than some bullet points in the GPG submission, and that is just the bare minimum really.” (250 to 499, Voluntary Sector)
6.4 Actions taken to reduce their GPG
Those employers that had developed any actions to address their GPG were asked to provide details of what these included. Please note that the analysis in Table 21 below is based on all surveyed employers, with those that had not developed any actions shown in the ‘No actions taken/planned’ code.
Table 21: Actions taken or planned to address their GPG
| Total | Sector: Private | Sector: Public and voluntary | Size: 250 to 499 | Size: 500 to 999 | Size: 1,000 or more | |
|---|---|---|---|---|---|---|
| Offering or promoting flexible working arrangements | 44% | 40% | 56% | 33% | 49% | 58% |
| Reviewing your existing policies | 40% | 35% | 52% | 29% | 45% | 53% |
| Improving or altering your recruitment processes | 37% | 34% | 46% | 27% | 41% | 50% |
| Introducing or improving other training on diversity and equality | 37% | 33% | 47% | 26% | 42% | 51% |
| Promoting shared parental leave policies | 36% | 32% | 45% | 27% | 42% | 44% |
| Introducing or continuing to run mandatory unconscious bias training | 30% | 27% | 39% | 21% | 34% | 43% |
| Improving or altering your internal promotion processes | 27% | 25% | 35% | 19% | 33% | 37% |
| Encouraging or enhancing women’s networks or other diversity support groups | 26% | 23% | 32% | 15% | 24% | 44% |
| Any other actions to address your GPG | 6% | 5% | 9% | 5% | 4% | 11% |
| No actions taken/planned | 50% | 54% | 38% | 61% | 45% | 37% |
Base: All respondents. Total (900). Private (390), Public and voluntary (510). 250 to 499 (421), 500 to 999 (221), 1,000 or more (258)
Many of the GPG actions focussed on staff working practices, with 44% offering or promoting flexible working (for example, part time, home working, job sharing) and 36% promoting shared parental leave policies. Others concentrated on the organisation’s HR practices, such as reviewing their existing polices (40%) and improving or altering their recruitment (37%) or promotion (27%) processes. Training also featured heavily, with 30% introducing or continuing mandatory unconscious bias training and 37% introducing or improving other equality and diversity training.
Public/voluntary sector organisations and larger employers were more likely to have taken each of the specific actions.
As detailed in Figure 25, almost a quarter of employers (23%) had referred to the GEO guidance on producing an action plan. This increased to 36% of public/voluntary sector organisations and was also higher among those with 500 or more staff. This is consistent with the pattern seen for accessing the guidance on diagnosing the causes of the GPG (see chapter 6.2).
Figure 25: Proportion that used the GEO guidance on producing a GPG action plan
| Percentage | |
|---|---|
| Total | 23% |
| Private sector | 18% |
| Public and voluntary sector | 36% |
| 250 to 499 employees | 17% |
| 500 to 999 employees | 26% |
| 1,000 or more employees | 29% |
Base: all respondents (Base, Don’t know). Total (900, 6%). Private (390, 6%), public and voluntary (510, 7%). 250 to 499 employees (421, 4%), 500 to 999 (221, 7%), 1,000 or more (258, 11%)
Table 22 demonstrates that employers that had a GPG were also comparatively more likely to have used the GEO guidance on developing an action plan (25% compared with 17% of those with no GPG).
Table 22: Proportion that used the GEO guidance on producing a GPG action plan (by size of GPG)
| Has a GPG: Yes | Has a GPG: No | Size of GPG: More than 20% | Size of GPG: 11% to 20% | Size of GPG: 6% to 10% | Size of GPG: Less than 6% | |
|---|---|---|---|---|---|---|
| Used GEO guidance on producing a GPG action plan | 25% | 17% | 25% | 30% | 20% | 19% |
Base: All respondents. Has a GPG (678), has no GPG (222). More than 20% (229), 11% to 20% (209), 6% to 10% (115), less than 6% (125)
Those employers that had developed any actions to address their GPG were asked about their approach to implementing these and monitoring their effectiveness (Figure 26). The vast majority of these employers (89%) had allocated overall accountability for ensuring the actions happened to a member of the senior management team, and approaching three-quarters (72%) had tasked a specific individual or team with implementing each action. However, less than half (46%) had incorporated specific timescales for when each action must be implemented.
Three-quarters (75%) had a process to formally review the relevance of the actions they had implemented and assess whether further actions were required, but formal processes to evaluate their impact on the organisation’s GPG were less widespread (58%).
Figure 26: Approach to implementing and monitoring GPG actions
| Percentage | |
|---|---|
| A named individual or team tasked with implementing each action | 72% |
| A member of the senior management team with overall accountability for ensuring the actions happen | 89% |
| A specified timescale or target for when each action must be implemented | 46% |
| A process to formally review these actions to check they are still relevant and consider whether additional actions are needed | 75% |
| A process to formally evaluate the impact of these actions on your GPG | 58% |
Base: all who had taken or planned actions to address their GPG (Base, Don’t know). Total (488, 2% to 7%).
As shown in Table 23, larger employers of 1,000 or more staff were notably more likely to nominate an individual or team to implement their actions (82%), impose time-scales (60%) and have a formal review process (82%). There were no statistically significant differences by sector.
Table 23: Approach to implementing and monitoring GPG actions (by sector and size)
| Sector: Private | Sector: Public and voluntary | Size: 250 to 499 | Size: 500 to 999 | Size: 1,000 or more | |
|---|---|---|---|---|---|
| A named individual or team tasked with implementing each action | 72% | 72% | 63% | 71% | 82% |
| A member of the senior management team with overall accountability for ensuring the actions happen | 89% | 89% | 87% | 91% | 90% |
| A specified time-scale or target for when each action must be implemented | 45% | 47% | 33% | 44% | 60% |
| A process to formally review these actions to check they are still relevant and consider whether additional actions are needed | 74% | 77% | 68% | 74% | 82% |
| A process to formally evaluate the impact of these actions on your GPG | 56% | 64% | 55% | 62% | 59% |
Base: All who had taken or planned actions to address their GPG. Private (178), Public and voluntary (310). 250 to 499 (185), 500 to 999 (126), 1,000 or more (177)
Table 24 shows that most employers who had developed GPG actions felt it was too early to judge their success at the time they were surveyed (59%), and a further 18% felt that to date they had been neither successful nor unsuccessful. However, among those who were able to assess this, the majority described the actions as being very or fairly successful (18% compared with 3% very/fairly unsuccessful).
Table 24: Perceived success of actions taken to address their GPG
| Total | Sector: Private | Sector: Public and voluntary | Size: 250 to 499 | Size: 500 to 999 | Size: 1,000 or more | |
|---|---|---|---|---|---|---|
| Very successful | 3% | 2% | 4% | 2% | 5% | 1% |
| Fairly successful | 15% | 13% | 18% | 11% | 16% | 18% |
| Neither successful nor unsuccessful | 18% | 20% | 14% | 25% | 16% | 13% |
| Fairly unsuccessful | 3% | 4% | 2% | 5% | 4% | 1% |
| Very unsuccessful | 0% | 0% | 0% | 0% | 0% | 0% |
| It’s too early to say | 59% | 59% | 59% | 54% | 58% | 65% |
| Don’t know | 2% | 2% | 2% | 2% | 0% | 2% |
Base: All who had taken or planned actions to address their GPG. Total (488). Private (178), Public and voluntary (310). 250 to 499 (185), 500 to 999 (126), 1,000 or more (177)
Qualitative insight
The actions taken by employers to address their GPG were also explored in the qualitative interviews. Employers described the types of actions they had taken and how these had been developed. They also explained how, if at all, these actions had changed over time, how they monitored and assessed their impact, and how they could be helped to take different or additional actions in the future.
Types of action undertaken
Employers described a range of actions to tackle their GPG, and these closely reflected those outlined in the quantitative findings above. In addition, a small minority also mentioned making changes to the structure of certain teams and carrying out salary or job description reviews for some of the workforce in response to their GPG results. Others had taken on new members of staff (for example, HR managers or Equality and Inclusion managers) since the GPG regulations came into force. While these appointments were not made exclusively to tackle the GPG, employers explained that they were likely to have an impact in terms of driving future actions.
“We have appointed an EandI director for the first time. She is driving forward lots of work on encouraging women to progress to senior roles.” (1,000 or more, Private sector)
The vast majority of employers who had taken (or planned) action described multiple examples of the policies, procedures or plans they had in place around closing their GPG. As observed in the 2017 and 2018 research, actions to tackle GPG were usually not developed specifically or exclusively for this purpose. Rather, employers often described actions which they had implemented to provide a fair and equitable working environment for all of their staff, because they considered this to be the right thing to do. Similarly, actions had not always been introduced as a result of finding out that they had a GPG and often pre-dated the introduction of the GPG regulations.
Across the qualitative sample, the definition of ‘action’ in relation to tackling the GPG was wide. Some employers reported concrete policies or initiatives such as introducing gender balanced interviewing panels, specific training, or providing flexible working arrangements. However, the reported actions also included broader activities and less tangible policies, such as commitments to better support women in their progression through the organisation or reviewing recruitment policies to identify potential areas to change in the future. It is therefore important to consider this when interpreting the quantitative results on actions taken (as shown earlier in this chapter), as these will not always refer to a strong, direct, strategic policy on reducing the GPG.
“We aren’t doing anything specific on GPG as such. But we are reviewing how we do appraisals and looking at how we approach personal development with mentoring.” (250 to 499, Private sector)
Approach to developing actions
HR teams were often said to be responsible for developing actions related to reducing the GPG. Respondents (usually senior HR staff) commonly described themselves as the person with responsibility for developing policies and specific actions. In comparison, the senior leadership team were more likely to be responsible for setting broad objectives, commitments and targets in relation to GPG. They were also said to have final sign-off on any specific actions, policies or publications relating to the GPG.
“The GPG report was written by the HR Director in response to the requests for action from the board.” (1,000 or more, Private sector)
“There isn’t a GPG specific policy as such, but the People Plan was developed by HR in collaboration with the senior leadership team.” (500 to 999, Private sector)
A variety of approaches were reported when it came to developing GPG actions, ranging from informal to formal. These reflected both the types of actions and strategies adopted and employers’ approach to diagnosing the causes of their GPG (see chapter 6.2).
In most cases, a relatively informal approach was described. This was often accompanied by only a cursory and narrow approach to diagnosing their GPG (or no attempt to diagnose at all). Often the ‘development’ of actions involved re-allocation or re-badging of existing policies, rather than the development of new ones.
Employers who described this less formal approach explained that actions were developed over a period of time through discussion between one or all of the senior management and members of the HR team. Sometimes wider consultation with middle ranking managers also took place, but this was less common. In some cases, the GPG had been added to the agenda of board meetings or was regularly raised by HR staff when they reported to the board.
“The SMT had an away day and this was discussed as part of the development of the staff excellence strategy.” (250 to 499, Private sector)
Although less common, some employers (usually larger and/or public sector) described a more considered, staged approach to development of actions, involving:
- analysis, diagnosis and review of the data
- initial drafting of action ideas
- review of initial ideas by the senior management team and/or equality and diversity committees or groups
- final sign-off following refinement of the initial ideas
As mentioned earlier, actions to tackle the GPG were sometimes developed as part of a wider equality and diversity strategy. The staged approach outlined above sometimes referred to the development of these broader strategies, rather than GPG exclusively. In some cases, the GPG data was described as one of a number of factors influencing the types of actions developed. In others, the GPG was referenced in the strategy (and the impact of new policies on it were considered) but it did not act as a driver for developing the actions.
“There is a comprehensive EandD strategy. The GPG is included in that as a related issue, but it is more of a side note.” (500 to 999, Private sector)
Some employers had used the GPG data and diagnosis to refine or inform some of their actions and policies, although the exact approach to this varied. In most cases, these employers had adopted a relatively cursory approach to diagnosing the causes of their GPG, resulting in only a superficial or high-level understanding and more limited impact on the specific actions developed.
“We looked at what was driving it. It was fairly obvious and so we have thought about the different ways we can be a more attractive place for women to work.” (250 to 499, Private sector)
However, there were occasions where fairly cursory diagnosis had still directly led to specific, ad hoc actions. For example, one employer had introduced mentoring into specific departments, after identifying a lack of women applying for promotions.
Only a minority of employers described clear, direct links between detailed diagnosis of the causes of their GPG and the implementation of specific actions. These were typically larger employers and/or public sector organisations who had adopted a more formal approach to developing actions. They described how equality and diversity committees or working groups had reviewed detailed analysis and set strategic areas to focus on when planning actions.
“The data was important in determining the direction. Everything was overseen by the workforce committee, and that resulted in a focus on bonus payments.” (1,000 or more, Public sector)
Many employers had ultimately decided on the actions they would take based on assessing what was likely to deliver a better working environment, rather than focusing on the GPG in isolation. They were keen to stress that any actions must deliver overall benefits to the workforce and organisation as a whole and fit with wider equality and diversity objectives.
They noted that while certain actions (for example, outsourcing some specific departments) might result in a narrowing of the GPG, they did not want to implement them as they would be detrimental in other ways.
Changes to actions over time
The degree to which actions to tackle the GPG had been reviewed and amended over time varied, depending on the employer and the nature of the actions themselves. However, most employers felt that tackling the GPG was a long-term goal, requiring long-term policies. As such, they did not consider it necessary or beneficial to formally review or change these policies regularly, and described a relatively static situation.
Furthermore, certain policies and practices which would potentially help reduce the GPG were described as long-established and unlikely to change. For example, some employers had been offering flexible working or unconscious bias training for a number of years (before the GPG regulations came into force) and did not expect to remove these actions in the future.
Most employers explained that the actions they had in place would be amended as and when necessary. Among those describing a less formalised approach to taking action, this process of review was rarely said to be regular or consistent. However, the minority of employers who had more formalised plans typically described regular (often annual) reviews. When these actions were part of wider strategy, the timeframe of this strategy was said to determine when the actions were formally reviewed or changed.
“The overall strategic focus will remain the same until the end of the strategic cycle, which is every 5 years.” (250 to 499, Voluntary Sector)
In addition, some employers explained that their approach to tackling the GPG had changed in the past 2 years as they had developed and evolved their understanding of the topic or had time to expand their initial activity. Looking to the future, some employers expected the actions they were taking to continue to grow and develop. In some cases, this was attributed to ongoing momentum around equality and diversity in general (of which the GPG reporting played some part). In other cases, employers were planning to carry out more detailed diagnostics in the future when they had longer-term trend data on their GPG, which they felt could result in more detailed, evidence- based and ambitious actions.
“We will keep an eye on it and as the long-term trends emerge, we will probably do more.” (1,000 or more, Private sector)
Some employers were motivated to identify new or additional actions to close their GPG in order to demonstrate that they were taking the issue seriously. They explained that they intended to review the actions that were published in their accompanying narrative commentary and seek to show that these were evolving over time, in line with the data.
“Nothing has changed so far, but we are open to reviewing and changing in the future. We want to stay ahead of the game and show that we are doing that.” (1,000 or more, Voluntary Sector)
Implementing and monitoring the impact of actions
Most employers in the qualitative sample who had developed actions to close their GPG had already implemented some or all of these. In many cases, these actions had been in place for some time as part of other strategies and initiatives, although in some cases they had been reviewed or refined in light of the GPG results. Only a minority had implemented new actions since the GPG regulations came into force (for example, reviewing policies, started training programs, changing pay structures).
Where planned actions had not yet been (fully) implemented, this was often due to their somewhat aspirational or vague nature (for example, stated intentions to become a more female-friendly working environment). A minority of employers described actions that were timetabled in a broader strategy and therefore not due to be implemented until a later date. For example, one had set out a staged approach to rolling out flexible working. Another was planning to expand the availability of mentoring to different grades in the future, depending on the success of offering it to a smaller cohort first.
“We will see how it goes. But would like to expand the mentoring to lower grades in the next year or so.” (1,000 or more, Private sector)
Others explained that while they had intended to implement certain actions, this had been delayed. These delays were often the result of other priorities taking precedence when employers’ resources were stretched. Similarly, some employers had purposefully not imposed rigid timetables on the implementation of actions because they did not expect to be able to spare the resources to deliver all of them.
“We don’t have any set targets on this type of thing. We know we don’t have the money or people to carry everything out.” (1,000 or more, Public sector)
Most employers monitored the implementation and impact of their GPG actions by keeping track of progress and encouraging relevant stakeholders to meet commitments, implement policies or provide feedback on the success of measures and initiatives. It was often the responsibility of HR teams to either implement the policies themselves or encourage and ‘police’ other managers to do so. As such, many respondents explained that they often discussed actions and initiatives with relevant staff as and when they met through the course of their working lives.
In most cases, the only formal method of evaluating the success of their GPG actions was continuing to calculate their GPG results (as required by the GPG transparency regulations). None of the employers in the qualitative sample had set firm targets for reducing their overall median GPG. Many felt that it was very difficult to predict how their GPG would change in the future and did not want to set unrealistic targets. Furthermore, many employers felt that the measures they had implemented were unlikely to significantly impact their GPG (at least in the short term). They explained that other external factors such as differences in work/life preferences between men and women would ultimately have a greater sway over their GPG, and therefore saw the setting of targets as somewhat unrealistic.
Some employers described a more structured approach to monitoring implementation and impact, including:
- incorporating regular updates on progress of specific actions and the size of the GPG in scheduled board meetings or related committees
- building targets on gender balanced shortlists or mixed interview panels into the objectives and goals of individual managers (forming part of their regular appraisal)
- recording and reporting to the board on gender balance at specific grades or within specific departments
- monitoring the uptake of flexible working, shared parental leave, mentoring programmes, training courses and returner schemes
- conducting staff surveys (including after participation in training or mentoring) to monitor changes in confidence and satisfaction among men and women
- recording and monitoring changes in the gender balance of applications for bonuses and performance rewards
- monitoring the level of success in achieving gender balanced shortlists
Guidance on developing action plans
The most common source of information used by employers to inform their approach to developing actions was the GPG reports, commentaries and action plans produced by other organisations. Some explained that these provided specific examples of actions being taken which they then either emulated or adapted in their own actions.
“The most useful thing was looking at other reports, seeing how bigger companies were looking at their GPG. We didn’t copy them, but it was a good starting point.” (250 to 499, Private sector)
As was seen for diagnosing the causes of their GPG, few employers had used formal external guidance to assist in the development of actions to tackle their GPG. Many had simply not considered doing this or felt that they already had a good idea of what they needed to do. Use of the GEO guidance on producing a GPG action plan was very limited within the qualitative sample, with many employers unaware of it (and one had looked for it but had not been able to find it). The only other formal source mentioned was HMRC, but the respondent could not recall any details of the guidance provided.
Among the minority that had seen it, the GEO guidance was often described as easy to read, not too complicated and well laid out. However, perceptions were typically negative when it came to the content of this guidance. Most felt it was too general and lacked specific details about concrete actions they could take. Others felt that the content was relevant and appropriate but did not offer them anything that they did not already know.
“It was just all a bit obvious really, and quite simplistic.” (250 to 499, Private sector)
“It was fine, It covered everything that you needed and was clear, simple. But it was nothing new.” (1,000 or more, Voluntary Sector)
When asked about the type of guidance that they would find useful, employers often struggled to think of anything. This was either because they did not place a priority on closing their GPG or felt that they already understood what they should be doing (and in some cases were already doing it). However, the following suggestions were made.
The most common suggestion was for detailed and specific examples of measures that could be implemented. Some employers suggested detailed case studies, ideally within their own sector, showing the actions taken by other organisations and how they impacted the GPG. Some added that they would have welcomed easy access to practical advice and direction through seminars or webinars.
Other employers suggested a searchable database of action plans to enable easy access to relevant examples. The ability to filter by sector and size was considered important to ensure relevance.
A means of interacting with other HR professionals and/or experts in gender pay issues would be a useful addition for some employers. They wanted to be able to share ideas, ask questions and seek clarification from people with similar challenges to theirs.
“Some form of knowledge sharing could be good. Possibly training sessions, ideally outside London, or webinars.” (1,000 or more, Voluntary Sector)
Some employers wanted to learn more about how to attract (more) female staff. They felt it was important to better understand what prevents women from applying for certain types of job, in order to develop ways of changing this behaviour. However, they were not sure how easily this could be provided by the government and were often doubtful that such an issue could be addressed at all.
“The real question is how to deal with the underlying attitudes and norms that are contributing to the gap. This is really difficult to address though.” (1,000 or more, Public sector)
Most employers in the qualitative sample expressed a preference for sector-specific guidance. They generally felt that they would be more likely to engage with guidance which they could directly relate to and easily implement. Some added that they operated in sectors facing particular challenges relating to gender pay, and therefore required tailored guidance relating to those.
“It would need to be very specific to the engineering sector as there are issues relating to attracting women into the sector.” (500 to 999, Private sector)
However, some employers felt that guidance that was not sector-specific could still be useful, as long as it was sufficiently granular. They could see that some issues relating to gender pay were likely to be universal. Some added that examples of how organisations in other sectors had tackled the GPG could potentially be applied to their own sector or at least provide a basis for developing more sector-appropriate approaches.
“It’s OK for it to be cross-sector advice, but the ideas need to be specific and definite.” (500 to 999, Private sector)
“You really want best practice examples. That could be within our sector or could be more generally…you can get ideas from both.” (1,000 or more, Public sector)
Most employers suggested that email was the most appropriate and convenient channel through which to receive guidance on tackling the GPG. They explained that email was the method through which they conducted most of their correspondence. However, some noted that hard copy letters were more likely to have an impact and be noticed because they appeared more formal and less commonplace.
“I think they sent a letter to remind us to publish the report. That would be something I would read.” (1,000 or more, Private sector)
Most employers also stressed the importance of including links to the guidance in a prominent position on the GPG portal. They often felt that they would be most open to reading it when they were actively engaging with their own GPG submission (either uploading their data or looking at other employers’ reports).
“There should be something clear on the website. The information on government sites isn’t always up to date, this is where it should always be.” (1,000 or more, Private sector)
Barriers to taking action
A minority of employers in the qualitative sample had not taken any action to address their GPG. In some cases, this was because they did not have a GPG or felt that their GPG was small enough not to be a concern. However, employers with larger GPGs described different reasons for not taking action.
Some did not think that there was anything they could do to address the GPG themselves. They were confident that they already adopted fair and equitable employment approaches but felt they could not influence the number of women interested in particular professions or the propensity of women to leave work to start a family. In some cases, employers described long-established traditional gender bias in their sector which they felt was unlikely to change.
“The industry has a built-in gender bias. There really are simply no women who will do these jobs.” (250 to 499, Private sector)
Some explained that the issue was not a high priority compared with other, more important considerations. They saw closing the GPG as a worthwhile ambition, but not as pressing as other concerns. They usually described an intention to take action in the future.
Reflecting the reasons outlined for active disengagement with closing the GPG, some employers cited their lack of faith in the GPG measure as a reason to not take action. They were often taking action around equality and diversity but rejected the idea of prioritising the GPG as a measure of the success of these actions.
A minority of employers felt constrained in their ability to take action on their GPG. Some noted that they did not have sufficient funds to do so, and they could not afford to divert HR or other resources into developing or monitoring GPG actions. Others noted that the attitude of senior leaders had meant that measures to tackle the GPG were not a high priority. Some described a lack of interest or engagement among senior managers, whereas others described more active scepticism regarding the GPG measure itself.
“There are differences of opinion in the board. Some are more supportive than others. Some are very critical of the way the formulas work…it is difficult to get past that.” (1,000 or more, Private sector)
6.5 Expectations of how their GPG will change over time
All surveyed employers were asked about their expectations of how their GPG would change over the next 5 years and the next 10 years, with results shown in Figure 27.
Figure 27: Employers’ expectations of how their GPG will change in future
| Next 5 years | Next 10 years | |
|---|---|---|
| Get significantly worse | 0% | 0% |
| Get somewhat worse | 3% | 1% |
| Stay roughly the same | 49% | 36% |
| Improve somewhat | 40% | 39% |
| Improve significantly from its current level | 4% | 15% |
Base: all respondents (Base, Don’t know next 5 years, Don’t know next 10 years). Total (900, 5%, 9%).
Approaching half (44%) of employers believed their median GPG would improve over the next 5 years, although few expected a significant improvement (4%). Most of the remainder (49%) thought it would remain similar to its current level, and just 3% anticipated that it would get worse.
Employers were more positive when focussing on the longer-term outlook. 54% expected their GPG to improve over the next 10 years, with 15% predicting significant improvement.
As set out in Table 25, there was no difference in this respect between private and public/voluntary sector organisations. However, those with 500 or more staff were more optimistic about their GPG than smaller employers.
Table 25: Proportion expecting their GPG to improve in future (by sector and size)
| Proportion expecting their GPG to improve | Sector: Private | Sector: Public and voluntary | Size: 250 to 499 | Size: 500 to 999 | Size: 1,000 or more |
|---|---|---|---|---|---|
| Over the next 5 years | 43% | 45% | 40% | 47% | 47% |
| Over the next 10 years | 54% | 54% | 46% | 60% | 62% |
Base: All respondents. Private (390), Public and voluntary (510). 250 to 499 (421), 500 to 999 (221), 1,000 or more (258)
The higher the employer’s current GPG, the more positive they were that this would narrow in future (Table 26).
Table 26: Proportion expecting their GPG to improve in future (by size of GPG)
| Proportion expecting their GPG to improve | Has a GPG: Yes | Has a GPG: No | Size of GPG: More than 20% | Size of GPG: 11% to 20% | Size of GPG: 6% to 10% | Size of GPG: Less than 6% |
|---|---|---|---|---|---|---|
| Over the next 5 years | 54% | 13% | 62% | 56% | 47% | 44% |
| Over the next 10 years | 66% | 18% | 71% | 68% | 60% | 60% |
Base: All respondents. Has a GPG (678), Has no GPG (222). More than 20% (229), 11% to 20% (209), 6% to 10% (115), less than 6% (125)
As detailed in Table 27, employers that had developed actions to address their GPG were more likely to anticipate that it would reduce (58% expected an improvement over 5 years and 72% over 10 years).
Table 27: Proportion expecting their GPG to improve in future (by whether developed actions to address their GPG)
| Proportion expecting their GPG to improve | Taken or planned actions: Yes | Taken or planned actions: No |
|---|---|---|
| Over the next 5 years | 58% | 30% |
| Over the next 10 years | 72% | 36% |
Base: All respondents – Taken/planned actions (488), Not taken/planned actions (412)
Qualitative insight
Future expectations
Finding from the qualitative interviews provide some additional insight into employers’ expectations about how their GPG is likely to change in the future. There was a strong consensus that reducing the GPG is a long-term project for both individual employers and the UK as a whole. Many also felt that they were not in full control of whether their GPG would close, due to the wide range of contributory factors.
“I don’t know what will happen. I would like to think it will come down, but it is largely out of our hands really.” (250 to 499, Private sector)
Most employers felt that it would take time for the measures they had in place to tackle their GPG to take effect. Some explained that these actions relied on the profile of their workforce changing, which was unlikely to happen quickly. Others noted that some actions (for example, offering flexible working and enhanced maternity leave) relied on female staff wanting to take advantage of them, and as a result, deciding to stay in their role and/or seek promotions. This was not something they could control, and therefore very difficult to predict. Indeed, some respondents were somewhat sceptical about the chances of women adopting these different behaviours.
“It is going to take quite a few years to change, and to be honest, it may not change at all unless society changes.” (500 to 999, Private sector)
Some employers explained that they expected their GPG to widen in the short-term. In some cases, they were looking to increase the number of female employees overall and one route was to employ more in junior roles (with a view to developing their skills and encouraging progression in the future). However, they expected this to initially have a negative impact on the average pay of women across their organisation. Others noted that natural staff turnover was likely to result in the loss of senior women, with no guarantee they would be replaced by females.
Help to close the GPG
When asked about what would help them close their GPG, few employers spontaneously suggested (further) government guidance or advice. Instead, many suggested that the government should focus its resources on addressing the underlying, societal issues which contribute to the GPG. For example, some felt that work was required to encourage girls in school to consider a wide range of career options.
“I don’t think guidance is needed. The government should be focused on supporting more diversity overall by encouraging adult learning.” (250 to 499, Private sector)
Addressing the barrier of funding and resources was considered important by a minority of employers. Public sector organisations wanted increased funding overall, which would then enable them to spend more resources diagnosing the causes of their GPG and taking relevant action. Some private sector employers thought that the government could support them best by reducing the tax burden on businesses.
“If the government let us use the apprenticeship levy more effectively and efficiently, that might help us get more female apprentices.” (1,000 or more, Private sector)
Other employers felt that the best way the government could help them reduce their GPG was by changing the way it is calculated. They did not believe that the current measure accurately reflected their approach to gender equality and felt that an alternative approach would reveal them to have a better GPG.
“I can’t think what they could do. Change the figures and how they are reported maybe. If it was a mean figure, not a median that would be better.” (1,000 or more, Private sector)
While few mentioned additional guidance, there were some suggestions specifically around help to develop GPG actions (as described in chapter 6.4).
7. Future GPG measurement and reporting
This chapter looks at employers’ plans and views in relation to the future GPG reporting requirements. Specifically, it covers:
- intentions around publishing their next set of GPG data
- perceived usefulness of the GPG metrics employers are required to report
7.1 Expected publication date for 2019 GPG data
Large employers will be required to publish their 2019 GPG data by 4 April 2020 (or 30 March 2020 in the case of public sector organisations).
As set out in Figure 28 below, at the time of the survey the majority of employers (73%) did not intend to publish their next set of GPG data until the final quarter of the reporting period (January 2020 or later). More specifically, a third (32%) only intended to publish in the week before the deadline.
This clearly demonstrates that many employers will continue to work towards the regulatory deadline rather than choosing to publish earlier. It is consistent with the findings reported in chapter 4.2, which show that those employers who did not publish their 2018 data until the final month had typically always planned to publish around this time (rather than aiming for an earlier date but being delayed).
Figure 28: Planned publication date for 2019 GPG data
| Percentage | |
|---|---|
| Not decided or don’t know | 9% |
| Jan to Apr 2020 | 73% |
| - In the week before the deadline (late March) | 32% |
| - Around 2 weeks before (mid March) | 15% |
| - 2 to 4 weeks before (early March) | 11% |
| - 2 to 3 months before (January or February) | 16% |
| Oct to Dec 2019 | 12% |
| Jul to Sep 2019 | 5% |
| Apr to Jun 2019 | 1% |
Base: all respondents (Base, do not intend to publish). Total (900, less than 0.5%).
Surveyed employers expected to publish their next set of GPG data earlier than they had done previously. Only 12% published their 2018 data before March 2019, but 33% intended to publish their 2019 data before March 2020. However, respondents in previous waves of this survey also predicted an earlier reporting trajectory but this did not materialise (suggesting a degree of social desirability bias whereby respondents provide an overly positive estimate of their likely publication date). As such, the final reporting timelines for the 2019 GPG data are likely to be closer to those seen in the previous year.
Table 28 shows that similar proportions of private and public/voluntary sector organisations intended to publish their 2019 data in the final quarter of the reporting period (74% and 70% respectively). However, the former were more likely to leave this until the week before the deadline (35% compared with 26%).
The planned reporting trajectory was also similar for each employer size, although those with 1,000 or more staff were less likely to expect to publish in the final week.
Table 28: Planned publication date for 2019 GPG data (by sector and size)
| Sector: Private | Sector: Public and voluntary | Size: 250 to 499 | Size: 500 to 999 | Size: 1,000 or more | |
|---|---|---|---|---|---|
| Apr-Jun 2019 | 1% | 1% | 1% | 0% | 1% |
| Jul-Sep 2019 | 5% | 7% | 5% | 7% | 5% |
| Oct-Dec 2019 | 12% | 13% | 12% | 10% | 14% |
| Jan-Apr 2020 | 74% | 70% | 75% | 76% | 69% |
| - 2 to 3 months before deadline (Jan/Feb) | 15% | 17% | 14% | 16% | 18% |
| - 2 to 4 weeks before deadline (early March) | 10% | 12% | 12% | 8% | 11% |
| - Around 2 weeks before deadline (mid March) | 15% | 15% | 15% | 16% | 14% |
| - In the week before deadline (late March) | 35% | 26% | 34% | 36% | 27% |
| Not decided or don’t know | 9% | 9% | 8% | 7% | 11% |
| Do not intend to publish | 0% | 0% | 0% | 0% | 0% |
Base: All respondents. Private (390), Public and voluntary (510). 250 to 499 (421), 500 to 999 (221), 1,000 or more (258)
Just 2 of the 900 surveyed employers (equating to less than 1% of the sample) did not intend to publish their 2019 results at all. When asked for their reasons, both of these organisations indicated that they would not be required to do so because they had fewer than 250 employees at the latest GPG snapshot date.[footnote 15]
7.2 Perceptions of GPG metrics
When asked their views on the metrics that they were required to report under the regulations, the proportion of women in each pay quartile was felt to be most valuable (84% described this as either very or fairly useful). Over two-thirds (69%) also found the differences in mean/median hourly rate useful but there was less consensus on the metrics relating to bonuses. 57% felt the proportion paid bonuses was useful and 50% found the differences in bonus pay useful.
Figure 29: Perceived usefulness of the current GPG metrics
| Not at all useful | Not very useful | Fairly useful | Very useful | |
|---|---|---|---|---|
| Differences in mean and median hourly rate | 8% | 21% | 56% | 13% |
| Proportion of women in each pay quartile | 4% | 10% | 46% | 37% |
| Proportion of men and women paid bonuses | 18% | 19% | 35% | 22% |
| Differences in mean and median bonus pay | 19% | 25% | 37% | 13% |
Base: all respondents (Base, Don’t know). Total (900, 3%, 2%, 6%, 7%).
As shown in Figure 30, there has been no change in perceptions of the various metrics since the 2018 survey.
Figure 30: Proportion rating each GPG metric as useful (over time)
| 2018 survey | 2019 survey | |
|---|---|---|
| Differences in mean and median hourly rate | 66% | 69% |
| Proportion of women in each pay quartile | 84% | 84% |
| Proportion of men and women paid bonuses | 57% | 57% |
| Differences in mean and median bonus pay | 52% | 50% |
Base: all respondents (2018, 2019). Total (900, 900).
Table 29 shows that public and voluntary sector employers tended to be more positive than those in the private sector about the value of the mean/median hourly rate and proportion of women in each pay quartile. However, they were less likely to describe the 2 metrics on bonuses as useful, perhaps reflecting the lower use of bonuses in these sectors. Employers with 1,000 or more staff were more likely to view each of the 4 metrics as useful. This is consistent with the pattern seen in the 2018 survey.
Table 29: Perceived usefulness of the current GPG metrics (by sector and size)
| Proportion rating as very or fairly useful | Sector: Private | Sector: Public and voluntary | Size: 250 to 499 | Size: 500 to 999 | Size: 1,000 or more |
|---|---|---|---|---|---|
| Differences in mean and median hourly rate | 67% | 76% | 64% | 71% | 76% |
| Proportion of women in each pay quartile | 82% | 89% | 79% | 88% | 88% |
| Proportion of men and women paid bonuses | 63% | 39% | 51% | 59% | 66% |
| Differences in mean and median bonus pay | 54% | 38% | 46% | 49% | 57% |
Base: All respondents. Private (390), Public and voluntary (510). 250 to 499 (421), 500 to 999 (221), 1,000 or more (258)
Those employers who had a GPG were comparatively more likely to rate the proportion of women in each pay quartile as a useful metric (86% compared with 75% of those with no GPG). However, there were no differences in this respect on the other metrics.
Qualitative insight
While not covered in detail in the qualitative interviews, concerns about the GPG metrics were raised by a minority of employers. Some felt that the overall approach of providing a headline, average figure was too blunt to reflect the complexity of their workforce. Large businesses employing a range of different types of employees sometimes felt it important to report their figures on a division-by-division basis, to demonstrate that their overall GPG was driven (and explained) by certain areas.
Others felt that the figures were distorted by being based on a single snapshot date, by excluding salary sacrifices from the annual pay of some workers (who were often female) and by including temporary workers in the results.
“The data really isn’t reliable. It is just based on that one moment in the year. That doesn’t show all the differences in our workforce over time.” (250 to 499, Private sector)
8. Wider equality and diversity measures
This chapter looks at employers’ approach to equality and diversity more widely, including the collection of ethnicity data from their workforce.
Table 30 shows that 80% of large employers provided information or resources to staff wishing to discuss race-ethnicity issues, and most (62%) also had a senior leader responsible for diversity. However, fewer than half (44%) had a specific staff network focussed on diversity and inclusion. All of these equality and diversity measures were more commonplace in the public and voluntary sectors and within larger organisations.
Table 30: Wider equality and diversity measures in place
| Total | Sector: Private | Sector: Public and voluntary | Size: 250 to 499 | Size: 500 to 999 | Size: 1,000 or more | |
|---|---|---|---|---|---|---|
| A staff network focused on diversity and inclusion in the workplace | 44% | 39% | 58% | 36% | 38% | 62% |
| A senior leader responsible for promoting diversity | 62% | 58% | 71% | 54% | 63% | 73% |
| Information or resources for staff who wish to discuss issues related to race-ethnicity in the workplace | 80% | 77% | 88% | 76% | 83% | 85% |
Base: All respondents – Total (900). Private (390), Public and voluntary (510). 250 to 499 (421), 500 to 999 (221), 1,000 or more (258)
Two-thirds (64%) of surveyed employers requested ethnicity data from their workforce, with this proportion increasing among the public/voluntary sector and those with 1,000 or more staff. In almost all of these cases a ‘prefer not to say’ option was included.
Table 31: Proportion that request ethnicity data from their workforce
| Total | Sector: Private | Sector: Public and voluntary | Size: 250 to 499 | Size: 500 to 999 | Size: 1,000 or more | |
|---|---|---|---|---|---|---|
| Request ethnicity data | 64% | 56% | 87% | 60% | 62% | 71% |
| - Option for people to declare they ‘prefer not to say’ | 59% | 50% | 85% | 55% | 55% | 68% |
| - No option for people to declare they ‘prefer not to say’ | 2% | 3% | 1% | 2% | 3% | 1% |
| - Don’t know | 3% | 3% | 1% | 3% | 3% | 2% |
| Do not request ethnicity data | 32% | 39% | 11% | 34% | 36% | 25% |
| Don’t know if request ethnicity data | 4% | 5% | 2% | 6% | 3% | 4% |
Base: All respondents – Total (900). Private (390), Public and voluntary (510). 250 to 499 (421), 500 to 999 (221), 1,000 or more (258)
9. Conclusions
In summary, this research shows that the process of complying with the GPG regulations has become easier and less burdensome. Employers have become more familiar with the requirements and now have established process in place to meet these.
The impact of the transparency regulations on understanding of the GPG has continued. Following a significant uplift when the regulations came into force, levels of understanding have risen further and almost all of those responsible for their organisation’s GPG reporting now have good knowledge.
The GPG engagement levels reported in 2018 have been sustained, in terms of both overall priority and senior-level interest/involvement in the topic. The regulations have also prompted or contributed to an increase in engagement with wider equality and diversity issues.
However, the nature of this engagement remains inconsistent. While some employers are genuinely striving to diagnose and address their GPG, others have a more defensive mindset and are instead primarily focussed on explaining and justifying their results. This situation is relatively static, and changes in underlying attitudes are rare.
As yet, only half of employers have developed any actions to close their GPG, although there are signs that this has increased over the last year. However, it is important to note that these actions have rarely been developed with the sole objective of addressing their GPG. Rather, they are often connected to wider priorities around equality and diversity (with an improved GPG one of a number of desired outcomes). While the GPG reporting regulations have contributed to this, the development of dedicated, GPG-specific actions remains uncommon.
Employers typically feel that they are already placing an appropriate level of priority on the GPG (and doing all they can to address it). Many believe it is largely outside their control, and rather than the government trying to encourage/facilitate employers to do more, it should instead focus on addressing the wider societal and cultural drivers of the GPG.
However, there is evidence that some employers have not considered all of the factors contributing to their GPG and instead assume that they know the causes (often external factors) without undertaking detailed diagnosis. This can prohibit them from taking (more) action. As such, there is still a need to further educate and inform some employers through appropriate guidance.
While guidance can play a role, this needs to be as specific as possible and include concrete examples of how employers can make a difference (for example, real actions taken by other organisations in their sector).
-
‘The Equality Act 2010 (Gender Pay Gap Information) Regulations 2017’ for the private/voluntary sector and ‘The Equality Act 2010 (Specific Duties and Public Authorities) Regulations 2017’ for the public sector. ↩
-
The median is used for the headline GPG figure, although the mean is also used in some cases. The median is the mid-point value and hence represents the typical GPG, whereas the mean represents the average value. The mean can be skewed by small numbers of very high values, so the median is used for the headline figure. ↩
-
Based on Office for National Statistics analysis of median earnings for all employees (full and part time): Gender pay gap in the UK: 2018 ↩
-
Employers must publish their data on their own public-facing website and on the government portal: Gender pay gap reporting: guidance for employers - GOV.UK ↩
-
Employers’ Understanding of the Gender Pay Gap and Actions to Tackle it: research report on the 2018 Survey - GOV.UK ↩
-
The deadline for reporting their GPG data was 4 April 2019 for private and voluntary sector employers and 30 March 2019 for public sector employers. However, a number of employers submitted (or amended) their results after this point, so the final sample frame was drawn on 4 June to allow coverage of this group. ↩
-
Calculated at the 95% level of confidence and showing the ‘worst case’ scenario of 50% of the sample answering in the same way. ↩
-
Strictly speaking, calculations of statistical significance apply only to samples that have been selected using a probability sampling design. However, in practice it is reasonable to assume that these calculations provide a good indication of significant differences for quota sampling (as used for this research). ↩
-
The questionnaire also included options for ‘Had not heard of the gender pay gap’ and ‘Have heard the term but don’t know anything about it’ but, if selected, the interviewer sought a referral to someone better placed to answer the survey questions (and the interview terminated if this was not possible). ↩
-
The survey sample was de-duplicated to avoid calling the same individual/organisation on multiple occasions, and in cases where the same contact details were listed for more than one organisation only one of these records was retained. This was most likely to affect organisations that reported separately for different subsidiaries, so the results in Figure 5 may under-represent this group. ↩
-
This question was not asked to those who modified their results after first submitting them, as this group were instead asked why they had needed to modify their results (as reported later in this chapter). ↩
-
Employers that did not have a GPG were asked to rate the priority of ensuring they continued to have no GPG in future. ↩
-
The most common other actions mentioned were assessing their applicant pool (5%) and running further analysis of their GPG results including by age, length of service, ethnicity (4%). ↩
-
5 April 2019 for private/voluntary sector employers and 30 March 2019 for public sector employers. ↩