eNews Article: GAD contributes data for mortality tables
Published 26 October 2018

© Crown copyright 2018
This publication is licensed under the terms of the Open Government Licence v3.0 except where otherwise stated. To view this licence, visit nationalarchives.gov.uk/doc/open-government-licence/version/3 or write to the Information Policy Team, The National Archives, Kew, London TW9 4DU, or email: psi@nationalarchives.gov.uk.
Where we have identified any third party copyright information you will need to obtain permission from the copyright holders concerned.
This publication is available at https://www.gov.uk/government/publications/enews-from-gad-issue-33-october-2018--2/enews-article-gad-contributes-data-for-mortality-tables
GAD contributes data for mortality tables
Unprecedented levels of public sector pension data have been included in the latest Continuous Mortality Investigation (CMI) analysis of mortality rates for retired pension scheme members. GAD has contributed to bringing parties together, and to carefully preparing and anonymising the data. This example shows the potential for benefits for both public and private sectors, if responsible methods for sharing sensitive data can be found.
What analysis has been undertaken?
The CMI’s self administered pension schemes (“SAPS”) experience project produces impartial analysis of how long pensioners live. They construct tables of mortality rates and other practical tools which are widely used by actuaries to value pension scheme liabilities, inform decisions around how benefits are to be funded and also in setting prices for and managing life insurance products. The CMI is owned and run by the UK actuarial profession, the Institute and Faculty of Actuaries.
The public sector data, together with similar data from medium size and larger private sector schemes, has been used to prepare new “S3” series tables. Analysis by the Pensions Regulator in June 2018 showed that more than 90% of recent pension valuations used the existing CMI SAPS mortality series. CMI’s consultation for registered users on its initial draft versions of the tables closed in mid September.
How was the data managed?
Only a subset of the detailed information pension scheme administrators hold about members is needed for CMI’s analysis, eg date of birth, and size of pension. For the subset of public sector pension schemes who agreed to share data, GAD was careful to ensure that its submission was limited to essential information and appropriately anonymised and compliant with our duties under the EU General Data Protection Regulation (GDPR). The key steps taken included:
- Removing individual and scheme identifiers
- Rounding birthdays and other dates to nearest month
- Using a dummy value in place of the largest pensions
What are the potential benefits?
The additional data submitted by GAD has notably increased the amount of data used to prepare the S3 tables compared to the existing S1 and S2 tables. The chart above compares the amounts-weighted exposures each table is derived from, broadly the amounts of pension paid to members of the schemes included.
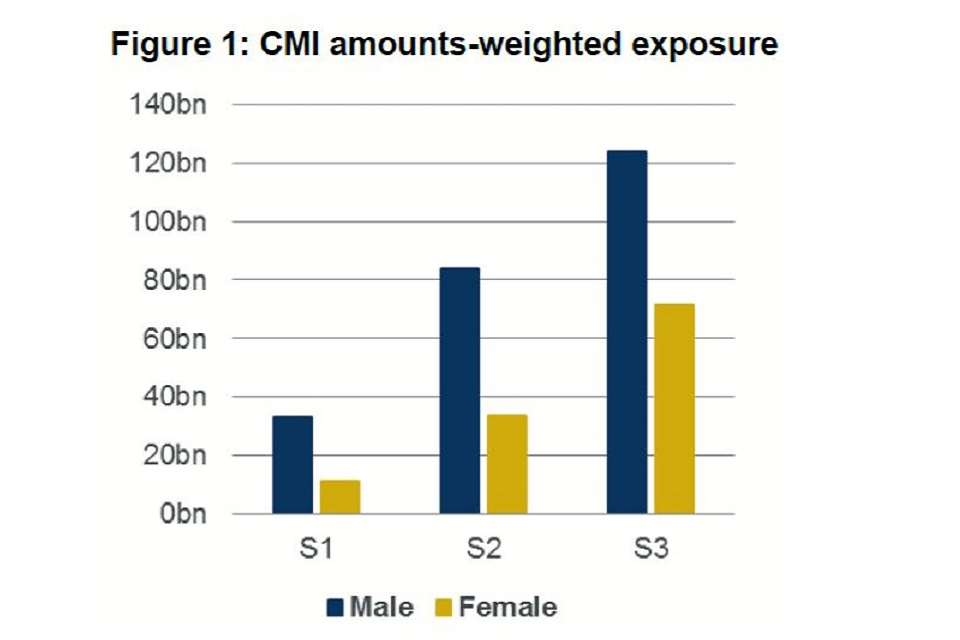
Figure 1: CMI amounts-weighted exposure
What is the benefit of this increased pool of underlying evidence? Consider projecting the pattern of future cash flows for a group of individuals in a given pension scheme or group of life insurance policies. This requires numerous assumptions, including for the pattern of future lifespans of the particular group of individuals. These patterns vary across different workforces but also over time, as the CMI have found via examining the SAPS data. Hence only relatively recent data on length of life can be used, but even for large schemes this means too little data to derive reliable mortality rates. So actuaries typically scale an appropriate SAPS table to produce rates that match the expected level of future mortality. The greater volume of data has allowed CMI to produce a more extensive selection of tables. This provides a better ability to create assumptions to reflect different expected future patterns. This is helpful to inform decisions having a permanent effect on future cashflows, for example improving pension scheme benefits or setting a level premium to be paid for the lifetime of a given life insurance policy.
Potential benefits if sensitive data can be shared safely and appropriately are not limited to pensions. NHS patient records are another example. If you would like to discuss these issues further, please get in touch.