COVID-19 confirmed deaths in England (to 31 December 2020): report
Updated 28 April 2023

© Crown copyright 2023
This publication is licensed under the terms of the Open Government Licence v3.0 except where otherwise stated. To view this licence, visit nationalarchives.gov.uk/doc/open-government-licence/version/3 or write to the Information Policy Team, The National Archives, Kew, London TW9 4DU, or email: psi@nationalarchives.gov.uk.
Where we have identified any third party copyright information you will need to obtain permission from the copyright holders concerned.
This publication is available at https://www.gov.uk/government/publications/covid-19-reported-sars-cov-2-deaths-in-england/covid-19-confirmed-deaths-in-england-to-31-december-2020-report
COVID-19 deaths
Public Health England has published national statistics on deaths in people with laboratory-confirmed COVID-19 since 29 April 2020. In this report we present the latest data on COVID-19 mortality. Further information on the data series can be found here.
Data sources
Laboratory diagnoses of COVID-19 (pillar 1 and 2) were derived from SGSS cases resident in England.
Fact and date of death were derived from combined sources: NHS England hospital deaths, Office for National Statistics death registrations, PHE HPT direct reporting, DBS tracing of laboratory-confirmed cases.
Definitions
In this report deaths are defined as:
- a death in a person with a laboratory-confirmed positive COVID-19 test and either died within 60 days of the first specimen date
or
- died more than 60 days after the first specimen date, only if COVID-19 is mentioned on the death certificate
This data does not include deaths in people where COVID-19 is suspected but not confirmed by testing (SARS-CoV-2 testing either negative or not done).
This data does not report cause of death, and as such represents deaths in people with COVID-19 and not necessarily caused by COVID-19.
In this report, data is reported to 31 December 2020. The first wave of the epidemic in England is defined as the period up to week 27 (from 30 January to 28 June 2020).
Mortality rate is calculated using 2019 ONS population estimates data.
Age-standardised rates adjust for differences in the age structure of populations. The standard used throughout this report is the European Standard Population 2013.
Limitations
Comparisons between the first wave of the epidemic and the time following this should be interpreted with caution considering:
- changes in testing coverage and detection rate of COVID-19 infections:
- the first wave of the epidemic was associated with very limited case detection, therefore with a very limited number of COVID-19 cases being confirmed.
- due to relatively unconstrained testing laboratory capacity following the first wave of the epidemic, far more cases have been detected and confirmed
- changes in demographics of infected population
- changes in the effectiveness of treatment and health systems ability to care for severe COVID-19 cases
COVID-19 mortality rates
Within the period from 30 January to 31 December 2020, 2,280,658 cases of COVID-19 have been detected in England.
In the same period, there have been 72,178 deaths in persons with laboratory-confirmed COVID-19, with the first death occurring on 2 March 2020. This represents a mortality rate of 128.2 per 100,000 population.
Data from the first wave of the pandemic (to week 27) and the period of after the first wave (week 27 onwards) covers different lengths of time, therefore, comparisons should consider this.
Table 1. Total number of deaths in laboratory-confirmed cases of COVID-19*†
| Cases | Deaths† | |
|---|---|---|
| First Wave (Up to week 27) | 242,763 | 39,005 |
| After First Wave (Week 27 onwards) | 2,037,895 | 33,173 |
| Total* | 2,280,658 | 72,178 |
*Data is presented from 30 January to 31 December 2020. Due to continuous data quality improvements, the number of cases may be subject to fluctuations.
†Deaths within 60 days of a positive COVID-19 test or where COVID-19 is mentioned on the death certificate.
During the epidemic in England:
- the highest peak recorded in daily deaths was 975 (1.73 per 100,000 population) during the first wave of the epidemic (to week 27)
- from week 27 we have seen a high of 545 (0.97 per 100,000 population) daily deaths.
Figure 1.a. Number of deaths in laboratory-confirmed cases of COVID-19 by date of death*†
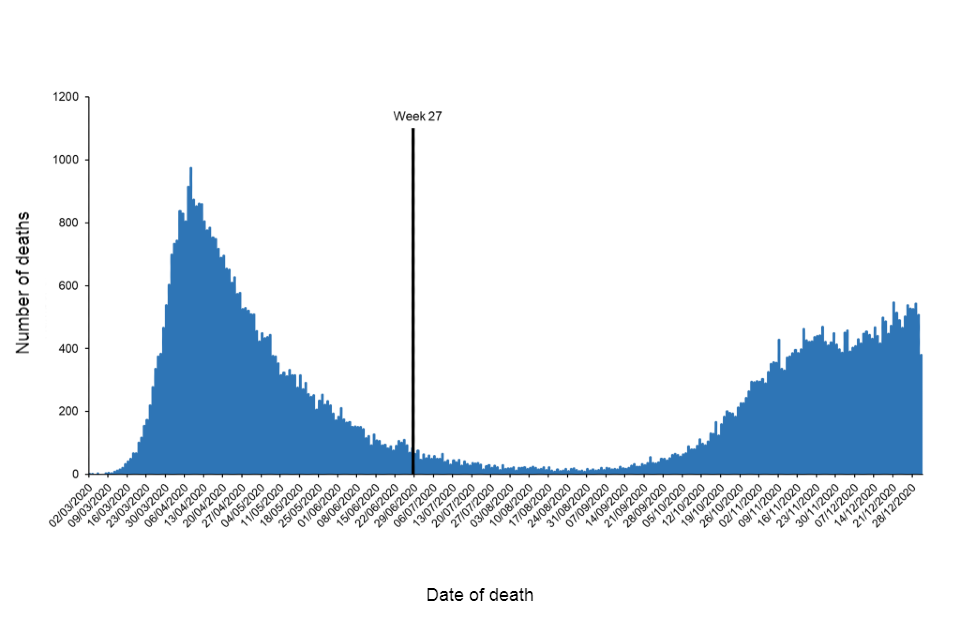
*Data is presented from 30 January to 31 December 2020.
†Deaths within 60 days of a positive COVID-19 test or where COVID-19 is mentioned on the death certificate.
Figure 1.b. Number of deaths in laboratory-confirmed cases of COVID-19 by date of death, December 2020*†
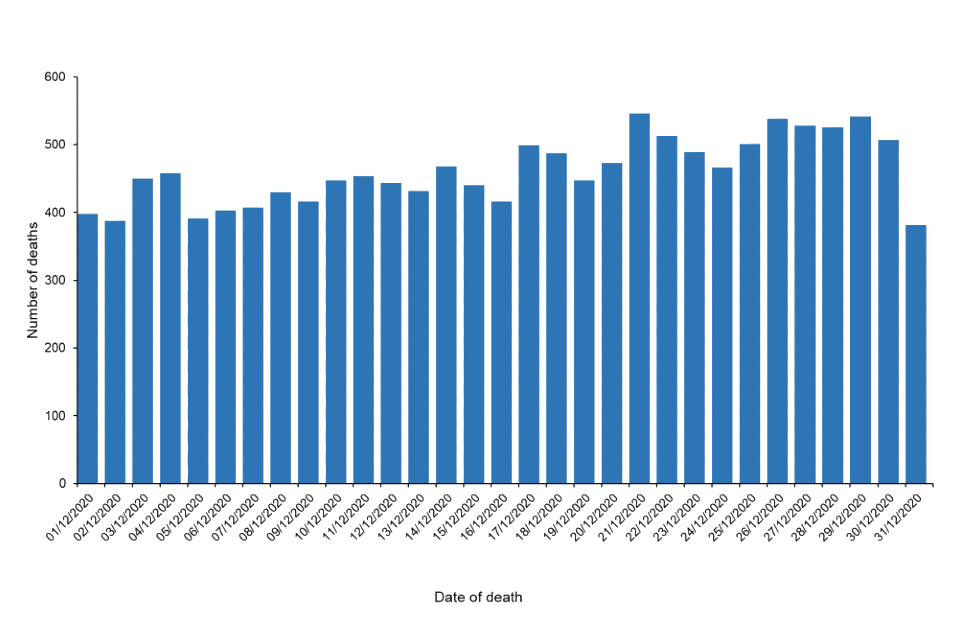
†Deaths within 60 days of a positive COVID-19 test or where COVID-19 is mentioned on the death certificate
Age and sex distribution
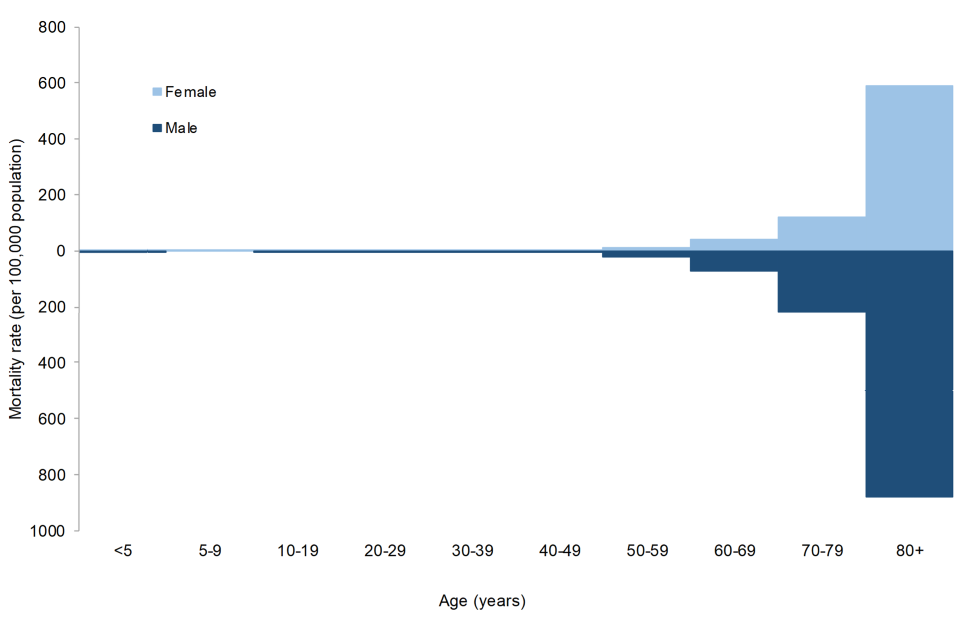
Mortality rate has been shown to be highest among those aged over 80 (1,513.1 per 100,000 population).
Table 2. Total number of deaths and mortality rate (per 100,000 population) in laboratory-confirmed cases of COVID-19, by age group†
| Age | Deaths | Mortality rate |
|---|---|---|
| <5 | 10 | 0.3 |
| 5-9 | 3 | 0.1 |
| 10-19 | 34 | 0.5 |
| 20-29 | 110 | 1.5 |
| 30-39 | 314 | 4.2 |
| 40-49 | 1,017 | 14.3 |
| 50-59 | 3,239 | 42.7 |
| 60-69 | 7,381 | 124.9 |
| 70-79 | 17,144 | 363.2 |
| 80+ | 42,926 | 1,513.1 |
| Total | 72,178 | 128.2 |
*Data is presented from 30 January to 31 December 2020.
†Deaths within 60 days of a positive COVID-19 test or where COVID-19 is mentioned on the death certificate.
Overall, 40,498 (145.5 per 100,000) deaths have occurred in males and 31,679 (111.3 per 100,000) in females.
Table 3. Total number of deaths and mortality rate (per 100,000 population) in laboratory-confirmed cases of COVID-19, by sex*†
| Sex | Deaths | Mortality rate |
|---|---|---|
| Female | 31,679 | 111.3 |
| Male | 40,498 | 145.5 |
*Data is presented from 30 January to 31 December 2020.
†Deaths within 60 days of a positive COVID-19 test or where COVID-19 is mentioned on the death certificate.
Figure 2.a. Mortality rate in laboratory-confirmed cases of COVID-19, by age and sex*†
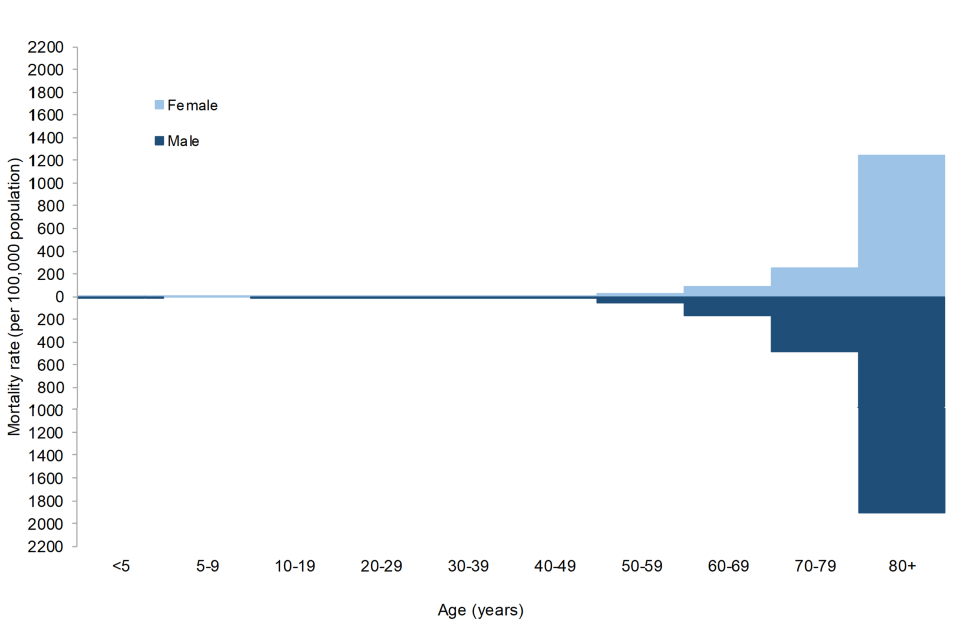
*Data is presented from 30 January to 31 December 2020.
†Deaths within 60 days of a positive COVID-19 test or where COVID-19 is mentioned on the death certificate.
Figure 2.b. Mortality rate in laboratory-confirmed cases of COVID-19 (up to week 27), by age and sex*†
*Data is presented up to week 27 (from 30 January to 28 June 2020).
†Deaths within 60 days of a positive COVID-19 test or where COVID-19 is mentioned on the death certificate.
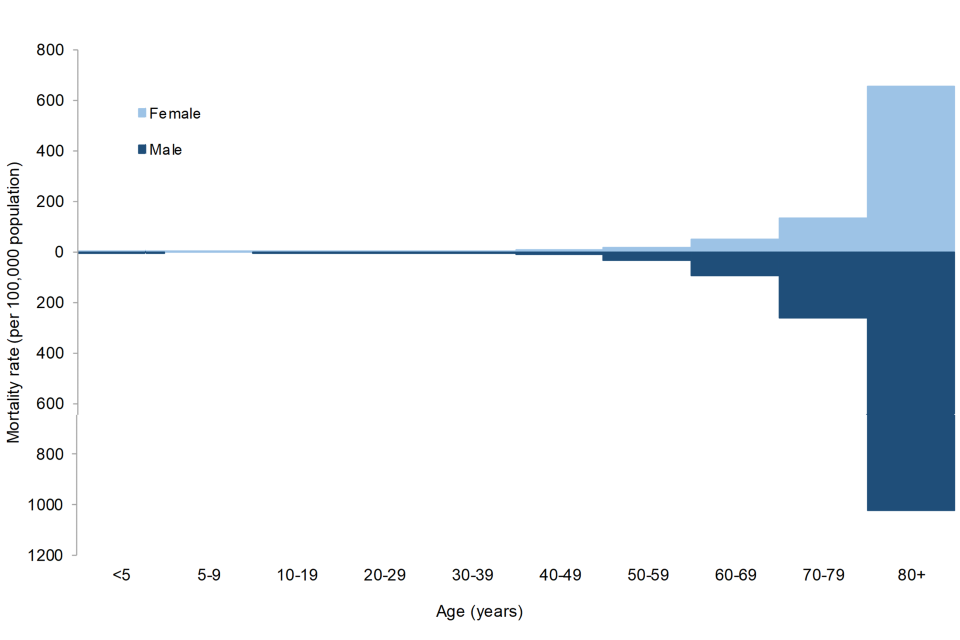
Figure 2.c. Mortality rate in laboratory-confirmed cases of COVID-19 from week 27 onwards, by age and sex*†
Note: Please note the difference in scale between Figure 2, Figure 2.a. and Figure 2.b.
*Data is presented from week 27 onwards (from 29 June to 31 December 2020).
†Deaths within 60 days of a positive COVID-19 test or where COVID-19 is mentioned on the death certificate.
Figure 3.a. Seven-day rolling average mortality rates in laboratory-confirmed cases of COVID-19, by age group†
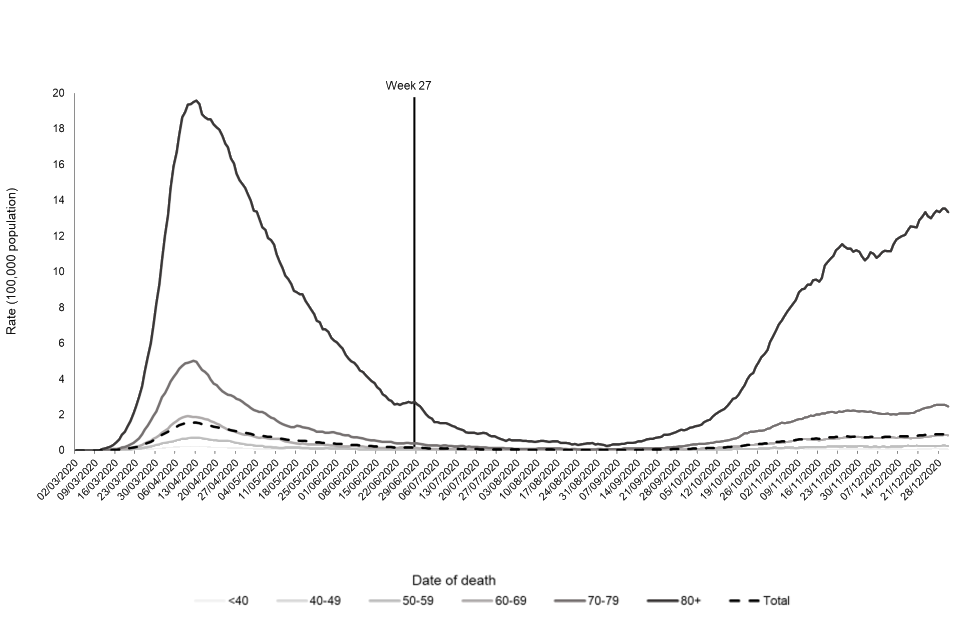
*Data is presented from 30 January to 31 December 2020.
†Deaths within 60 days of a positive COVID-19 test or where COVID-19 is mentioned on the death certificate.
Figure 3.b. Seven-day rolling average mortality rates in laboratory-confirmed cases of COVID-19 (in December 2020), by age group†
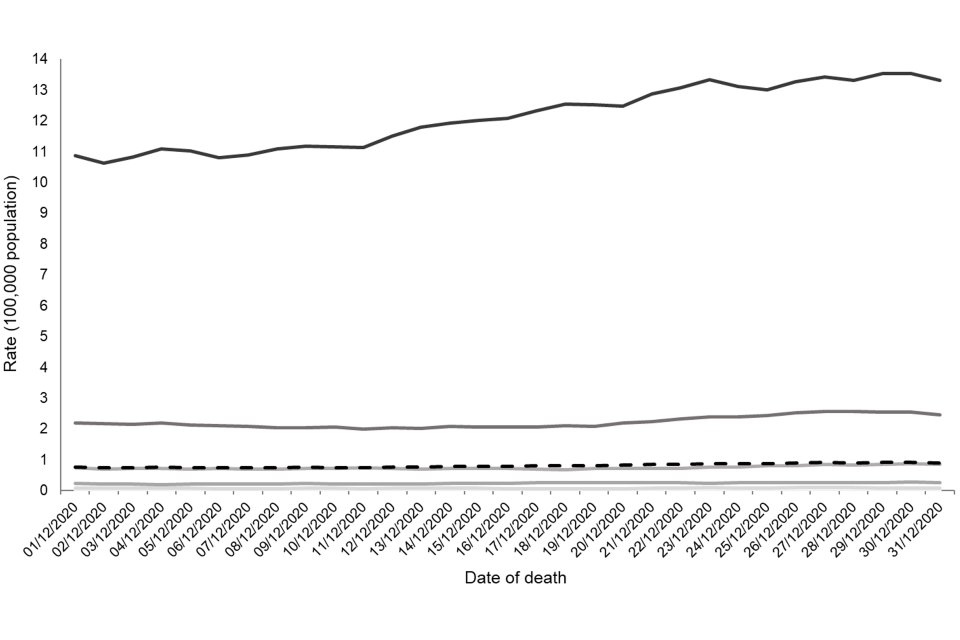
†Deaths within 60 days of a positive COVID-19 test or where COVID-19 is mentioned on the death certificate.
Ethnicity
Overall, the age-adjusted mortality rate is highest among those of Other ethnicity (684 per 100,000) followed by those of Black/Black British ethnicity (273 per 100,000). Although 87.5% deaths have been reported among those of white ethnicity, the age-adjusted mortality rate is lowest among those of White ethnicity (126 per 100,000).
Table 4. Total number of deaths and age-adjusted mortality rate (per 100,000 population) in laboratory-confirmed cases of COVID-19, by ethnicity†*
| Ethnic category | Deaths | Age-adjusted mortality rate |
|---|---|---|
| White | 63,142 | 126 (105.0-150.0) |
| Black / Black British | 2,191 | 273 (241.6-307.4) |
| Asian / Asian British | 4,542 | 266 (235.0-300.0) |
| Mixed | 350 | 142 (119.6-167.4) |
| Other** | 1,214 | 684 (633.7-737.2) |
| Unknown | 739 | - |
| Total | 72,178 | 134 (112.3 - 158.7) |
*Data is presented from 30 January to 31 December 2020.
**Ethnic categories are based on ONS classifications.
†Deaths within 60 days of a positive COVID-19 test or where COVID-19 is mentioned on the death certificate.
Figure 4.a. Seven-day rolling average mortality count in laboratory-confirmed cases of COVID-19, by ethnicity*†
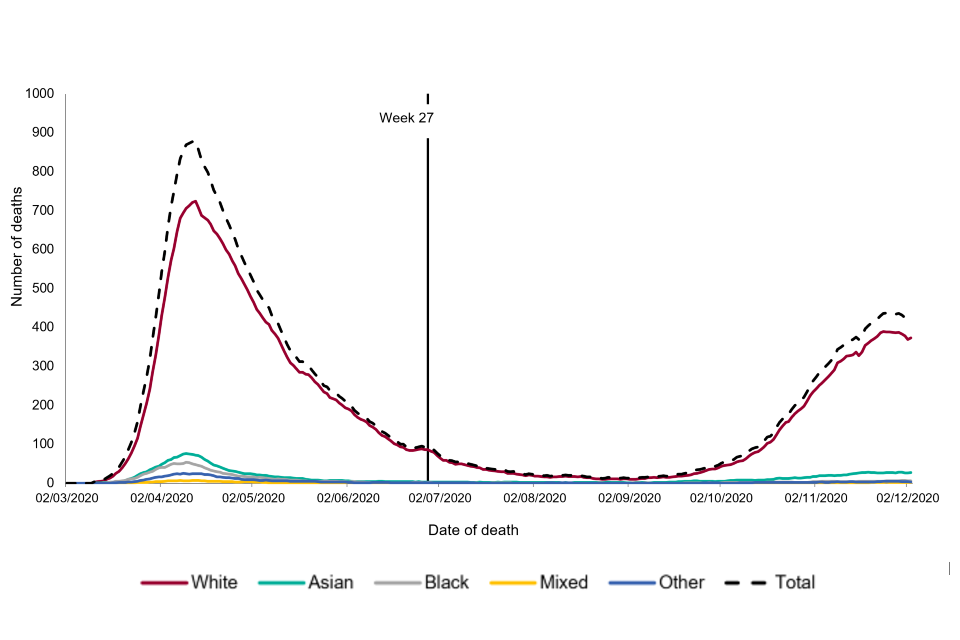
*Data is presented from 30 January to 31 December 2020.
†Deaths within 60 days of a positive COVID-19 test or where COVID-19 is mentioned on the death certificate.
Figure 4.b. Seven-day rolling average mortality count in laboratory-confirmed cases of COVID-19 (in December 2020)†, by ethnicity
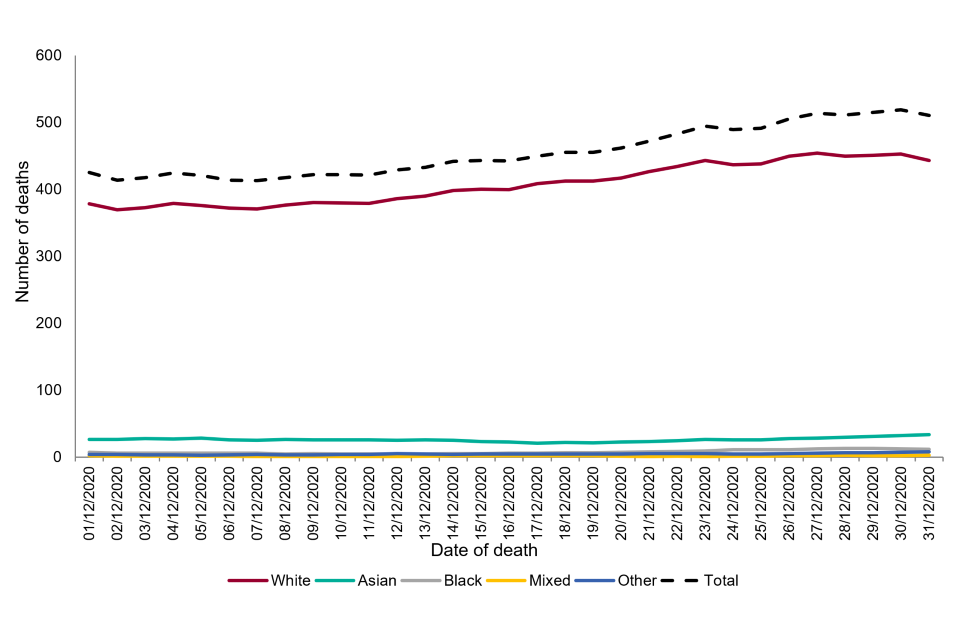
†Deaths within 60 days of a positive COVID-19 test or where COVID-19 is mentioned on the death certificate.
Regional breakdown
Table 5. Total number of deaths and mortality rate (per 100,000 population) in laboratory-confirmed cases of COVID-19, by PHE Centre*†
| PHE Centre | Deaths | Mortality rate |
|---|---|---|
| East Midlands | 6,641 | 137.3 |
| East of England | 7,270 | 111.8 |
| London | 9,437 | 105.3 |
| North East | 4,584 | 171.7 |
| North West | 13,382 | 182.3 |
| South East | 9,040 | 101.5 |
| South West | 3,755 | 66.8 |
| West Midlands | 8,947 | 150.8 |
| Yorkshire and Humber | 8,507 | 154.6 |
| Unknown | 615 | - |
| Total | 72,178 | 128.2 |
*Data is presented from 30 January to 31 December 2020.
†Deaths within 60 days of a positive COVID-19 test or where COVID-19 is mentioned on the death certificate.
Figure 5.a. Seven-day rolling average mortality rates in laboratory-confirmed cases of COVID-19, by PHE Centre*†
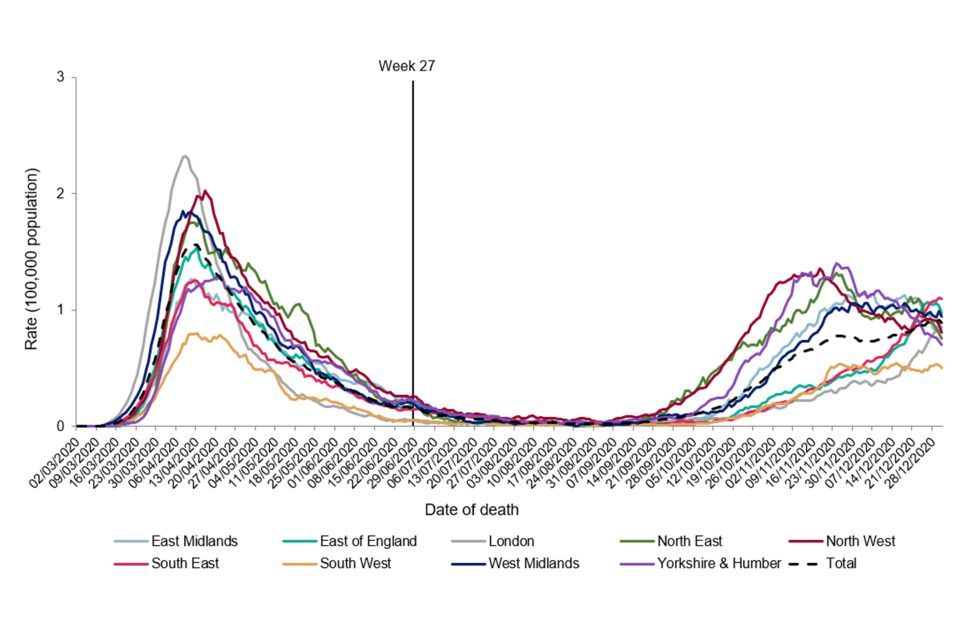
*Data is presented from 30 January to 31 December 2020.
†Deaths within 60 days of a positive COVID-19 test or where COVID-19 is mentioned on the death certificate.
Figure 5.b. Seven-day rolling average mortality rates in laboratory-confirmed cases of COVID-19 in December 2020, by PHE Centre†
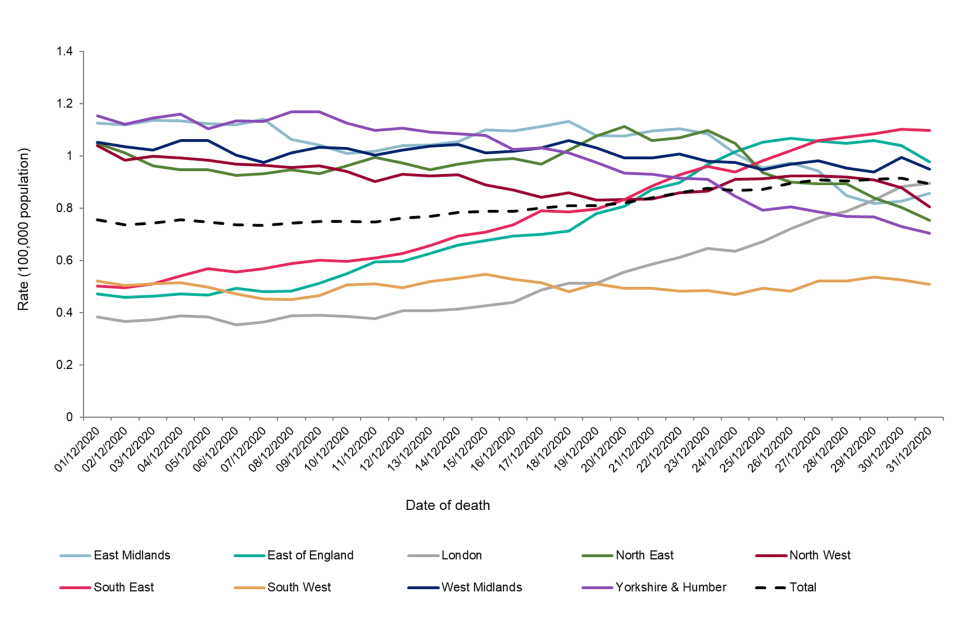
†Deaths within 60 days of a positive COVID-19 test or where COVID-19 is mentioned on the death certificate.
Figure 6.a. Mortality rates in laboratory-confirmed cases of COVID-19, by upper-tier local authority*†
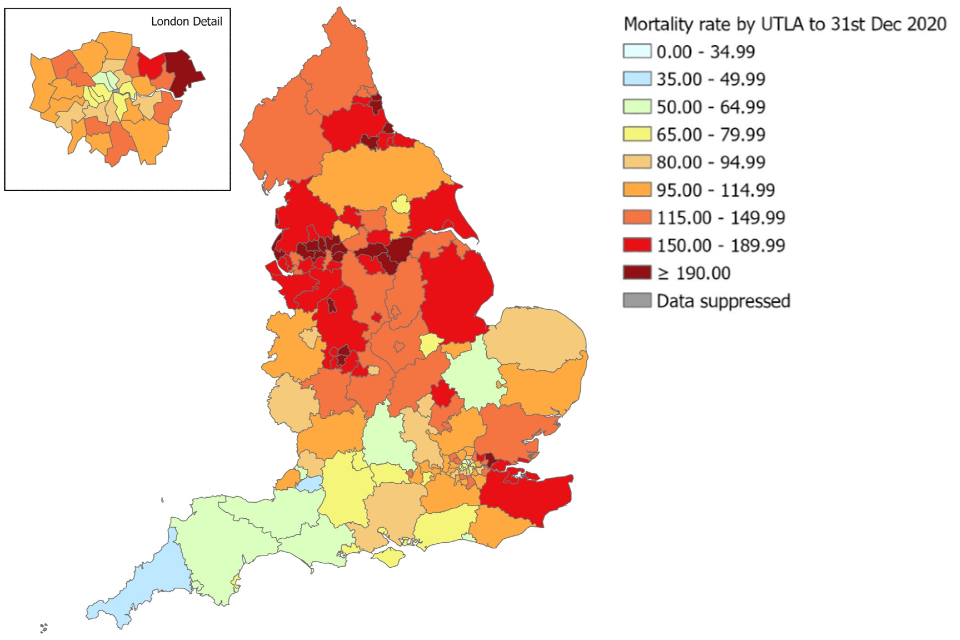
*Data is presented from 30 January to 31 December 2020.
† Deaths within 60 days of a positive COVID-19 test or where COVID-19 is mentioned on the death certificate.
Figure 6.b. Mortality rates in laboratory-confirmed cases of COVID-19 up to week 27, by upper-tier local authority†
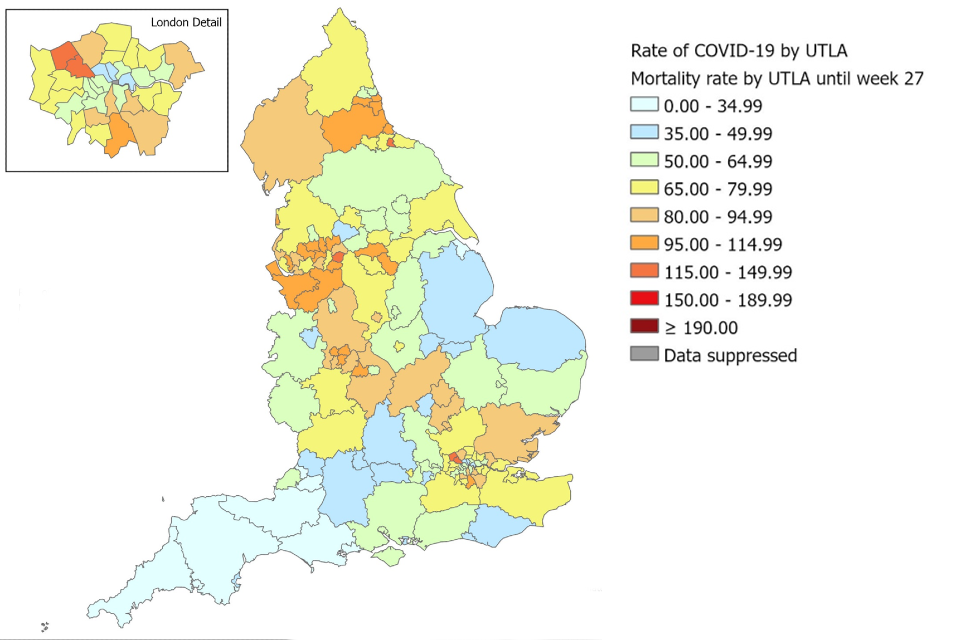
*Data is presented up to week 27 (from 30 January to 28 June 2020).
† Deaths within 60 days of a positive COVID-19 test or where COVID-19 is mentioned on the death certificate.
Figure 6.c Mortality rates in laboratory-confirmed cases of COVID-19 from week 27 onwards, by upper-tier local authority†
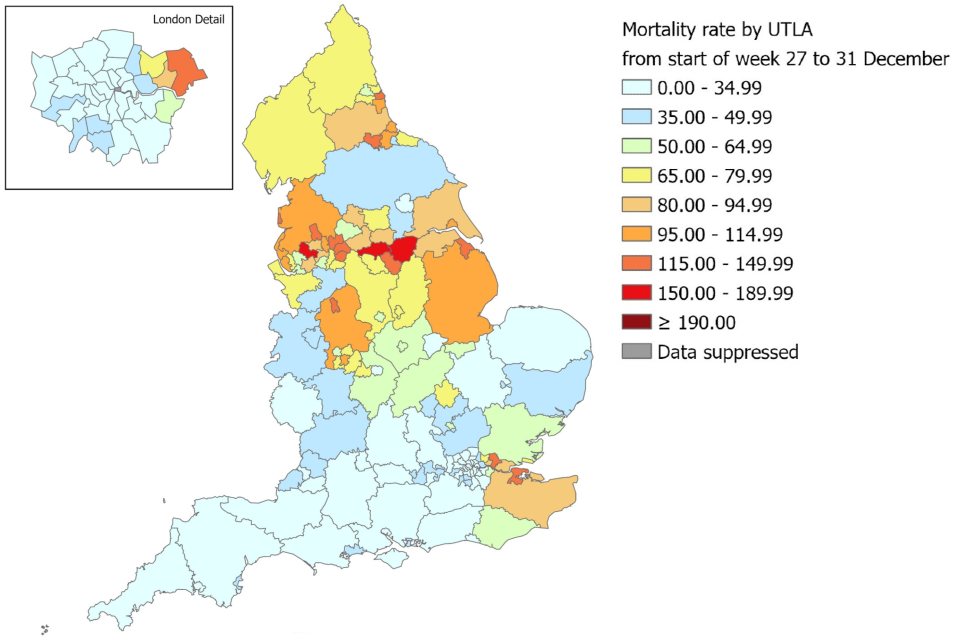
*Data is presented from week 27 onwards (from 29 June to 31 December 2020).
† Deaths within 60 days of a positive COVID-19 test or where COVID-19 is mentioned on the death certificate.
Figures 6a to 6c:
- to 12 October 2020, incidence rate calculations uses 2019 ONS mid year population estimates
- contain Ordnance Survey data © Crown copyright and database right 2020
- contain National Statistics data © Crown copyright and database right 2020
Case fatality risk
Case fatality risk (CFR) describes the risk of death within 60 days of a laboratory-confirmed positive COVID-19 test. Cases diagnosed in the last 60 days were excluded from this analysis due to incomplete follow-up period.
For this report, CFR has been calculated within 60 days of an individual’s first positive specimen. CFR is reported on data from the period of transitioning into mass testing, week 29 (4 May 2020) up to and including the 1 November 2020. Laboratory confirmed deaths are excluded from the CFR calculation if they cannot be linked to the confirmed COVID-19 case data held by PHE.
CFR is sensitive to change in:
- testing coverage and detection rate of COVID-19 infections (Dudel et al., 2020; Wu et al., 2020)
- demographics of infected population (which can be mitigated by age- and gender-stratification)
- the effectiveness of treatment and health systems ability to care for severe COVID-19 cases
Table 6. Total number of laboratory-confirmed cases, deaths and CFR in laboratory-confirmed cases of COVID-19*†
| Cases | Deaths† | Case fatality risk (%) | |
|---|---|---|---|
| Total* | 756,925 | 17,333 | 2.3 |
*Data is presented from the period of transitioning into mass testing, 4 May to 1 November 2020. Figures differ from Table 1 based on CFR calculation inclusion criteria.
†Deaths within 60 days of a positive COVID-19 test and linked to the confirmed COVID-19 case data.
Figure 7. Number of laboratory-confirmed cases, deaths and case fatality risk in laboratory-confirmed cases of COVID-19, from period of transition to mass testing*†
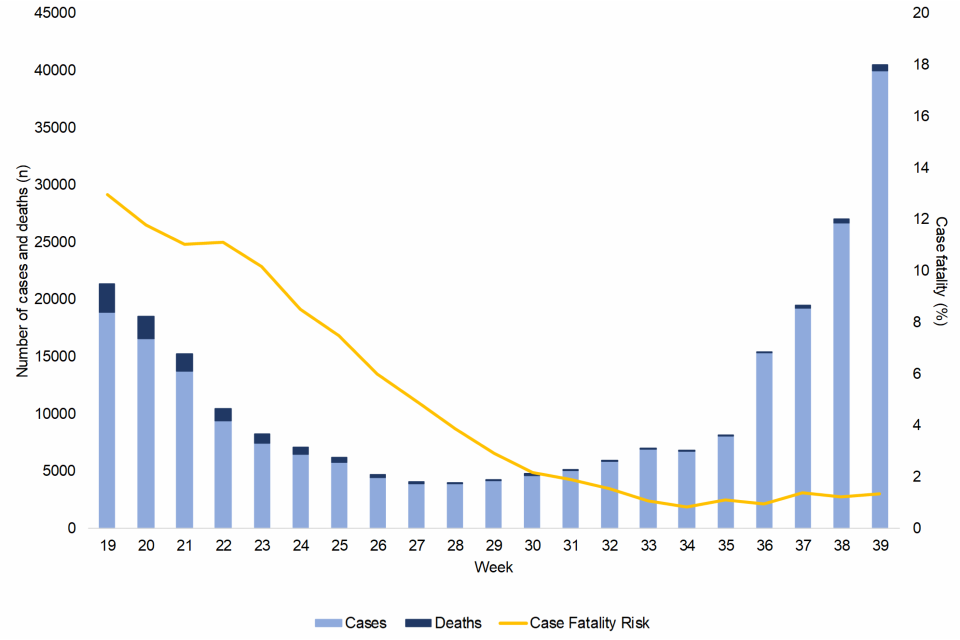
Note: The time period presented covers a period where there has been improved testing availability, therefore apparent changes in estimated case fatality should be interpreted with caution
Numbers of cases and deaths are stacked by week. Cases are presented by week of specimen date. Deaths are presented by week of death.
*Data from week 19, the start period of the transition to mass testing, to week 39, the last full week of eligible positive case data before 1 November (October 26 2020 to 1 November 2020).
†Deaths within 60 days of a positive COVID-19 test and linked to the confirmed COVID-19 case data.
Table 7a. CFR in laboratory-confirmed cases of COVID-19, by age†
| Age category | Deaths | Cases | CFR (%) | Lower 95 CI | Upper 95 CI |
|---|---|---|---|---|---|
| <20 | 14 | 130,029 | 0.0 | 0.0 | 0.0 |
| 20-29 | 24 | 160,271 | 0.0 | 0.0 | 0.0 |
| 30-39 | 72 | 122,045 | 0.1 | 0.0 | 0.1 |
| 40-49 | 219 | 105,731 | 0.2 | 0.2 | 0.2 |
| 50-59 | 664 | 106,261 | 0.6 | 0.6 | 0.7 |
| 60-69 | 1,617 | 56,454 | 2.9 | 2.7 | 3.0 |
| 70-79 | 4,100 | 32,392 | 12.7 | 12.3 | 13.1 |
| 80+ | 10,617 | 40,360 | 26.3 | 25.8 | 26.8 |
| Total | 17,333 | 756,925 | 2.3 | 2.3 | 2.3 |
*Data is presented from the period of transitioning into mass testing, 4 May to 1 November 2020.
†Deaths within 60 days of a positive COVID-19 test and linked to the confirmed COVID-19 case data.
Table 7.b. CFR in laboratory-confirmed cases of COVID-19 (in males), by age†
| Age category | Deaths | Cases | CFR (%) | Lower 95 CI | Upper 95 CI |
|---|---|---|---|---|---|
| <20 | 2 | 60,595 | 0.0 | 0.0 | 0.0 |
| 20-29 | 15 | 73,827 | 0.0 | 0.0 | 0.0 |
| 30-39 | 37 | 56,539 | 0.1 | 0.0 | 0.1 |
| 40-49 | 131 | 47,509 | 0.3 | 0.2 | 0.3 |
| 50-59 | 425 | 48,610 | 0.9 | 0.8 | 1.0 |
| 60-69 | 1,045 | 28,107 | 3.7 | 3.5 | 4.0 |
| 70-79 | 2,522 | 16,402 | 15.4 | 14.8 | 16.0 |
| 80+ | 5,167 | 14,979 | 34.5 | 33.6 | 35.4 |
| Total | 9,350 | 347,616 | 2.7 | 2.6 | 2.7 |
*Data is presented from 30 January to 1 November 2020.
†Deaths within 60 days of a positive COVID-19 test and linked to the confirmed COVID-19 case data.
Table 7.c. CFR in laboratory-confirmed cases of COVID-19 (in females), by age†
| Age category | Deaths | Cases | CFR (%) | Lower 95 CI | Upper 95 CI |
|---|---|---|---|---|---|
| <20 | 12 | 68,174 | 0.0 | 0.0 | 0.0 |
| 20-29 | 9 | 85,137 | 0.0 | 0.0 | 0.0 |
| 30-39 | 35 | 64,676 | 0.1 | 0.0 | 0.1 |
| 40-49 | 88 | 57,457 | 0.2 | 0.1 | 0.2 |
| 50-59 | 239 | 56,917 | 0.4 | 0.4 | 0.5 |
| 60-69 | 572 | 27,858 | 2.1 | 1.9 | 2.2 |
| 70-79 | 1,578 | 15,667 | 10.1 | 9.6 | 10.6 |
| 80+ | 5,450 | 25,038 | 21.8 | 21.2 | 22.4 |
| Total | 7,983 | 402,157 | 2.0 | 1.9 | 2.0 |
*Data is presented from the period of transitioning into mass testing, 4 May to 1 November 2020.
†Deaths within 60 days of a positive COVID-19 test and linked to the confirmed COVID-19 case data.