Choice modelling and methodology development: Marginal willingness to pay for museum improvements
Updated 14 July 2023

© Crown copyright 2023
This publication is licensed under the terms of the Open Government Licence v3.0 except where otherwise stated. To view this licence, visit nationalarchives.gov.uk/doc/open-government-licence/version/3 or write to the Information Policy Team, The National Archives, Kew, London TW9 4DU, or email: psi@nationalarchives.gov.uk.
Where we have identified any third party copyright information you will need to obtain permission from the copyright holders concerned.
This publication is available at https://www.gov.uk/government/publications/choice-modelling-research-and-methodology-for-the-chc-programme/choice-modelling-and-methodology-development-marginal-willingness-to-pay-for-museum-improvements
Authors and acknowledgements:
IPSOS: Dr Ricky Lawton, Chris Moore, Manjula Bhudiya, Henry Evans, Sean Doherty
Ipsos would like to thank Harman Sagger, Jack Philips and Shivani Haria from DCMS and Ciara Wells and Will White at the National Railway Museum for their inputs to this research. In particular, we would like to thank Harman Sagger who provided the overarching aims and initial overall approach and aim of the study in terms of linking existing contingent valuation studies to a discrete choice modelling approach.
Executive summary
Work to date as part of the DCMS Culture and Heritage Capital Programme has provided a range of point estimates that organisations can use to value the benefits of their assets to society. However, DCMS recognises that on their own, these values cannot be used for marginal analysis of interventions i.e., comparing different options, for example expanding a museum or restoring a historic building.
Therefore, DCMS has commissioned Ipsos to undertake research to explore the use of discrete choice modelling (DCM), linked to an existing contingent valuation study, to estimate marginal changes in value when organisations are undertaking the analysis of options within business cases.[footnote 1]
The Culture and Heritage Capital Programmes’ aim for the research was to:
-
Test the practicalities of employing a DCM approach to the analysis of options within culture and heritage business cases.
-
To understand if DCM could be used, alongside an existing contingent value study, to estimate the marginal change in welfare of different interventions. This will address the empirical gap in the evidence base of combining these two approaches.
-
To establish whether DCM could provide a cheaper alternative for organisations conducting options analysis, by removing the need to undertake a contingent valuation study, which in the future could be sourced from the Culture and Heritage Capital Programme.
The National Railway Museum (NRM) was selected to undertake this analysis as it had already been valued as part of the 2018 study ‘The economic value of culture: a benefit transfer study’ which used contingent valuation to elicit use and non-use values (point estimates).[footnote 2] The museum is planning work to expand its offering, which provided an opportunity to test how different interventions will affect the point estimate values previously elicited for the asset. This is the first time that DCM has been applied to an existing body of willingness to pay (WTP) values to estimate the marginal value of changes to the provision of a non-market good or service, and this is of particular importance to the ongoing research around how to measure flows of benefits to cultural and heritage capital stocks.
We address the objectives of this study and this gap in the empirical evidence base through a choice modelling study to elicit the marginal utility that respondents (visitors/prospective visitors and non-visitors) hold for different combinations of changes to the service offering at the NRM, as measured in term of likelihood to (re)visit. Choice modelling is a valuation method prescribed by HMT Green Book (2022) to measure individuals’ preferences,[footnote 3] and this can be used to estimate the welfare impact of different interventions.
Methodology
An online survey of 941 adults aged 16+ in England was recruited via the Ipsos Interactive Services panel of adult residents in England.
User sample: We surveyed visitors to NRM in the past 5 years (as had been done in previous SP work commissioned by DCMS).[footnote 4] Anticipating a low uptake of historic visitors, we extend the sampling to include other sub-samples of interest, such as prospective visitors identified through questions on interest in comparable subject areas and visits to similar sites.
For the purpose of this analysis, we combine previous visitors and prospective visitors into a ‘user group’ (n=357, 38%), and general public and Yorkshire residents into a ‘non-user’ group (n=584, 62%).
A conjoint model was constructed using 8 attributes over 2-3 levels across 7 tasks. Central to this methodology is the use of a common metric – likelihood to visit/revisit – in place of a monetary attribute (given that a baseline WTP has already been elicited). This allows us to anchor marginal willingness to pay to marginal changes in the likelihood score associated with the status quo vs the improvement scenario.
From the resulting analysis we produce two sets of likelihood scores, one for the status quo, and one for the improvement scenario. We then compare mean likelihood to (re)visit scores for the status quo vs NRM improvement scenario to estimate the percentage difference in likelihood to (re)visit between status quo and improvement scenarios. This technique will allow us to understand the increase in user WTP value from those who have already experienced the museum. There may also be increases in option value among those who have not visited, as well as an increase in other elements of the Total Economic Value taxonomy, such as existence and altruistic values. However, this requires further research to understand the marginal values held by non-visitors to a museum like NRM that they have not visited, and how these values may or may not be driven by knowledge of an improvement in the service offering at the museum. This is discussed in detail in the final section of the report.
The percentage difference in likelihood to (re)visit between status quo and improvement scenarios can be applied to the baseline user and non-user WTP (with a range of lower bound to central estimate WTP).
Results
This provides a marginal WTP range for the improvement scenario (per person):
- +£1.17 to +£1.32 per visitor, equivalent to 19.3% of baseline WTP without the improvement.
We also explore the marginal WTP associated with each attribute to identify which had the largest effect on people’s preferences to revisit. Marginal values for non-user WTP are also explored, but the elicitation of non-user marginal WTP introduces some additional challenges which require further consideration in future research.
Guidance for business case applications
We provide practical guidance and tools for other organisations to carry out their own choice modelling exercise to aid decision making. Central to this methodology is the use of a common metric – likelihood to visit/revisit – in place of a monetary attribute (given that baseline WTP has already been elicited). This means that other organisations should be able to collect data on likelihood to (re)visit – as is already common in visitor surveys – to predict how a change in service provision would affect likelihood to (re)visit. In this way, it is possible to construct indicative estimates of the WTP gains that would be produced through the proposed changes to their service provision by interacting with these results. This approach has a number of benefits. In addition to being a cost-effective way of updating the evidence base for the changed value of cultural and heritage assets in response to investments in their service offering, and by excluding any reference to a monetary value (using likelihood to visit/revisit as the main variable of interest), it also avoids some of the anchoring bias that would be produced by displaying the previous WTP value to respondents. In this way it also avoids strategic bias and protest bids by removing reference to any potentially sensitive discussions regarding entry fees or other payment models.
We provide guidance on how to use the methods and results of this choice modelling study of the marginal WTP associated with improvement options at the NRM to another business case, for social CBA purposes.
In the final section, we compare and contrast a business case social cost benefit analysis (SCBA) for a hypothetical museum case study, based on the baseline point estimate values for regional museums as estimated in the 2018 DCMS study ‘The economic value of culture: a benefit transfer study’, with the marginal values estimated through this choice experiment.
Methodological considerations and future research
One of the objectives of this research was to establish whether DCM could provide a cheaper alternative for organisations to undertake their own options analysis. To explore this, a ‘simplified’ version of the model described throughout this report was constructed, however this was dependent on a number of simplifying assumptions that created complications with the modelling. This created counterintuitive results whereby a lower likelihood to (re)visit produced higher WTP values. This is not possible to overcome without information about the relationship between likelihood to (re)visit and WTP in the original benefit transfer study, so further research is needed to overcome this issue.
As a result, only the more sophisticated modelling technique requiring additional data collection at the museum level is presented in this paper, and a discussion around the issues and limitations of the simplified version is outlined in Section 6.
The DCM study also unearthed a number of methodological limitations around the application of marginal valuation techniques to non-user values. This is important when we come to SCBA, because while the interpretation of marginal WTP among visitors and prospective visitors in terms of Total Economic Value (use and non-use) is relatively straightforward (an increase in the direct use value when they next visit, in addition to any increase in option and non-use value), interpreting the marginal non-user WTP is more difficult. This is due to several issues, both in the design, and the conceptualisation of non-user WTP.
Thus, it is very hard to say what effect, if any, the improvements would make to non-visitors’ non-use value, in terms of the existence of an improved NRM offering (existence value), its benefits to others now (altruistic value), and in the future (bequest value). This would require alternative survey design specifically for the non-user DCM survey and should be informed by more in-depth follow up analysis, potentially including mixed-methods qualitative data collection through focus groups with the general population of non-visitors. This study has demonstrated that there is a greater need to resolve key questions around non-use value. Some of these issues were identified in the 2021 DCMS Cultural and Heritage Capital Framework document, and others have been expanded further by the 2022 AHRC/DCMS scoping study. Future survey design for eliciting marginal non-user WTP values should explore alternative methods to the likelihood to visit scores used in the current study. This may require a reversion to monetary values within the DCM study or could use other quantitative index scales informed by the theoretical literature on non-use values (such as that used by Throsby for maintenance of different spiritual, aesthetic, and historic aspects of heritage assets).[footnote 5] or informed by qualitative focus group work and cognitive testing.
1. Introduction
The Culture and Heritage Capital Programme has been launched by DCMS with support from its arm’s-length bodies. Its aim is to create evidence and guidance for the valuation of culture and heritage and the benefits it provides to society to enable HMT Green Book (2022) compliant appraisal and evaluation in these sectors.
The programme is focussed on expanding the evidence base, and the development of new methods to allow organisations to capture the benefits to society within their decision making.
Contingent valuation has been used as the primary method for calculating the use and non-use values associated with culture and heritage assets. As part of the CHC programme, Arts Council England (ACE), Historic England (HE) and the British Film Institute (BFI) have contributed a range of studies including the valuation of theatres, galleries, museums, historic high streets, and digital archive content. DCMS have also published a Rapid Evidence Assessment of Culture and Heritage Valuation Studies which includes a database of values. All these resources are available on the Culture and Heritage Capital Portal.[footnote 6]
The above studies provide a range of point estimates that organisations can use to value the benefits of their assets to society. However, DCMS recognises that on their own, these values cannot be used for marginal analysis of interventions i.e., comparing different options, for example expanding a museum or restoring a historic building.
Therefore, DCMS has commissioned Ipsos to undertake research to explore the use of discrete choice modelling (DCM) linked to an existing contingent valuation study, to estimate marginal changes in value when organisations are undertaking the analysis of options within business cases.
Culture and Heritage Capital Programmes aim for the research was too:
-
Test the practicalities of employing a DCM approach to the analysis of options within culture and heritage business cases.
-
To understand if DCM could be used, alongside an existing contingent value study, to estimate the marginal change in welfare of different interventions. This will address the empirical gap in the evidence base of combining these two approaches.
-
To establish whether DCM could provide a cheaper alternative for organisations conducting options analysis, by removing the need to undertake a contingent valuation study, which in the future could be sourced from the Culture and Heritage Capital programme.
The National Railway Museum (NRM) was selected to undertake this analysis as it has already been valued as part of the 2018 study ‘The economic value of culture: a benefit transfer study’ which used contingent valuation to elicit use and non-use values (point estimates).[footnote 7] The museum is planning work to expand its offer, so information and materials have already been produced around the improvement scenario, which can be used in the stated preference survey to increase the realism of the choice modelling exercise.
We address the objectives of this study and this gap in the empirical evidence base through a choice modelling study to elicit the marginal utility that respondents (visitors/prospective visitors and non-visitors) hold for different combinations of changes to the service offering at the NRM, as measured in term of likelihood to (re)visit. Choice modelling is a valuation method prescribed by HMT Green Book (2022) to measure individuals’ preferences[footnote 8], and this can be used to estimate the welfare impact of different interventions.
This is the first time that DCM has been applied to an existing body of willingness to pay values to estimate the marginal value of changes to the provision of a non-market good or service, and this is of particular importance to the ongoing research around how to measure flows of benefits to cultural and heritage capital stocks.
Central to this methodology is the use of a common metric – likelihood to visit/revisit – in place of a monetary attribute (given that baseline WTP already elicited). This means that other organisations should be able to collect data on likelihood to (re)visit – as is already common in visitor surveys – to predict how a change in service provision would affect likelihood to (re)visit. This allows us to construct indicative estimates of the WTP gains that would be produced through the proposed changes to their service provision by interacting these results.
In the final sections we provide practical guidance and tools for other organisations to carry out their own choice modelling exercise to aid decision making. We also provide guidance on how to use the methods and results of this choice modelling study of the marginal WTP associated with improvement options at the NRM to another business case, for social CBA purposes.
The DCM study also unearthed a number of methodological limitations around the application of marginal valuation techniques to non-user values. This is important when we come to SCBA, because while the interpretation of marginal WTP among visitors and prospective visitors in terms of Total Economic Value (use and non-use) is relatively straightforward (an increase in the direct use value when they next visit, in addition to any increase in option and non-use values), interpreting the marginal non-user WTP is more difficult. This is due to issues, both in the design, and the conceptualisation of non-user WTP.
From a design perspective, the survey intended to elicit preferences for marginal changes in the service offering at the NRM without the inclusion of any monetary attribute. Instead, a likelihood to (re)visit scale was used. The results suggest that this design was successful for user WTP. This is because we can envisage those predicted marginal benefits eventually being realised in observable behaviour, in terms of increased visitor numbers to the NRM post-improvements. However, for that portion of the non-visitor sample who are never likely to visit the NRM, the inclusion of a likelihood to visit question is unlikely to detect any changes to their preferences, since their preferences to visit would remain zero in any scenario. However, this does not necessarily mean that their utility is unaffected by changes to the service offering at the NRM. It may be that they have a small increase in their welfare from knowing that the NRM will house larger collections and have improved accessibility across the site post-improvement, even if they never plan to visit. The challenge is that this marginal welfare gain in non-user WTP will not be detected using the likelihood to visit DCM design. An important conclusion from this study is that a one-size-fits-all DCM design may not be appropriate for eliciting both marginal user WTP and marginal non-user WTP.
Thus, it is very hard to say what effect, if any, the improvements would make to non-visitors’ non-use value, in terms of the existence of an improved NRM offering (existence value), its benefits to others now (altruistic value), and in the future (bequest value). This would require alternative survey design specifically for the non-user DCM survey and should be informed by more in-depth follow up analysis, potentially including mixed-methods qualitative data collection through focus groups with the general population of non-visitors. This study has demonstrated that there is a greater need to resolve key questions around non-use value. Some of these issues were identified in the 2021 DCMS Cultural and Heritage Capital Framework document, and others have been expanded further by the 2022 AHRC/DCMS scoping study. Future survey design for eliciting marginal non-user WTP values should explore alternative methods to the likelihood to visit scores used in the current study. This may require a reversion to monetary values within the DCM study or could use other quantitative index scales informed by the theoretical literature on non-use values (such as that used by Throsby for maintenance of different spiritual, aesthetic, and historic aspects of heritage assets),[footnote 9] or informed by qualitative focus group work and cognitive testing.
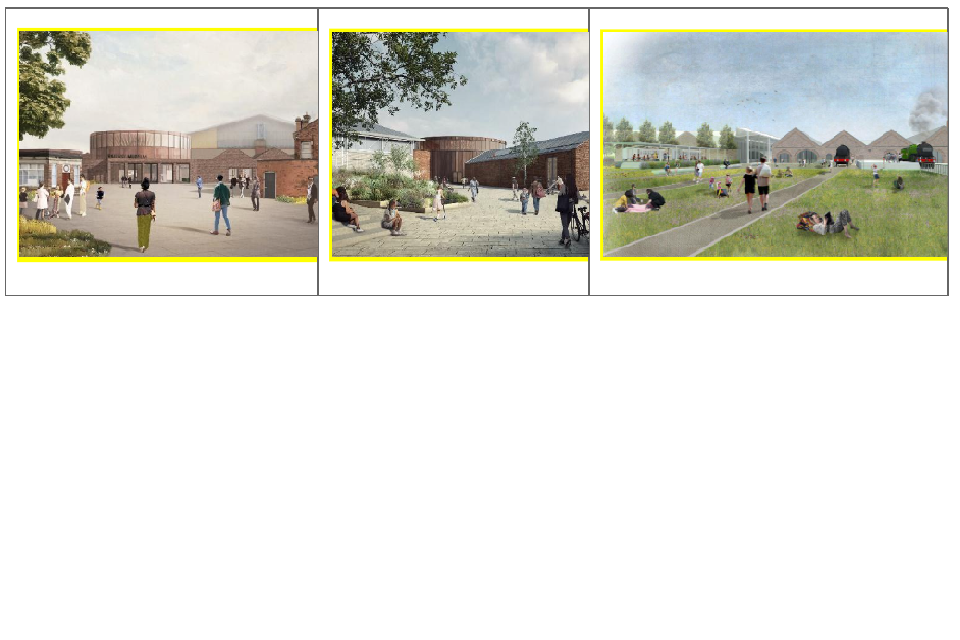
2. Case study: Improvements to the National Railway Museum
The National Railway Museum provides a good case study for estimating the marginal value of improvements to the service offering of an established cultural institution for which baseline WTP values exist. The NRM case study entails a major improvement to both the building structure, exhibition space, entrance hall, and internal facilities at a regional museum for which pre-existing WTP values had already been estimated for visitors and non-visitors, providing an excellent opportunity for experimental research on the marginal value of such changes.
The proposed changes to the NRM include the construction of a new arrival point in a new entrance hall building, this aims to improve the experience for incoming visitors from the very start of their visit. This proposed improvement is also paired with plans to create a new West Entrance which will improve visibility from York Station. Better visibility from the station will make the museum easier to locate for visitors travelling by rail, again improving experience.
Other proposed changes also include plans for the museum to become fully integrated across all areas of its complex. Currently the NRM’s site is divided by Leeman Road, meaning visitor access between the two parts of the museum must be made by exiting the museum and crossing this road. This change will involve constructing a new Central Hall across Leeman Road, allowing visitors to access the entire museum without having to exit the museum and cross the road. While the proposed construction of a new Central Hall across Leeman Road is a significant undertaking, it will undoubtedly improve navigation of the museum. This is something that is important regarding the museum’s appeal to school/educational trips, a demographic that already makes up a large portion of the museum’s visitor numbers.
In addition to these benefits the construction of a new Central Hall will expand the museum by around 3,300m², enabling the museum to add a new third main gallery within this area. This will ensure the museum has the capacity to produce new exhibitions, retaining its appeal amongst returning visitors and increasing its attraction for new visitors.
There is also a substantial focus on the accessibility of the NRM within the proposed developments to ensure all individuals can access everything the museum has to offer. One such plan is to ensure step-free access throughout the museum to ensure all areas are wheelchair friendly. As well as this, the museum plans to offer new audio-visual and programmable spaces, making the museum more accessible for visually impaired visitors. There are also plans for these audio-visual and programmable spaces to be set in a historic context, opening another dimension for the museum’s exhibitions and visitor experience. The museum will also upgrade a number of its essential facilities, with plans to improve toilets to provide greater space and equipment for childcare and to ensure their accessibility for all visitors. Finally, a new café will be added to the museum to offer refreshments and to help ensure visitors have as positive an experience as possible.
Figure 1 Artist representations of proposed improvements to NRM
3. Methodology
Survey design
The DCM survey was designed in alignment with previous existing cultural value research as published on the Culture and Heritage Capital Portal.
The survey was divided into four sections. Section 1 asked questions about engagement with NRM and comparable cultural sites (transport museums) and their interest in transport, industrial, and military history. This data was used to identify prospective visitors among the general population who had not visited the NRM before. We elicited their likelihood to visit (revisit in the case of historic visitors) on a scale of 0-10.
Section 2 presented information on NRM in its current form and potential changes that could be made to improve the services offered. Respondents were presented with these options as attributes and asked to rank the relative importance of attributes.
Section 3 involved a conjoint exercise with 8 attributes over 2-3 levels across 7 tasks, described in full below.
Section 4 asked a set of standard socio-demographic questions, including education level, marital status, employment status, self-reported health status, annual income, and number of dependent children.[footnote 10]
Following good practice, counteractive (i.e. ex ante) treatments were applied to the survey through so-called* entreaties in the survey text that are designed to reduce hypothetical bias and make the survey incentive compatible with standard welfare theory, by asking respondents to promise to answer the valuation questions truthfully (oath script).[footnote 11] The survey also included a consequentiality script in the form of a Likert scale asking respondents “How confident are you that the results of this survey will be used by policymakers?”[footnote 12]
Sampling and data collection
An online survey of 941 adults aged 16+ in England was recruited via the Ipsos Interactive Services panel of adult residents in England.[footnote 13]
Given the computational demands of DCM, we targeted a sample size of over 900 respondents split between visitors and non-visitors. In the previous NRM survey, approximately 200 visitors were sampled as those who self-reported having visited the NRM in the past 3 years. The closure of museums due to COVID lockdowns means that there will be a lower natural fall-out of historical visitors from our online panel. To deal with this situation, we increased the historical period to 5 years (as had been done in previous SP work commissioned by DCMS).[footnote 14] Anticipating a low uptake of historic visitors, we extend the sampling to include other sub-samples of interest, such as prospective visitors.
1. Respondents who have previously visited the NRM (in the past 5 years). 2. Prospective visitors who fulfil the characteristics of being likely to visit NRM in the future (e.g. visited comparable sites of interest, like steam railway lines/ industrial heritage). 3. Residents in York and the surrounding area, more likely to visit NRM due to proximity to the site. 4. Non-visitors: Nationally representative general public aged 16+ in England.
Prospective visitors were identified through questions on interest in comparable subject areas and visits to similar sites.
- If they had visited any of the following in the past 5 years: Coventry transport museum; London Transport Museum; East Anglia Transport Museum; Ipswich Transport Museum.
- Or, if fairly or very interested in Industrial Transport History.
For the purpose of analysis, we combine previous visitors and prospective visitors into a ‘user group’ of visitors, and general public and Yorkshire residents into a ‘non-user’ group.
Choice modelling
Stated Preference, through Discrete Choice Modelling (DCM), is suited to capturing the flow of benefits associated with a cultural asset, in terms of both use and non-use values.
DCM, or conjoint analysis is the leading methodology for understanding which features of a proposition or service consumers really value. It offers considerable advantages over direct questioning techniques by teasing out which features really matter, rather than taking what respondents state as being important at face value. The method works by splitting a product or service into its component parts, known as attributes, and within each of these attributes we can test different options, known as levels. While respondents are only subjected to a small number of scenarios, using sophisticated Bayesian techniques we can determine the impact on goods/service preferences for any combination of attribute levels.
A balanced set of tasks was created for respondents and each respondent was shown multiple tasks. The combination of levels is systemically varied across the tasks so that the trade-offs and heuristics that respondents are using in their choices can be identified.
To create a balanced set of tasks, a randomised design was generated, built upon the following principles:
- Minimal overlap: if an attribute’s number of levels is equal to the number of product concepts in a task, each level is shown exactly once.
- Level balance: each level of an attribute is shown approximately an equal number of times.
- Orthogonality: attribute levels are chosen independently of other attribute levels, so that each attribute level’s effect (utility) may be measured independently of all other effects.
The conjoint model was constructed using 8 attributes over 2-3 levels across 7 tasks, as described in the attribute table (Table 1). The status quo scenario (current service offering at NRM) is set at Level 1 in all cases (shaded light orange). The improvement scenario varies between level 2 or level 3 and is shaded in light green in the attribute table below.
Table 1 Attribute table
| Level 1 | Level 2 | Level 3 | ||
|---|---|---|---|---|
| Entrance hall | No arrival point | New arrival point in current building | New arrival point in new entrance hall building | |
| Number of galleries | Two main galleries: Great Hall and Station Hall | New third main gallery in new Central Hall | New larger third main gallery in new Central Hall ‘Plus’ | |
| Museum integration | Museum remains unintegrated under the closed Leeman Road | Museum remains unintegrated but level access over closed Leeman Road | Museum fully integrated: Constructing new Central Hall across closed Leeman Road | |
| Visibility from train station | Museum poorly visible from York station | New West Entrance more visible from York station | ||
| Access throughout museum | Accessibility reliant on two small lifts & stairs | Level step-free access throughout museum | ||
| Café/restaurant facilities | Maintain current café facilities | Add new café | Add new destination restaurant | |
| Audio-visual and programmable spaces | Galleries display only rail vehicles | New audio-visual and programmable spaces, set in historic context | ||
| Toilet and changing facilities | Accessible toilets & baby changing facilities | Changing places toilet provide more space and equipment (in addition to accessible toilets) |
Central to this methodology is the use of a common metric – likelihood to visit/revisit – in place of a monetary attribute (given that baseline WTP already elicited). This allows us to anchor marginal willingness to pay to marginal changes in the likelihood score associated with the status quo vs the improvement scenario.
DCM provides an understanding of the relative impact of the different attributes and levels on preference for one product over another. A key output from the conjoint analysis is a ‘Utility’ score that is derived for each attribute level included in the design and describes the relative desirability of each level. Utilities are numerical scores that measure how much each attribute level influences the respondent’s decisions. The higher the utility the more desirable the attribute level is. Levels with higher utilities will have a larger impact on the preference for a good/service.
Based on these utilities, consumer behaviour can be predicted. From the resulting analysis we produce two sets of likelihood scores, one for the status quo, and one for the improvement scenario. This enables a direct comparison of the average likelihood scores for each option.
The main difference of the current design compared to a standard DCM is that it includes no price attribute. This is because we already know the status quo price (from previous contingent valuation of the NRM) and only need to know the marginal difference in utility value associated with the improvement scenario. Instead, utilities are calculated with respect to change in the likelihood to (re)visit score, since this is a common numeraire that can be applied to any institutional scenario. If people are more likely to visit, then it means that the preference to (re)visit has increased and it is reasonable to assume that they would pay more for the enhanced features.
To avoid oversimplification in the conjoint exercise, some of the attributes were given an additional third level. This helped to make the exercise more realistic in terms of trading off different options (rather than a binary choice between status quo and improvement. It also provides more data for understanding the marginal value of different levels of possible changes to service provision at the museum like NRM. These marginal values are reported in Table 9.
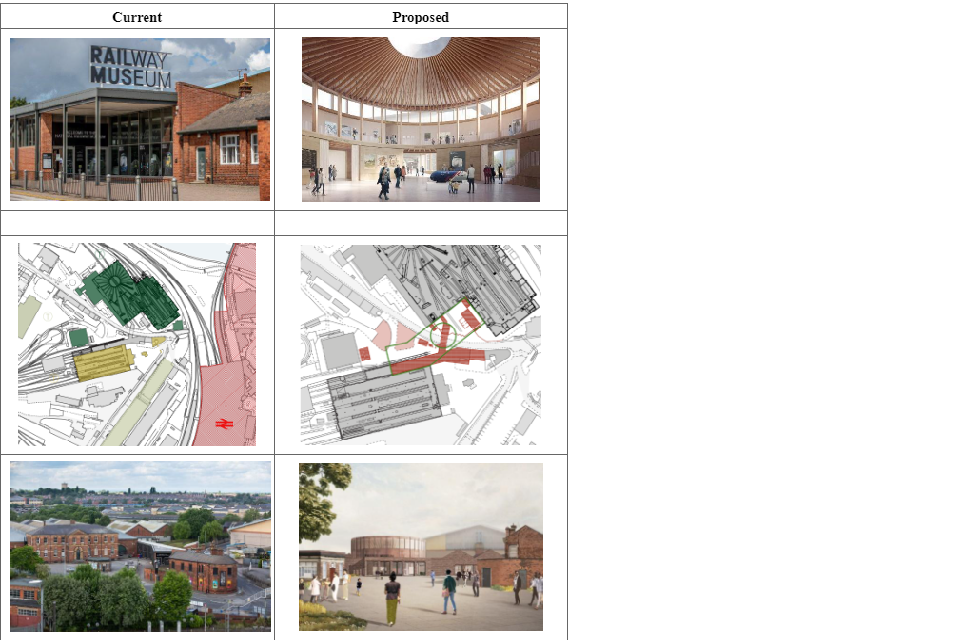
Prior to the choice exercise, respondents were provided with information about the status quo and possible improvement options (see Box 1). To aid understanding by those who interpret more through visual than textual information, an image table was presented showing images of the current and proposed features of the NRM (see Table 2).
Box 1 Survey Information: Status quo and improvement scenario
The National Railway Museum’s site is currently divided by the Leeman Road. This means that visitor access between the two parts of the museum must be made by exiting the museum and crossing Leeman Road (via an underpass or two small lifts for those without accessibility).
The two current galleries - Great Hall and Station Hall - covering 16,000 square metres, nearly all of which is gallery space - provide space to display railway vehicles, but the museum does not currently have the space to tell stories about modern and future railway travel and the pioneering work of the modern rail industry in UK. In addition, the museum is not well integrated into the city centre and is hard to reach from York train station, and there is currently no entrance foyer to assist visitors in planning their journey around the museum.
In response, the National Railway Museum is considering ways that it could expand its service offering. This could include a number of options, such as an expansion of the museum to integrate the two existing galleries and provide additional gallery space, a new entrance foyer, improved accessibility around the museum, new accessible toilet facilities, new café and/or restaurant facilities and audio-visual exhibition space. All proposed improvements would be expected to be completed by 2025.
Table 2 Survey Information: Visuals of status quo and improvement scenario
Respondents were then told that: “The museum has limited funds, and if a decision were taken to expand the museum it could not provide all of these expansion options. In a scenario where the museum did expand, it would have to choose which of the available options would most improve the visitor experience at the museum and allow it to tell the history of the railways in the most authentic and relevant way. In this survey, we would like you to tell us which of the different hypothetical options you would most prefer.” They were also presented with an ex-ante oath script asking if they promised “to answer the questions that will follow as truthfully as possible”, which has been shown to minimise hypothetical bias in stated preference surveys.
Respondents completed seven choice exercises, each with a single choice option, made up of a new combination of attributes and levels. For each, they were asked “Given the above conditions, how likely are you to visit the National Railway Museum?” on a 0-10 scale where 0 is not at all likely, 10 is extremely likely and 5 is neutral.
The analysis of the conjoint data was conducted using Hierarchical Bayes. The Hierarchical Bayes algorithm fits a Multinomial Logit Model (MNL) to each individual respondent using an iterative approach that maximises the posterior likelihood. In other words, HB finds the optimum set of utility parameters given the observed respondent data and given the knowledge about the rest of the sample. It is called ‘Hierarchical’ as respondent data (Lower model) is supplemented by the data for the total sample, known as the population (Upper model). This additional information from the ‘population’ strengthens the estimation for individual respondents by looking at how different the respondent data is compared to the population. The resulting output is a set of parameters, known as Utility scores (one for every level tested) and measure the desirability of each level in the choice process.
This approach has a number of benefits. In addition to being a cost-effective way of updating the evidence base on the changed value of cultural and heritage assets in response to investments in their service offering, by excluding any reference to a monetary value (using likelihood to visit/revisit as the main variable of interest) it also avoids some of the anchoring bias that would be produced by displaying the previous WTP value to respondents, and avoids strategic bias and protest bids by removing reference to any potentially sensitive discussions of entry fees or other payment models.
One of the limitations of this approach is that the non-user population may be unlikely to visit the site being valued, regardless of the changes introduced. This is because non-users have already partially revealed their preferences towards the NRM by not previously visiting, and they are less likely to be prospective visitors because they do not have an interest in the topic areas of transport and industrial history covered by the collections. Non-visitors are more likely to give a £0 WTP (as shown in the original ACE regional museums study). Therefore, the design of the DCM - where the monetary variable is replaced with a likelihood to visit variables - may lead to higher levels of choice indifference among non-visitors, because they are not any more likely to visit the NRM with the improvements than they are in its current state. This is explored in more detail in the results in Appendix 2 and the methodological discussion in section 7.
4. Results
Demographic characteristics
A total sample of 941 respondents completed the survey. Of those, 157 respondents had visited the NRM in the past 5 years (17% visitors), while 200 were prospective visitors (21%). The majority (527, 56%) were non-visitors from the general public (England residents aged 16+) in addition to 57 residents from York / Surrounding area who had not visited previously (6%).
We combine previous visitors and prospective visitors into a ‘user group’ of visitors and prospective visitors to NRM (n=357, 38%) and a non-user group (n=584, 62%).
Table 3 Sample groups
| n | % | ||
|---|---|---|---|
| User and prospective user group | Previously visited the National Railway Museum | 157 | 16.7% |
| Prospective visitors | 200 | 21.3% | |
| Non-user group | Residents in York / Surrounding area | 57 | 6.1% |
| Nationally representative: England general public 16+, excluding York and surrounding area | 527 | 56.0% | |
| Total sample | 941 |
Visitors/prospective visitors differ in terms of income, education level, employment status, and social class, which aligns with the findings of the Taking Part survey that culturally engaged individuals are more likely to come from higher socioeconomic backgrounds.[footnote 15] We also find that Visitors/ Prospective visitors are more likely to rank funding for arts/culture as a top five priority.
Table 4 Demographics
| Visitors/ Prospective visitors | Non-visitors: General public | Total sample | |
|---|---|---|---|
| Female | 48.1% | 50.6% | 49.6% |
| Age | 49 | 52 | 51 |
| Midpoint income | £54,395 | £40,809 | £46,128 |
| Degree or above | 55.1% | 50.0% | 52.0% |
| Full / part time employed | 63.1% | 55.9% | 58.7% |
| BAME | 7.3% | 7.2% | 7.2% |
| Middle class or upper middle class | 51.6% | 42.6% | 46.1% |
| Funding for arts ranked top five priority | 42.0% | 22.1% | 29.9% |
Table 5 sets out average levels of interest (on a Likert scale of 1-5, where 1 is not at all and 5 is extremely interested) in types of history that have similarities to the objects displayed at the NRM. NRM visitor/prospective visitors had significantly higher levels of interest in all history types. This was especially true of interest in Industrial or Transport history, as was to be expected given that this was one of the factors on which allocation to the prospective visitor group was made.
Table 5 Interest in NRM-related areas of history
| Visitors/ Prospective visitors | Non-visitors: General public | Total | |
|---|---|---|---|
| Mean (1-5) | Mean (1-5) | Mean (1-5) | |
| Interest in military history | 2.91 | 2.06 | 2.39 |
| Interest in Industrial or transport history | 3.21 | 1.81 | 2.35 |
| Interest in Medieval history | 3.16 | 2.52 | 2.77 |
| Interest in Ancient history | 3.21 | 2.63 | 2.85 |
| Observations | 355 | 570 | 925 |
We asked visitors how often they had visited the NRM in the past five years. The majority (55%) had only visited once in the past five years, but nearly a third (30%) had visited 2 or 3 times and 12% had visited more than five times, which suggests that even with COVID-19 restrictions over recent years, that multiple attendance of the NRM remains high.
Table 6 Frequency of visits to NRM in the past five years (visitor sample only)
| N | % | |
|---|---|---|
| Once in the past five years | 86 | 55.1% |
| 2-3 times in the past five years | 46 | 29.5% |
| 4-5 times in the past five years | 6 | 3.9% |
| More than 5 times in the past five years | 18 | 11.5% |
| Total | 156 |
Table 7 Date of last visit to NRM in the past five years (visitor sample only)
| N | % | |
|---|---|---|
| 2022 | 11 | 7.6 |
| 2021 | 29 | 20.1 |
| 2020 | 13 | 9.0 |
| 2019 | 34 | 23.6 |
| 2018 | 29 | 20.1 |
| 2017 | 20 | 13.9 |
| 2016 or earlier | 8 | 5.6 |
| Total | 144 |
Choice modelling results: Status quo vs improvement scenario
User (visitor) marginal WTP values
The choice model elicited likelihood to (re)visit for a range of attribute combinations. In the analysis, we select the combination of attributes which matches the status quo scenario (all level 1) and improvement scenario (green cells in Table 1).
We then compare mean likelihood to (re)visit scores** for the status quo vs NRM improvement scenario to estimate the percentage difference in likelihood to (re)visit** between status quo and improvement scenarios.
The percentage difference in likelihood to (re)visit** between status quo and improvement scenarios can be applied to the baseline user and non-user WTP (both central estimate and lower bound).
This provides a user (visitor) marginal WTP range for the improvement scenario (per person):
- +£1.17 to +£1.32 per visitor, equivalent to 19.3% of baseline WTP without the improvement (percentage rounded to one decimal place).
The marginal values are not insubstantial, and within the bounds of what we would reasonably expect that entry tickets could increase by for such a major service improvement as proposed at the NRM, consisting of an almost 50% increase in exhibition space and a new arrival point, among other changes. Non-user (non-visitor) marginal WTP range for the improvement scenario (per person) is estimated in the DCM to range from +£0.64 to +£0.86 per non-visitor, equivalent to 27.4% of baseline WTP without the improvement (reported in full in Appendix 2). However, due to ongoing methodological issues around the design and interpretation of non-user WTP and the particular challenges of eliciting non-user WTP for marginal changes within a discrete choice experiment, we do not report the non-user WTP figures in the main report.
Table 8 Discrete Choice: Visitor marginal Willingness to Pay for improvement vs status quo scenarios
| Visitors and prospective visitors | |
|---|---|
| Status quo | 6.34 |
| Improvement scenario | 7.56 |
| Difference in likelihood to (re)visit (0-10 scale) | 1.22 |
| Difference (%) | 19.3% |
| Baseline WTP (Status quo) - central estimate | £6.86 |
| Baseline WTP (Status quo) - lower bound | £6.05 |
| Marginal WTP (Improvement) - central estimate | +£1.32 |
| Marginal WTP (Improvement) - lower bound | +£1.17 |
| Sample size | 357 |
Choice modelling results: Marginal WTP for each improvement attribute
In this section we explore the marginal WTP associated with each attribute to identify which had the largest effect on people’s preferences to revisit.
To estimate the marginal WTP for each improvement attribute we take attribute level 1 (status quo) as the reference point in all cases. The ‘outcome’ variable is likelihood to revisit on a scale of 0-10 (11-point scale). We then take the status quo WTP for the visitor/non-visitor sample. For example, we know that the visitor WTP associated with the NRM status quo is £6.05 (lower bound). We then take the visitor mean likelihood to (re)visit in the status quo scenario of 6.34. The analysis in this section is based on lower bound WTP from the NRM benefit transfer study. Central estimate analysis is provided in the Appendix.
The marginal value for each attribute level compared to the status quo is calculated as the difference in the likelihood score. In the case of visitor WTP: - New arrival point in current building (0.33) /status quo average likelihood to (re)visit (6.34 for users) * status quo mean WTP (user lower bound WTP = £6.05).*
Meaning that the marginal WTP for a new arrival point in the current building structure is +£0.31 per visitor, while the marginal WTP for a new arrival point in a new entrance hall building is slightly higher at £0.32 per visitor, compared to the status quo.
Table 9 below displays the marginal likelihood as well as the corresponding marginal WTP values for each attribute at the respective proposal level for the designated ‘User’ group. Several notable points of analysis can be drawn from this table:
-
There is little increase in the WTP value (£0.01 increase) between the level 2 and level 3 proposal regarding a new arrival point and new entrance hall building. It could be suggested that this is because of the initial level 2 attribute benefitting from the positive aspects of the ideas behind a new arrival point and the fact that the level 3 attribute offers few unique benefits on top of the initial level 2 attribute. Put simply, it’s likely that the option of a new entrance hall building does not excite visitors substantially more when compared to a new arrival point in the current building, resulting in a minimum increase in WTP between the levels.
-
There is a notable difference in User WTP between level 2 and level 3 for the attribute relating to Museum integration and access across Leeman Road, with an increase of £0.28 between the two levels. This suggests visitors highly value a more integrated and easier to navigate museum, suggesting changes regarding this should be prioritised. It can also be suggested that as the examined ‘User’ group within Table 9 is made up of individuals who are likely to revisit the museum, these aspects of this attribute are something that has had a significant impact on their previous experiences at the NRM or similar museums.
-
Another attribute that has a notably large WTP score is a new, more visible West Entrance scoring £0.21. This suggests that the ‘User’ group highly value museums that are easy to find. It can also be hypothesised that as the NRM relates to trains its visitors are more likely than the average citizen to travel by train, therefore visibility from York Station has a uniquely special importance.
Table 9 User WTP: Marginal likelihood to (re)visit and WTP per attribute (based on lower bound WTP from benefit transfer study)
| Level 2 | Level 3 | ||||
|---|---|---|---|---|---|
| Attribute | Likelihood score (0-10) | WTP (£) | Attribute | Likelihood score (0-10) | WTP (£) |
| New arrival point in current building | 0.33 | £0.31 | New arrival point in new entrance hall building | 0.34 | £0.32 |
| New third main gallery in new Central Hall | 0.11 | £0.10 | New larger third main gallery in new Central Hall ‘Plus’ | 0.09 | £0.19 |
| Museum remains unintegrated but level access over closed Leeman Road | 0.11 | £0.10 | Museum fully integrated: Constructing new Central Hall across closed Leeman Road | 0.40 | £0.38 |
| New West Entrance more visible from York station | 0.22 | £0.21 | |||
| Level step-free access throughout museum | 0.18 | £0.17 | |||
| Add new café | 0.12 | £0.11 | Add new destination restaurant | 0.04 | £0.04 |
| New audio-visual and programmable spaces, set in historic context | -0.06 | -£0.06 | |||
| Changing places toilet provide more space and equipment (in addition to accessible toilets) | 0.08 | £0.07 | |||
| Reference statistics: Status quo mean WTP and likelihood to (re)visit) | Likelihood to (re)visit | User WTP | |||
| 6.34 | £6.05 |
Figure 2 User group: Marginal likelihood to (re)visit score per attribute (status quo reference)
| Attribute | Change in likelihood to (re)visit |
|---|---|
| No arrival point | 0.00 |
| New arrival point in current building | 0.33 |
| New arrival point in new entrance hall building | 0.34 |
| Two main galleries: Great Hall and Station Hall | 0.00 |
| New third main gallery in new Central Hall | 0.11 |
| New larger third main gallery in new Central Hall ‘Plus’ | 0.09 |
| Museum remains unintegrated under the closed Leeman Road | 0.00 |
| Museum remain unintegrated but level access over closed Leeman Road | 0.11 |
| Museum fully integrated: constructing new Central Hall across closed Leeman Road | 0.40 |
| Museum poorly visible from York Station | 0.00 |
| New West Entrance more visible from York Station | 0.22 |
| Accessibility reliant on two small lists and stairs | 0.00 |
| Level step-free access throughout museum | 0.12 |
| Maintain current cafe facilities | 0.00 |
| Add new cafe | 0.12 |
| Add new destination restaurant | 0.04 |
| Galleries display only rail vehicles | 0.00 |
| New audio-visual and programmable spaces, set in historic context | -0.08 |
| Accessible toilets and baby changing facilities | 0.00 |
| Changing places toilet provide more space and equipment (in addition to accessible toilets) | 0.08 |
Follow-up data: Indifference to either scenario
It is important to note that the changes proposed in the improvement scenario are quite marginal in nature and may have no impact on people’s likelihood to (re)visit. In the DCM we found that nearly a quarter (n=216, 23%) of respondents gave the same likelihood score for all choice tasks, meaning their utilities are 0 for all levels and their likelihood score remains constant. It is reasonable to assume that these respondents have an additional WTP of 0 for the enhanced features as they are no more likely to visit. To better understand these preferences, we included a follow-up question in the survey to elicit the reason why people gave the same likelihood score in all choice tasks. This data was collected in open text qualitative format and coded by the research team ex-post according to emergent codes identified in Table 10.
The reasons given are consistent with the position that they were genuinely indifferent to the improvement scenario, and that it would not make them more likely to visit again in the future, either because they were not interested in visiting (n=82) (“Because I am neither likely nor unlikely to visit the museum, regardless of the possible options and improvements. It is a museum I might visit, or might not”), because they were genuinely indifferent (n=51 (“None of the things being discussed would affect how likely I was to visit. My likelihood of visiting is based on my interest in the subject matter, and to a lesser degree the location of the museum in relation to my home address”) or were not able to visit because of distance (“Because I don’t live near the area so am realistically unlikely to ever visit”).
There were only a small number of cases where the respondent was positive about visiting the museum in the future, but here they indicated that their preferences to visit would be the same regardless of the improvement options (“I am very likely going to visit the museum despite the new changes. The content of the museum seems very interesting”). 42 respondents replied that they didn’t know why they responded in that way, and 4 bashed buttons randomly when asked to enter qualitative responses.
On this basis, we include all indifferent preferences as genuine preference statements and do not exclude any from the conjoint analysis.
Table 10 Open-end coding: Reason for choice indifference
| Code | Museum users | Museum non-users | Total | |
|---|---|---|---|---|
| Don’t know | 7 | 35 | 42 | |
| Gibberish/button bashing | 4 | 0 | 4 | |
| Indifferent | 17 | 34 | 51 | |
| Not able to visit | 11 | 16 | 27 | |
| Not likely/interested to revisit | 8 | 74 | 82 | |
| Positively likely to revisit | 9 | 1 | 10 | |
| Grand Total | 56 | 160 | 216 |
5. Guidance for analysts
Currently, the guidance on valuing the benefits of regional museums (Arts Council England 2021) does not allow organisations to value the marginal benefit of an intervention. To help organisations make decisions that maximise social value through their choice of marginal changes to the service offering, it was necessary to design a Discrete Choice Modelling study to estimate the marginal WTP associated with different improvement options.
The National Railway Museum provided a good case study, as it entailed a major improvement to both the building structure, exhibition space, entrance hall and internal facilities at a regional museum for which pre-existing WTP values had already been estimated for visitors and non-visitors.
One potential idea proposed by DCMS was for a choice modelling method which was designed to be transferable, allowing other analysts and institutions to perform their own marginal analysis. Central to this methodology is the use of a common metric – likelihood to visit/revisit – in place of a monetary attribute (given that baseline WTP already elicited). This enabled us to design a choice survey to map onto the DCMS bank of values (which already provides pre-tested WTP values for regional museums, regional galleries, regional theatres, local museums, among other heritage assets).
In this section we provide guidance on how to adopt the methods and results of this choice modelling study of the marginal WTP associated with improvement options at the NRM for your own analytical purposes. In the next section we sketch out what SCBA using marginal WTP adds compared to a standard SCBA using single point estimates.
The most robust application of this research into the marginal value of improvement scenarios to a museum would be to conduct a new survey with specific information on your proposed improvement to elicit improvement-specific data on the expected impact of these improvements on the likelihood of your visitors and non-visitors to (re)visit.
For those institutions/analysts who want more precise institution-specific and improvement-specific data on the expected impact of specific improvement options to the public value of their institution, we provide guidance on how to undertake choice modelling on your own visitors and non-visitors following the discrete choice methodology outlined in this report and apply the results of a conjoint exercise to the benefit transfer results. Although this entails primary data collection using choice modelling methods, the advantage of this approach is still that it does not require you to directly ask for monetary willingness to pay values. Instead, you can take the pre-tested values from the DCMS evidence bank.
The key steps of this method are:
Step 1: The first step is to establish that your institution is comparable to those surveyed as part of the benefit transfer work, following ACE guidance.[footnote 16] This is to verify that the values can be transferred to your institution in a robust and realistic way.
For instance, imagine that you are interested in the value of an expansion to the service offering at a major regional natural history museum. Once it has been established that this museum is comparable to the other regional museums in the DCMS benefit transfer study, it can be assumed that its current status quo value is around £6.01 for visitors (based on pre-tested benefit transfer values, lower bound WTP).[footnote 17]
It should also be possible to use benefit transfer values for other categories of cultural institution (e.g., regional theatres, regional galleries etc.) if we assume similar marginal changes would be produced for similar improvement scenarios, but we urge that future research should be commissioned to test the assumption that marginal WTP for changes to service offerings at the NRM are applicable to other categories of cultural institutions.
If the site is not comparable to the NRM, then it will be necessary to elicit WTP in monetary terms through design of a full stated preference survey (guidance is provided in the Annex of the ACE document for this).
Step two: Develop a choice survey on a minimum of 300 respondents for each sample (e.g., visitors and non-visitors). Always consult an expert on discrete choice modelling to produce the conjoint design. For those who are confident in using Sawtooth or equivalent choice modelling software, follow the detailed steps outlined in Section 3.
Step three: Ensure that the survey elicits likelihood to visit or revisit the institution (on a scale of 0-10) in section 1 (before the choice modelling exercise).
Step four: Present information on the current (status quo) situation and the reasons why the change or improvement is being proposed.
Step five: Present information on the potential improvements that could be made, informing respondents that limited resources mean that not all improvements can be made, and a choice would have to be taken between different options.
Step six: Conjoint design: Present the improvement options as attributes (around 5-8 attributes) with at least 2 levels each (status quo and improvement). We recommend adding a third level to some attributes to increase variety and improve the realism of the choice exercise. Choice design should elicit likelihood to (re)visit for each scenario presented.
Step seven: Once all surveys have been collected, run the choice model to estimate change in likelihood to (re)visit your institution before and after the improvement scenario. This should be done using the advice of experts in conjoint analysis/within Sawtooth or equivalent conjoint software for those who are trained in conjoint analysis.
Step eight: Follow the process outlined in Section 3 to compare the percentage difference in status quo and improvement scenarios (separate percentage difference estimates for visitors and non-visitors).
Step nine: Multiply this percentage difference by the average WTP values provided by the DCMS benefit transfer work. For instance, for another regional museum, you would multiply the change in likelihood to (re)visit by the WTP values in the DCMS Benefit Transfer study visitor (visitor WTP = £6.01; non-visitor WTP=£3.17).[footnote 18]
This allows you to predict how a change in service provision affects actual likelihood to (re)visit, and in this way, construct estimates of the WTP gains that would be produced through the proposed changes to your service provision by interacting these results with the benefit transfer values, to understand the public value of your specific proposed improvements to the service offering at your institution.
The inclusion of these marginal values, even conservatively estimated, would be expected to increase the net benefits and provide a BCR in excess of 1.0. We do note the reservations raised in Section 5 that non-user marginal WTP values are not used in business case analysis/SCBA until further work has been undertaken to understand the implications around aggregation of non-user WTP as part of the AHRC/DCMS scoping study.[footnote 19] Note that there are also education, health, R&D, and volunteer benefits associated with the improvement of the NRM which are not included here for simplicity, as they require other methods to quantify and monetise in SCBA.
6. Methodological discussion
Application of marginal WTP values to business case
It is acknowledged in the HMT Green Book (2022) and Cultural and Heritage Capital Framework (CHC, 2021), that the non-market benefits of culture should be included in SCBA using robust welfare-consistent methods, of which stated preference is often the most applicable to cultural assets. The aim from this research is that a business case social cost benefit analysis (SCBA) could be constructed for a hypothetical museum case study based on the baseline point estimate values for regional museums - as estimated in the 2018 DCMS study ‘The economic value of culture: a benefit transfer study’ - alongside the marginal values estimated through this choice experiment. In line with Arts Council England Guidance, lower bound WTP figures should be used in all business cases applying non-market WTP values, to address known biases which operate on stated preference surveys.
In this section we consider the implications of adding the marginal WTP values to the SCBA for investment in improving the service offering at a regional museum.
In this scenario, imagine that the museum currently has around 750,000 annual visitors, and that after the improvement works, they expect to attract an additional 200,000 annual visitors.
Current value + marginal top-up: We know that the 750,000 current visitors currently gain an average value of £6.01 per visit, based on the lower bound user WTP for regional museum visitors estimated in the ACE benefit transfer report. In the future, when they visit and experience the post-improvement works, they will gain an additional marginal benefit, as estimated in this DCM study, of +19.3% (rounded to a single decimal place). This rounded percentage is based on the marginal top-up WTP of +£1.17 in Table 8. This means that current visitor number can be multiplied by £7.18 to estimate the future value of the museum after the improvement works (£7.18 * 750,000 = £5.39m).
Alternatively, if for the purpose of business cases, you were only interested in the marginal change in value against the counterfactual, this would mean the current visitor numbers would be multiplied by £1.17 to estimate the marginal future value of the museum for current visitors (£1.17 * 750,000 = £877,500).
New visitors: For a hypothetical scenario where we expect 200,000 new visitors per year, the value of their future visits is also £7.18 per visit since they will experience the total value of the current and improved experience (£7.18 * 200,000 = £1.44m).
While some ‘new’ visitors may be returning historic visitors, that does not affect the total value they gain from their visit to the museum after the improvement works have been completed. Other new visitors would be brand new visitors. These visitors are now ‘users’ who were previously in the ‘non-user’ sample. By visiting the site, they now convert to ‘users’, and can then be assumed to gain the total user WTP of £7.18 once they have visited.
Note that this example is developed specifically for estimating the marginal value of changes to the museum for business case purposes. It is taken as given that all visitors will enjoy the improved experience of the museum which amounts to a WTP of £7.18, which is represented by the baseline WTP value of £6.01 added to the marginal increase WTP value of £1.17. For the purpose of a business case which focuses only on the additional value created through spending on a museum expansion or improvement scenario, the pre-existing volume numbers at the baseline WTP value of £6.01 are taken as given, so that we are only interested in estimating the marginal change for the improvement business case. This is why the baseline visitor numbers are assigned a lower value of £1.17, as this only represents the marginal improvement in the cultural value for those visitors. In reality, some of those baseline visitors would be repeat visitors and some would be new visitors, which does add an additional complication, but to be conservative, we apply only the additional WTP associated with the improvement for these baseline visitors for marginal analysis in SCBA.
Non-visitors in the general population are still assumed to hold non-use values for the museum, as estimated in the ACE benefit transfer study (£3.17, lower bound). However, until they become aware of the improvements made to the museum, they cannot be assumed to have gained from any marginal improvement to the site.[footnote 20] Furthermore, it is not entirely clear that non-visitors would gain marginal utility from simply knowing that the site has been improved if they never intend to visit. Part of the non-user group might hold option values and knowing that the site has been improved could increase that option value. However, it remains a challenge to distinguish between that part of the non-user WTP which consists of option value, and that which is more related to existence value or altruistic/bequest value. These issues are discussed in more detail in the section below.
Challenges with the simplified model and recommendations for future research
One of the objectives of the study was to produce a simplified version of the aggregation method which would require less additional data collection or survey design and not require analysts to have expertise in conjoint/discrete choice design. This would require analysts to collect data on current levels of likelihood to (re)visit among your visitor population. This question is already common in visitor surveys, but would need to be converted to an 11-point scale if measured on a different scale (e.g. 1-5). The approach would allow the analyst to calculate differences in mean likelihood score between the NRM improvement scenario and the mean likelihood score surveyed at your institution, and multiply the percentage difference by the pooled WTP value in the DCMS benefit transfer bank of values.
However, this approach is dependent on significant simplifying assumptions, the latter of which produces counterintuitive results around individuals with lower likelihood to (re)visit having higher WTP under the improvement scenario than those who are likely to (re)visit. There is no way to overcome this challenge without having information about the relationship between likelihood to (re)visit and WTP in the original benefit transfer study, and this information was not collected in the original study. Further work on the simple aggregation approach would therefore require further research to be undertaken to establish baseline likelihood to visit values within the benefit transfer database of values, which is not feasible at this stage. Problematic assumptions in the simple aggregation approach include:
- The simple method assumes that any improvements proposed at your institution are comparable to those proposed at the NRM (which might not be the case).
- It also assumes that the populations of visitors and non-visitors at your institution are directly comparable to those at the NRM, which may not be the case, due to differences in the areas of interest (transport history in the case of the NRM) and to regional differences in the prospective and non-visitor populations.
- In cases where your proposed improvements are substantively different to those at the NRM, you cannot assume that the differences in likelihood to (re)visit the NRM associated with those improvements would be replicated in your institution, because what you are proposing is very different. It would be likely to introduce considerable transfer error if you were to take the marginal value of those changes and apply them to your institution.
- The fundamental issue with the simple aggregation approach is that it requires an assumption that baseline WTP for every museum is the same, which is unlikely to be valid. The simple aggregation method is able to take a known baseline WTP and a status quo figure, and calculate the marginal WTP, based on the modelled improvement in score. However, this relies on an assumption that the museum in question has the same/similar attributes and levels to those that were tested in this research. This would require data on the baseline WTP values for every status quo likelihood to (re)visit level within the baseline benefit transfer study, which cannot be tested without additional data collection to repeat the previous benefit transfer research with inclusion of a likelihood to (re)visit question. In its current format, the simple aggregation produces a counterintuitive finding that the lower the starting status quo likelihood value, the larger the marginal improvement in WTP. In part this may be expected, given that those with lower likelihood to visit before the improvement have a higher potential improvement. However, it produces a non-linear relationship between likelihood to visit and WTP which assigns a higher welfare value to those who are less likely to visit, which would typically be taken as an indication of lower engagement in the site, which we would expect to be associated with lower WTP.
Given the problems identified above, we do not provide guidance on this simple aggregation method as it produced some challenges which require further research to address. However, it is possible that in the future the simple method could become more robust as (a) DCMS continue to both grow the traditional bank of values for assets and include likelihood to (re)visit questions in all future surveys; and (b) DCMS further grow a bank of values for changes in likelihood to visit different types of cultural and heritage site under different improvement scenarios.
Marginal values for non-user groups
Our working assumption is that the nature of the proposed changes at the NRM are fairly marginal in non-use terms. This is because the museum continues to exist in either scenario, and the non-use value that non-visitors gain from other people’s marginal increase in enjoyment of the museum would, for the respondent, be a marginal increase on top of an already marginal non-use value in their life. Nonetheless, due to the DCM design forcing non-users to express indifference in the DCM questions by using a likelihood to visit score that does not detect these potential marginal changes in non-use value, the marginal non-user WTP values elicited here are unlikely to be a true representation of total non-user WTP for the improvement to the NRM. It is likely that this DCM method predominantly captured changes to the option value element of non-use value, and did not fully incorporate the other elements of non-use value, such as existence, altruism, and bequest value. However, without further research it is not possible to say whether these results are an over- or under-estimate of marginal non-user WTP.
Going forward, in order to estimate reliable marginal non-use values from non-visitors, the survey would need more direct questions designed specifically for non-visitors. These questions would have to be designed to capture how (and if) they value the changes to the site, even if they never visit, in a way that would be sensitive both to the fact that they may never want to visit themselves (thus, excluding the possibility of estimating marginal WTP via likelihood to visit scores, as attempted in this survey), and in a way that is sensitive enough to capture the likely much lower marginal changes in value among non-visitor groups, compared to visitors.
Thus, it is very hard to say what effect, if any, the improvements would make to non-visitors’ non-use value, in terms of the existence of an improved NRM offering (existence value), its benefits to others now (altruistic value), and in the future (bequest value). This would require alternative survey design specifically for the non-user DCM survey and should be informed by more in-depth follow up analysis, potentially including mixed-methods qualitative data collection through focus groups with the general population of non-visitors.
This study has demonstrated that there is a greater need to resolve key questions around non-use value. Some of these issues were identified in the 2021 DCMS Cultural and Heritage Capital Framework document, and others have been expanded further by the 2022 AHRC/DCMS scoping study. Further research is needed to understand the flows of benefits that are associated with the theorised elements of TEV in terms of some of the specific taxonomies in the literature, including dimensions of aesthetic value, spiritual (or religious) value, social value (the extent that a thing provides people a sense of connection to others), historical value, symbolic, and authenticity value.[footnote 21] Moreover, there is little empirical research into the ways in which taxonomies of use and non-use value align with the way in which value for CHC assets is actually formed in people’s preferences. In short, rich qualitative and mixed methods research is required to establish the types of services which flow from different asset types, together with a better understanding of how these contribute to individual and collective wellbeing, whether in direct or indirect (enabling) ways.
In part, this can be informed by the advances in the natural capital sphere over the past decades. However, it is necessary to recognise that ecosystem services may differ in crucial ways from cultural services. While both cultural heritage and natural systems can be considered within a stocks and flows model, flows from natural systems (ecosystem services) are typically seen as an input into human production processes, of which aesthetic and spiritual enjoyment are just one element. Thus, natural capital contributes to the total accounts of national wealth as an input of services which can either be exploited or preserved for future use. Cultural and heritage capital can be seen both as an input to production processes (the production and sale of works of art, market prices paid for theatre performances and paid exhibitions etc), but also as an output of human production systems. Cultural and heritage services flow out of human production systems both as direct use values, and also non-use values. The work that goes into maintaining heritage sites and avoiding their deterioration has a value not just to those who visit or might like to visit. Non-users also gain utility from knowing that these sites are being maintained. The challenge is that these ‘pure’ non-use values (‘pure’ in that they exclude option value to visit in the future) is that they may be extremely marginal when considered for any single site. There is currently a gap in the literature on understanding how non-use values change when a person is asked to consider the existence of multiple sites (in other words, how they respond to the availability of substitutes), and whether these values are best elicited at the individual site or aggregate level (i.e., eliciting a willingness to pay to preserve all cultural or heritage assets of a particular type, in a way that aligns better with current taxation funding models for the culture and heritage sector).
Thus, in-depth research is required to better understand non-use value at a conceptual level for cultural and heritage assets in isolation and in combination. This is a necessary precursor to any future research into non-use WTP, and should be tested through a combination of quantitative experimental survey design, cognitive testing, and qualitative focus group work, to better understand and define the elements that constitute non-use value for different types of cultural/heritage assets in a ‘bottom-up’ way, informed by individual-level data.
Future survey design for eliciting marginal non-user WTP values should explore alternative methods to the likelihood to visit scores used in the current study. This may require a reversion to monetary values within the DCM study, or could use other quantitative index scales informed by the theoretical literature on non-use values (such as that used by Throsby for maintenance of different spiritual, aesthetic, and historic aspects of heritage assets),[footnote 22] or informed by qualitative focus group work and cognitive testing.
Appendix
Appendix 1: Choice modelling results: Marginal WTP for each improvement attribute (based on central estimate WTP from benefit transfer study)
Appendix Table 1 User WTP: Marginal likelihood to (re)visit and WTP per attribute (based on central estimate WTP from benefit transfer study)
| Level 2 | Level 3 | ||||
|---|---|---|---|---|---|
| Attribute | Likelihood score (0-10) | WTP (£) | Attribute | Likelihood score (0-10) | WTP (£) |
| New arrival point in current building | 0.33 | £0.35 | New arrival point in new entrance hall building | 0.34 | £0.36 |
| New third main gallery in new Central Hall | 0.11 | £0.12 | New larger third main gallery in new Central Hall ‘Plus’ | 0.09 | £0.10 |
| Museum remains unintegrated but level access over closed Leeman Road | 0.11 | £0.12 | Museum fully integrated: Constructing new Central Hall across closed Leeman Road | 0.40 | £0.44 |
| New West Entrance more visible from York station | 0.22 | £0.24 | |||
| Level step-free access throughout museum | 0.18 | £0.19 | |||
| Add new café | 0.12 | £0.13 | Add new destination restaurant | 0.04 | £0.05 |
| New audio-visual and programmable spaces, set in historic context | -0.06 | -£0.07 | |||
| Changing places toilet provide more space and equipment (in addition to accessible toilets) | 0.08 | £0.08 | |||
| Reference statistics: Status quo mean WTP and likelihood to (re)visit) | Likelihood to (re)visit | User WTP | |||
| 6.34 | £6.86 |
Appendix Table 2 Non-user WTP: Marginal likelihood to revisit and WTP per attribute (based on central estimate WTP from benefit transfer study)
| Level 2 | Level 3 | ||||
|---|---|---|---|---|---|
| Attribute | Likelihood score (0-10) | WTP (£) | Attribute | Likelihood score (0-10) | WTP (£) |
| New arrival point in current building | 0.17 | £0.13 | New arrival point in new entrance hall building | 0.29 | £0.22 |
| New third main gallery in new Central Hall | 0.07 | £0.06 | New larger third main gallery in new Central Hall ‘Plus’ | -0.03 | -£0.02 |
| Museum remains unintegrated but level access over closed Leeman Road | 0.02 | £0.01 | Museum fully integrated: Constructing new Central Hall across closed Leeman Road | 0.16 | £0.12 |
| New West Entrance more visible from York station | 0.16 | £0.12 | |||
| Level step-free access throughout museum | 0.28 | £0.21 | |||
| Add new café | 0.08 | £0.06 | Add new destination restaurant | 0.07 | £0.05 |
| New audio-visual and programmable spaces, set in historic context | 0.02 | £0.01 | |||
| Changing places toilet provide more space and equipment (in addition to accessible toilets) | 0.16 | £0.12 | |||
| Reference statistics: Status quo mean WTP and likelihood to (re)visit) | Likelihood to (re)visit | User WTP | |||
| 4.27 | £3.30 |
Appendix 2. Non-user (non-visitor) marginal WTP values
Non-visitor marginal WTP values are reported here in the appendix, but should not be used for SCBA purposes due to ongoing methodological uncertainties around the estimation of marginal non-use WTP in a DCM survey such as this. As discussed in the methodological limitations section, to estimate reliable marginal non-use values from non-visitors, the survey would need more direct questions designed specifically for non-visitors. These questions would have to be designed to capture how (and if) they value of the changes to the site, even if they never visit, in a way that would be sensitive both to the fact that they may never want to visit themselves (thus, excluding the possibility of estimating marginal WTP via likelihood to visit scores, as attempted in this survey), and in a way that is sensitive enough to capture the likely much lower marginal changes in value among non-visitor groups, compared to visitors.
Non-user (non-visitor) marginal WTP range for the improvement scenario (per person) is estimated in the DCM to range from +£0.64 to +£0.86 per non-visitor, equivalent to 27.4% of baseline WTP without the improvement.
Non-visitor marginal WTP is lower than visitor WTP, as we would expect. Note that the percentage difference in marginal WTP for the improvement among non-visitors is higher (27%) compared to visitors (19%), but this is due to the lower initial baseline value (note that the absolute difference in likelihood to visit on a 0-10 is lower among non-visitors at 1.17 compared to 1.22 among visitors.
Appendix Table 3 Discrete Choice: Non-visitor marginal Willingness to Pay for improvement vs status quo scenarios
| General public non-visitors | |
|---|---|
| Status quo | 4.27 |
| Improvement scenario | 5.44 |
| Difference in likelihood to (re)visit (0-10 scale) | 1.17 |
| Difference (%) | 27.4% |
| Baseline WTP (Status quo) - central estimate | £3.30 |
| Baseline WTP (Status quo) - lower bound | £2.46 |
| Marginal WTP (Improvement) - central estimate | +£0.90 |
| Marginal WTP (Improvement) - lower bound | +£0.67 |
| Sample size | 584 |
Appendix Table 4 Non-user WTP: Marginal likelihood to revisit and WTP per attribute (based on lower bound WTP from benefit transfer study)
| Level 2 | Level 3 | ||||
|---|---|---|---|---|---|
| Attribute | Likelihood score (0-10) | WTP (£) | Attribute | Likelihood score (0-10) | WTP (£) |
| New arrival point in current building | 0.17 | £0.10 | New arrival point in new entrance hall building | 0.29 | £0.17 |
| New third main gallery in new Central Hall | 0.07 | £0.04 | New larger third main gallery in new Central Hall ‘Plus’ | -0.03 | -£0.01 |
| Museum remains unintegrated but level access over closed Leeman Road | 0.02 | £0.01 | Museum fully integrated: Constructing new Central Hall across closed Leeman Road | 0.16 | £0.09 |
| New West Entrance more visible from York station | 0.16 | £0.09 | |||
| Level step-free access throughout museum | 0.28 | £0.16 | |||
| Add new café | 0.08 | £0.04 | Add new destination restaurant | 0.07 | £0.04 |
| New audio-visual and programmable spaces, set in historic context | 0.02 | £0.01 | |||
| Changing places toilet provide more space and equipment (in addition to accessible toilets) | 0.16 | £0.09 | |||
| Reference statistics: Status quo mean WTP and likelihood to (re)visit) | Likelihood to (re)visit | User WTP | |||
| 4.27 | £2.46 |
Figure 3 Non-user group: Marginal likelihood to (re)visit score per attribute (status quo reference)
| Attribute | Change in likelihood to (re)visit |
|---|---|
| No arrival point | 0.00 |
| New arrival point in current building | 0.17 |
| New arrival point in new entrance hall building | 0.29 |
| Two main galleries: Great Hall and Station Hall | 0.00 |
| New third main gallery in new Central Hall | 0.07 |
| New larger third main gallery in new Central Hall ‘Plus’ | -0.03 |
| Museum remains unintegrated under the closed Leeman Road | 0.00 |
| Museum remain unintegrated but level access over closed Leeman Road | 0.02 |
| Museum fully integrated: constructing new Central Hall across closed Leeman Road | 0.16 |
| Museum poorly visible from York Station | 0.00 |
| New West Entrance more visible from York Station | 0.16 |
| Accessibility reliant on two small lists and stairs | 0.00 |
| Level step-free access throughout museum | 0.28 |
| Maintain current cafe facilities | 0.00 |
| Add new cafe | 0.08 |
| Add new destination restaurant | 0.07 |
| Galleries display only rail vehicles | 0.00 |
| New audio-visual and programmable spaces, set in historic context | 0.02 |
| Accessible toilets and baby changing facilities | 0.00 |
| Changing places toilet provide more space and equipment (in addition to accessible toilets) | 0.16 |
Ipsos standards and accreditations
Ipsos’ standards and accreditations provide our clients with the peace of mind that they can always depend on us to deliver reliable, sustainable findings. Our focus on quality and continuous improvement means we have embedded a “right first time” approach throughout our organisation.
ISO 20252: This is the international market research specific standard that supersedes BS 7911/MRQSA and incorporates IQCS (Interviewer Quality Control Scheme). It covers the five stages of a Market Research project. Ipsos was the first company in the world to gain this accreditation.
Market Research Society (MRS) Company Partnership: By being an MRS Company Partner, Ipsos endorses and supports the core MRS brand values of professionalism, research excellence and business effectiveness, and commits to comply with the MRS Code of Conduct throughout the organisation. We were the first company to sign up to the requirements and self-regulation of the MRS Code. More than 350 companies have followed our lead.
ISO 9001: This is the international general company standard with a focus on continual improvement through quality management systems. In 1994, we became one of the early adopters of the ISO 9001 business standard.
ISO 27001: This is the international standard for information security, designed to ensure the selection of adequate and proportionate security controls. Ipsos was the first research company in the UK to be awarded this in August 2008.
The UK General Data Protection Regulation (GDPR) and the UK Data Protection Act (DPA) 2018: Ipsos is required to comply with the UK GDPR and the UK DPA. It covers the processing of personal data and the protection of privacy.
HMG Cyber Essentials: This is a government-backed scheme and a key deliverable of the UK’s National Cyber Security Programme. Ipsos was assessment-validated for Cyber Essentials certification in 2016. Cyber Essentials defines a set of controls which, when properly implemented, provide organisations with basic protection from the most prevalent forms of threat coming from the internet.
Fair Data: Ipsos is signed up as a “Fair Data” company, agreeing to adhere to 10 core principles. The principles support and complement other standards such as ISOs, and the requirements of Data Protection legislation.
-
We would like to thank Harman Sagger who provided the overarching aims and initial overall approach and aim of the study in terms of linking existing contingent valuation studies to a discrete choice modelling approach. ↩
-
The Green Book: appraisal and evaluation in central government ↩
-
R. N. Lawton et al., ‘Local Museums Benefit Transfer Report’ (Arts Council England, 2022), https://www.artscouncil.org.uk/sites/default/files/download-file/Local%20Museums%20Report.pdf. ↩
-
David Throsby, Anita Zednik, and Jorge E. Araña, ‘Public Preferences for Heritage Conservation Strategies: A Choice Modelling Approach’, Journal of Cultural Economics 45, no. 3 (1 September 2021): 333–58, https://doi.org/10.1007/s10824-021-09406-7. ↩
-
The Green Book: appraisal and evaluation in central government ↩
-
David Throsby, Anita Zednik, and Jorge E. Araña, ‘Public Preferences for Heritage Conservation Strategies: A Choice Modelling Approach’, Journal of Cultural Economics 45, no. 3 (1 September 2021): 333–58, https://doi.org/10.1007/s10824-021-09406-7. ↩
-
I. Bateman et al., Economic Valuation with Stated Preference Techniques: A Manual (Cheltenham, UK: Edward Elgar, 2002). ↩
-
Ricky N. Lawton et al., ‘Comparing the Effect of Oath Commitments and Cheap Talk Entreaties in Contingent Valuation Surveys: A Randomised Field Experiment’, Journal of Environmental Economics and Policy, 11 November 2019, 1–17, https://doi.org/10.1080/21606544.2019.1689174; Gregory Howard et al., ‘Hypothetical Bias Mitigation Techniques in Choice Experiments: Do Cheap Talk and Honesty Priming Effects Fade with Repeated Choices?’, Journal of the Association of Environmental and Resource Economists 4, no. 2 (20 February 2017): 543–73, https://doi.org/10.1086/691593; Fredrik Carlsson, Peter Frykblom, and Carl Johan Lagerkvist, ‘Using Cheap Talk as a Test of Validity in Choice Experiments’, Economics Letters 89, no. 2 (November 2005): 147–52, https://doi.org/10.1016/j.econlet.2005.03.010. ↩
-
Katherine Needham and Nick Hanley, ‘Prior Knowledge, Familiarity and Stated Policy Consequentiality in Contingent Valuation’, Journal of Environmental Economics and Policy 9, no. 1 (2 January 2020): 1–20, https://doi.org/10.1080/21606544.2019.1611481. ↩
-
All survey participants in this research were England residents aged 16+ and will have answered a detailed consent form. Ipsos is compliant with the highest regulatory standards for the legal and safe processing of personal and/or sensitive data, including the Market Research Society Code of Conduct, IS0 27001, 20252, 9001 and GDPR. We are also a Fair Data company and an MRS Company Partner and compliant with GDPR, the Data Protection Act, HMG Cyber Essentials, UK Statistics Code of Practice, the GSR Code and the MRS Code of Conduct. In terms of retention and destruction of personal data, our processes ensure that we meet client contractual requirements as well as GDPR legislation regarding how information should be labelled, handled, stored, transferred and destroyed. Any personal data is collected (usually two months after projects are completed). Identifiable data is anonymised when reporting. This will be outlined in a privacy notice available to participants, which would also provide details on why we are collecting the data, what is being used for and any further information for participants to make a subject access request, which we would promptly respond to. Alongside these measures, we would reassure DCMS that all work is conducted in-house by Ipsos MORI staff and researchers who have undergone data protection and GDPR training. ↩
-
R. N. Lawton et al., ‘Local Museums Benefit Transfer Report’ (Arts Council England, 2022) ↩
-
In the case of museums and galleries, and heritage centres, the dominant covariates on participation and frequency of participation (engagement) of respondents to the DCMS Taking Part Survey are sex, educational attainment, socio-economic group, ethnicity, and newspaper readership ↩
-
ACE Guidance Note: How to quantify the public benefit of your Museum using Economic Value estimates ↩
-
ACE Guidance Note: How to quantify the public benefit of your Museum using Economic Value estimates ↩
-
ACE Guidance Note: How to quantify the public benefit of your Museum using Economic Value estimates ↩
-
ACE Guidance Note: How to quantify the public benefit of your Museum using Economic Value estimates ↩
-
If this approach were to be taken forward, to err on the side of caution, this additional marginal non-use value would only be assumed to be ‘activated’ when members of the non-visitor population become aware of the improvement (otherwise they are not familiar with the cultural improvements to the existence of the site and its benefits to others (altruism) and future generations (bequest value)). This information could potentially be inferred through observational data such as public surveys or social media analysis, but in the absence of reliable data on public awareness, this may require an assumptions-led approach. ↩
-
David Throsby, Economics and Culture (Cambridge UK: Cambridge University Press, 2001). ↩
-
David Throsby, Anita Zednik, and Jorge E. Araña, ‘Public Preferences for Heritage Conservation Strategies: A Choice Modelling Approach’, Journal of Cultural Economics 45, no. 3 (1 September 2021): 333–58, https://doi.org/10.1007/s10824-021-09406-7. ↩