Value for Money metrics report - annex to Global Accounts 2021 (accessible version)
Updated 24 February 2022
Applies to England

© Crown copyright 2022
This publication is licensed under the terms of the Open Government Licence v3.0 except where otherwise stated. To view this licence, visit nationalarchives.gov.uk/doc/open-government-licence/version/3 or write to the Information Policy Team, The National Archives, Kew, London TW9 4DU, or email: psi@nationalarchives.gov.uk.
Where we have identified any third party copyright information you will need to obtain permission from the copyright holders concerned.
This publication is available at https://www.gov.uk/government/publications/2021-global-accounts-of-private-registered-providers/value-for-money-metrics-report-annex-to-global-accounts-2021-accessible-version
1. Executive summary
1.1 The Value for Money Standard requires registered providers to annually report on their performance against a suite of metrics defined by the regulator to support transparency across the sector. The regulator is publishing sector analysis based on this information which allows providers, their boards and other stakeholders to measure their performance and see how they compare to other similar organisations.
1.2 The impact of the COVID-19 pandemic posed a significant challenge to the sector over the past year. The disruption to business operations caused by the lockdown and subsequent restrictions resulted in delays to capital investment programmes as well as planned and responsive repairs to existing social housing stock. These events and conditions have had a profound effect on the sector’s value for money performance for the period to March 2021 relative to previous year’s outturn.
1.3 Reassuringly, the regulator’s Coronavirus Operational Responses Survey demonstrated that the safeguarding of tenants and the delivery of essential services including remedial safety works remained a key priority throughout the year. While some capital investment programmes have been delayed, the sector remains committed to investing in existing stock including building safety, catch-up on repairs and maintenance as well as energy improvement programmes - see RSH Global Accounts of Registered Providers 2021.
1.4 Over the past year, reinvestment into existing and new social housing stock was 5.8% of the total value of existing stock compared to 7.2% in the previous year. The total nominal reinvestment into new supply and existing stock for rent was £9.5bn compared to £12.2bn in 2020. Works to existing social properties decreased in nominal terms from £1.9bn in 2020 to £1.6bn in 2021 due to pandemic-enforced restrictions around movement.
1.5 The sector delivered a total of 41,000 new social homes during the year. The average weight of new social homes delivered was equivalent to 1.3% of existing stock in 2021 compared to 1.5% the previous year, with some notable variation by size, region and transfer status.
1.6 The median Headline Social Housing Cost metric fell by 2.7% to £3,730 per unit. The reduced expenditure has been driven by lower levels of spend on maintenance and major repairs which fell by 6% compared to previous years. The restrictions meant that for part of the year, planned and routine repairs [footnote 1] were deferred. While providers have reacted quickly to manage the backlog of non-emergency repairs, the latest financial forecasts [footnote 2] indicate that headline costs are expected to rise by 5% over the next five years. With inflationary pressures persisting and the delivery of safety improvements to existing stock continuing at pace, there is an increasing risk that headline costs could rise further.
1.7 The debt-based value for money measures reflect the sector’s strong financial capacity. The weighted average EBITDA interest cover increased by 13 percentage points compared to previous years as a result of the return of permitted CPI +1% rent increases and lower operating expenditure. Meanwhile gross debt also increased by 3.4% to £85.9bn compared to previous years. The weighted average gearing metric however reduced from 47.7% to 47.2% due to the impact of higher property valuations outweighing the impact of additional debt raised during the year.
1.8 Value for money performance at a sub-sector and regional level is also included in this report which provides more detailed insights into different types of registered providers. The analysis shows that there continue to be material differences in reported performance between different sub-groups.
1.9 The COVID-19 pandemic and its aftermath further highlight the importance of performance monitoring and the need to improve reporting in this area. While the sector has reacted flexibly to the disruption caused by the pandemic, uncertain economic pressures and competing demands on providers further emphasise the importance for boards to be clear about their strategy and objectives and how resources and assets are applied in the delivery of strategic priorities.
1.10 As the sector continues to face greater scrutiny, it is imperative that providers strengthen reporting on performance, particularly about stock quality and service delivery, to allow tenants, investors and other stakeholders to hold providers to account.
1.11 An understanding of an organisation’s business strategy and financial performance is critical to understanding the likelihood of its success. By focusing on the right performance information across the business, boards and executives will ultimately be in a better position to make the right decisions. Being able to measure, understand and compare the trade-offs between different options are effective ways to ensure that providers’ business models achieve the optimal outcome and impact for all stakeholders.
1.12 The regulator adopts a co-regulatory approach. In the value for money context this means that we seek assurance from providers as to how they are meeting the requirements of the Value for Money Standard in terms of decision-making and strategic approach. Reporting can provide valuable additional assurance of how effective this is in practice, as well as making the sector more transparent and accountable to its tenants and other stakeholders.
2. Introduction
2.1 This report builds on the value for money performance reviews undertaken by the regulator annually. It refreshes and updates the sector’s latest value for money performance data for the period ended 31 March 2021. It also gives additional focus to some topical issues around value for money reporting in the provider’s statutory accounts, in particular around areas where further improvements are needed. These have been identified as part of the regulator’s assurance review work.
2.2 Registered providers are required to measure their performance on value for money against their strategic objectives and priorities which should be measured through a range of targets. Registered providers’ performance cannot be wholly judged by a standard set of performance measures alone and it is for this reason that they outline their broader achievements, including with provider-specific measures where appropriate. The standard includes a requirement that providers must be clear where they fall short of their targets when compared to their strategic priorities.
2.3 The principles of the VFM standard also require registered providers to be accountable to stakeholders who increasingly want to understand the value created with the assets and resources available to them. This means that stakeholders, including tenants, expect to find information they can trust to effectively monitor performance against registered provider’s strategic objectives and associated targets.
2.4 The VFM performance metrics, both those prescribed by the regulator and registered providers’ own measures should capture the essence of providers’ strategic priorities. The regulator expects the approach of setting targets and appraising performance using these metrics to be sufficiently challenged by boards. It also expects boards to have the facts they need to make fully informed decisions about their strategic priorities, this includes accurate data.
2.5 Never has it been so important to have accurate and reliable data – it is essential for effective decision-making. Continued uncertainty around the operating environment including the housing market and new requirements to improve stock quality are likely to result in consideration of both business models and the effectiveness of the organisation.
2.6 For some providers, this will require boards to improve the systems they have in place to assess the overall efficiency of their housing stock which may involve making difficult decisions around investment choices.
2.7 This publication summarises the metrics data for the sector as a whole and segments of the sector according to some of its characteristics (such as supported housing stock, housing for older people stock, stock transfer status and geographical location). It also provides commentary on some of the key themes emerging from the data.
2.8 The summary information is intended to help registered providers and other interested stakeholders to contextualise the performance of individual providers and to benchmark organisations with defined characteristics. The suite of value for money metrics that registered providers are required to report against, and their calculation, are summarised in Annex A.
2.9 The publication is divided into five sections:
- Section 3 sets out our regulatory approach.
- Section 4 considers how providers should address the wider reporting requirements of the Standard, beyond the standard metrics.
- Section 5 presents the aggregate metrics results for the whole sector, including the quartile distributions for each metric.
- Section 6 assesses the metric performance for sub-sector groups, following the explanatory factors identified in previous analysis of cost variation in the sector.
- Section 7 assesses value for money performance at a regional level.
2.10 To supplement sector level performance the regulator also publishes providers’ performance on the range of VFM metrics to help organisations benchmark their performance more easily – this data can be found on our website.
2.11 The regulator does not have required benchmarks or targets for the standard VFM metrics. Some of them work against each other, and no provider is likely to be in the “best” quartile on all measures. The expectation is that providers will engage with the VFM metrics and present information which increases transparency and understanding.
3. Regulatory approach
3.1 The regulator has always made clear that it is for boards to decide how they run their businesses and assure themselves that they are complying with the regulatory standards. It is important that boards should understand the range of factors that influence performance in order that they challenge the performance of their own organisation.
3.2 The demands on registered providers are increasing as the expectations from government and tenants rise. In considering whether the organisation delivers value for money, boards must be clear regarding the delivery of their outcomes. The regulator will continue to seek assurance that providers make the best use of their resources and their assets and have clear plans in place to make ongoing improvements to the value for money in their organisations.
3.3 As part of all In-Depth Assessments, the regulator will seek assurance around the robustness of decision-making and board challenge on key areas of operational performance, and on overall strategic delivery performance. This includes for instance consideration around investment into services or business streams in the delivery of their own strategic objectives.
3.4 The regulator will use the value for money metrics to identify cases which may indicate a lack of assurance on value for money performance. In such cases we may need to engage with registered providers to seek further assurance that the organisation is meeting the requirements of the Standard. Where we evidence material weaknesses, we will reflect this in our regulatory judgements.
4. Reporting in the accounts
4.1 The purpose of this section is to address important issues on VFM reporting that the regulator has identified to inform boards and support stakeholder confidence. It sets out what the regulator is looking for and how registered providers can improve reporting to better meet the needs of all their stakeholders. The regulator recognises that for some providers disclosure of all relevant data relating to performance due to commercial sensitivity may not always be possible.
4.2 Registered providers must ensure that VFM reporting undertaken in the accounts meets all the reporting requirements of the Standard. The Standard requires providers to annually publish the following evidence in their statutory accounts:
| Value for Money Standard – Reporting requirements |
|---|
| a. performance against its own value for money targets and any metrics set out by the regulator, and how that performance compares to peers; and |
| b. measurable plans to address any areas of underperformance, including clearly stating any areas where improvements would not be appropriate and the rationale. |
4.3 The VFM Code of Practice emphasises the importance of transparency and accountability to drive improvement, as well as performance monitoring and reporting needed to support this. It also encourages providers to explain their interpretation of their reported metrics – what is driving their performance and being upfront when planned targets have not been achieved. We encourage boards to use this when reporting in the future.
Reporting in the 2021 accounts
4.4 The regulator acknowledges the degree of disruption over the past few years as providers responded to the demands of the COVID-19 pandemic. It also understands the continued challenges on delivery of a range of services and investment activities.
4.5 In an effort to support the sector during the first year of the COVID-19 pandemic, the regulator took a proportionate approach to reduce the regulatory burden of providers around reporting of forward-looking performance targets. We recognised that this element of the standard was difficult to deliver in the circumstances as providers reworked their business plans to respond to the pandemic. In June 2021, the regulator publicly updated its expectations on reporting arrangements and reverted to its usual requirements.
4.6 During these uncertain times, boards have had to swiftly adjust their business priorities and rethink their operational models. Understanding how an organisation is progressing in pursuit of its strategic priorities as a part of business continuity plans and how it is adapting to changes effectively is of growing importance to a wide range of stakeholders.
4.7 In such instances where plans have been revised, providers should report meaningfully and explain the rationale and impact of these changes. The focus on reporting should relate coherently; this includes consideration of performance measures and associated targets to reflect those changes – this was an area of reporting weakness this year which made it difficult to examine how an organisation was performing against revised priorities.
4.8 It is also important that providers can articulate what trade-offs were necessary, the rationale for those decisions and how they link to the longer-term success of the organisation. Providing that level of information should significantly improve stakeholders’ ability to evaluate the credibility of the organisation’s plans and achievements.
4.9 Transparency around investment decisions into non-social housing activities is also an important aspect of reporting. It allows stakeholders understand whether boards have considered the extent to which returns generated are proportionate to the risks of engaging in those activities. As a part of this year’s assessment, we found only a minority of providers reported on asset performance at a granular level – this included business streams that were not performing to their full potential.
4.10 The reports this year also showed that there is an increasing divergence from the reporting methodology set out in the VFM Technical Note in which to calculate the regulator’s VFM metrics. Where we identified material discrepancies, these were followed up with the organisations concerned. Following the requirements of the technical note in calculating the metrics is mandatory. Departures from the prescribed approach undermine consistency across the sector and its use by providers to compare themselves against their peers.
4.11 Notwithstanding some improvement on reporting over the past few years, the regulator expects registered providers to consider this section when preparing its accounts in the future. Other notable areas of reporting that could be improved on include:
- performance against targets
- peer group analysis
- disclosures around shortfalls in performance, and
- data quality.
Performance against targets
4.12 As discussed earlier, the regulator recognises the pressure on providers and the difficulty that boards have had in setting targets during the pandemic. However, all providers are reminded of the importance of reporting against targets. While most providers recorded their actual performance against targets, a shared feature for a minority of providers was publishing targets measured against all the regulator’s metrics and in some instances providers own performance measures also. In such instances where providers are unable to report against the regulator’s metrics, a disclosure note should be included.
4.13 All stakeholders are interested to know what the strategic priorities of an organisation are, its progress to date and its priorities going forward. Performance against targets provides valuable insight as to whether expected levels of delivery are being achieved or not. Failure to report robustly against targets can obscure the outputs and outcomes the organisation has achieved.
4.14 Reports that fail to disclose targets against the regulator’s metrics or providers’ own measures, make it difficult for stakeholders to understand performance over time and plans in the short term for achieving success. It also raises some doubt as to whether boards are sufficiently challenging and holding executives to account.
Peer group analysis
4.15 The Standard also requires providers to publish information that allows stakeholders to assess how their performance compares to peers. Typically, most providers report against a peer group and while it is for each provider to determine who they compare themselves to, a growing number of providers continue to compare themselves against the sector as a whole or with groups of providers with few characteristics in common. While the regulator recognises that there is no ‘perfect match’ for peers, it is essential that providers chose a peer group that generally reflects their operational model for the purposes of quality, cost, or efficiency comparisons
4.16 For boards to understand how their organisation compares to another similar group, they could consider the following:
- Size of provider
- Region(s) of operation due to drivers such as regional wage or deprivation
- Providers with a similar business focus, such as supported housing activity, or LSVT providers with large programmes of reinvestment into existing stock.
Measurable plans to improve performance
4.17 As noted earlier a key principle of the Standard is transparency. All providers are expected to share information about the actions and outcomes that board and management consider necessary when their organisation falls short of planned performance to reassure all stakeholders.
4.18 Being explicit about underperformance is an area of reporting that providers consistently struggle with. Reports that do not discuss the implications of what results mean and what actions are being taken could suggest poor governance arrangements which the regulator will investigate as a part of its planned engagement.
4.19 From time to time, performance may relate to factors outside of the provider’s control. The Code of Practice is clear that any supporting narrative should be factual and concise - where performance has for example been affected by government policy or economic factors, the regulator expects providers to contextualise the impact it has had on the business.
4.20 Most providers have a social purpose and ultimately social objectives that help fund and deliver effective outcomes such as support facilities to tenants and local communities beyond the provision of housing. This includes for example, training, employment and advisory services. In such cases where these activities are undertaken providers are encouraged to report on returns generated in order that stakeholders can better understand the impact of these investments also.
Data quality
4.21 Registered providers are reminded that the regulator’s suite of VFM metrics should be calculated on a group consolidated basis, reflecting all activities for registered and unregistered entities.
4.22 Registered providers need good data to run effective services and make the right decisions. While the vast majority of providers continue to report against the regulator’s VFM measures, a small minority have diverged from the required methodology. This includes changes that favourably adjust the providers’ results, such as, omitting one-off costs, including gains on disposals (which should be excluded from the Operating Margin metrics), and including units that do not adhere to the definitions set out in law [footnote 3] or wider regulatory guidance material.
4.23 Providers are also encouraged to report separate measures for different business segments if aggregation hides significant variation that facilitates the value for money reporting process. Where providers have incorporated their own measures or lender’s measures this should be clearly indicated as a part of the collective narrative.
4.24 The integrity of reported performance is not just limited to the regulator, it is also an important tool to third parties, including other providers, their tenants and a wide range of stakeholders for benchmarking purposes.
5. Sector analysis
Table 1: Summary of sector trends (2019-2021: Providers owning / managing more than 1,000 homes)
| VFM metric | Reinvestment | New supply (social) | New supply (Non-social) | Gearing | EBITDA MRI interest cover | Headline social housing CPU (£K) | Operating margin (social) | Operating margin (overall) | Return on capital employed | |
|---|---|---|---|---|---|---|---|---|---|---|
| Upper quartile | 2021 | 8.20% | 2.00% | 0.09% | 53.30% | 248% | £4.76 | 32.60% | 28.20% | 4.20% |
| 2020 | 10.00% | 2.40% | 0.15% | 54.70% | 227% | £4.86 | 32.30% | 28.60% | 4.40% | |
| 2019 | 8.70% | 2.50% | 0.13% | 53.90% | 238% | £4.69 | 34.60% | 30.80% | 4.70% | |
| Median | 2021 | 5.80% | 1.30% | 0.00% | 43.90% | 183% | £3.73 | 26.30% | 23.90% | 3.30% |
| 2020 | 7.20% | 1.50% | 0.00% | 44.00% | 170% | £3.83 | 25.70% | 23.10% | 3.40% | |
| 2019 | 6.20% | 1.50% | 0.00% | 43.40% | 184% | £3.69 | 29.20% | 25.80% | 3.80% | |
| Lower quartile | 2021 | 4.00% | 0.50% | 0.00% | 32.90% | 134% | £3.21 | 22.20% | 18.10% | 2.70% |
| 2020 | 4.90% | 0.70% | 0.00% | 33.00% | 126% | £3.34 | 20.80% | 18.10% | 2.60% | |
| 2019 | 4.20% | 0.60% | 0.00% | 32.60% | 139% | £3.18 | 23.10% | 20.00% | 3.00% | |
| Weighted average | 2021 | 5.70% | 1.40% | 0.22% | 47.20% | 151% | £4.15 | 28.30% | 22.30% | 3.10% |
| 2020 | 7.60% | 1.80% | 0.31% | 47.70% | 138% | £4.25 | 27.80% | 22.10% | 3.20% | |
| 2019 | 6.40% | 1.60% | 0.31% | 46.70% | 153% | £4.12 | 30.50% | 25.00% | 3.60% | |
Key themes from analysis
5.1 The distribution of performance on the regulator’s metrics which includes the sector median and upper and lower quartiles for each of the metrics over the past three years is shown in table 1.
5.2 While the sector continues to take substantial measures to mitigate the negative operational impact of the COVID-19 pandemic, the related lockdown and restriction measures have affected the range of value for money measures. These impacts are described in the remainder of this report.
5.3 The analysis shows that there are wide differences between providers with the highest level of new supply and reinvestment (which captures both reinvestment into existing stock and new supply). The upper quartile reinvestment figures for the year were 8.2% and for lower quartile of providers it was 4% of the value of existing stock. New Supply (social) units delivered as a total of stock owned, ranged from 0.5% in the lower quartile to 2% for providers in the upper quartile.
5.4 The median Headline Social Housing Cost metric fell by 2.7% to £3,730 per unit. Over the past three years the variance between the least expensive providers and the median has remained broadly unchanged. The distribution of movement in headline costs shows the upper quartile and median falling by £100 per unit and the lower quartile by £120 per unit.
5.5 A broadly similar pattern applies to the distribution of performance on operating margins (Social) and return on capital employed. This is relatively unsurprising given both measures are driven by operating cost performance.
5.6 The sector average EBITDA MRI interest cover remains strong at 183%. Meanwhile the range of gearing (an indicator of a provider’s ability to take on more debt), reported suggest a relatively higher level of gearing amongst providers in the upper quartile of 53.3% compared to the sector average of 43.9%, which in some cases can limit their ability to take on more debt.
Reinvestment and new supply
5.7 During the first lockdown, construction work and non-essential repairs were not permitted across the country. Despite restrictions easing later in the year and capital programmes resuming, supply chain disruption and labour shortages continued to delay progress.
5.8 At a sector level, total reinvestment in to new or existing social housing properties for rent fell to £9.5bn in 2021 compared to £12.2bn in the previous year, while the supply of new social housing units fell from 50k units to 41k units over the same period.
5.9 The sector analysis demonstrates that there continues to be significant variance in new supply delivery, with the lower quartile delivering homes equivalent to 0.5% of their existing stock in 2021 compared to 2.0% for the upper quartile.
5.10 Registered providers in the lower quartile include a disproportionally high number of organisations who provide specialist care and support and small London based providers. Specialist care and support providers tend to have relatively tighter revenue margins from which they can invest in new supply compared to their traditional counterparts and in some cases less flexible lending terms. In particular, small London based providers do not have the economies of scale required to cross-subsidise new social development due to higher than average development costs in London.
Table 2: Sector level reinvestment broken down by investment type
Notes:
Works to existing [footnote 6]
Development and other [footnote 7]
| Sector | |||||
|---|---|---|---|---|---|
| Reinvestment (median) | Reinvestment (weighted average) | Works to existing (weighted average) | Development and other (weighted average) | Housing properties at cost or valuation | |
| 2021 | 5.77% | 5.72% | 0.94% | 4.79% | £165.5bn |
| 2020 | 7.22% | 7.58% | 1.21% | 6.38% | £160.4bn |
| 2019 | 6.24% | 6.40% | 1.27% | 5.13% | £150.8bn |
| 2020-21 % Change | -20.00% | -24.50% | -22.30% | -24.90% | 3.20% |
| 2019-20 % Change | 15.70% | 18.50% | -5.10% | 24.40% | 6.30% |
5.11 Despite the sector’s commitment to reducing a backlog of major repairs and maintenance programmes towards the latter half of the year following lockdown periods, works to existing social properties in nominal terms fell from £1.9bn in 2020 to £1.6bn in 2021 (20%). The reductions in reinvestment are not as pronounced when assessed over a three-year period due to the material increases seen in the pre-pandemic period between 2019 and 2020.
5.12 Over the past three-years, the median reinvestment as a percentage of total fixed assets fell from 6.24% to 5.77%. The weighted average reinvestment also fell from 6.40% to 5.72% over the same period. The decrease in reinvestment across the sector as a whole relates to both works to existing social housing stock and development of new supply (social) – the weighted average of each component fell by 0.33 and 0.34 percentage points respectively.
Debt based metrics
5.13 The debt-based metrics which include EBITDA MRI interest cover and Gearing [footnote 8] show some indication of a registered provider’s financial capacity. Although there are variations between different groups of providers, overall, the results demonstrate the sector’s continued financial strength which could service additional debt and support continued investment. The median Interest Cover for the year was 183%, while the lowest quartile reported Interest Cover of 134%, rising to 248% for those providers in the upper quartile.
5.14 At a sector level, interest payable increased by 4% as providers took on more debt to fund future investment programmes. The weighted average Interest Cover increased by 13 percentage points compared to the previous year. The increase reflects a rise in Social Housing Lettings (SHL), income over the year as inflationary rent increases were permitted again from April 2020 onwards. The increase is also affected by the reduced expenditure on capitalised major repairs due to the COVID-19 pandemic restrictions.
5.15 Despite increased economic uncertainty, liquidity across the sector remains strong. Over the past year gross debt increased by 3.4% to £85.9bn compared to £83.1bn in 2020 [footnote 9].
5.16 Gearing, which measures net debt as a percentage of the total asset base, indicates the degree of dependence on debt finance. Fluctuations to gearing in the upper quartile over the last three years reflect the increase in the net book value of social housing assets rather than a fall in debt per property which has remained relatively stable. In contrast, indebtedness in the lower quartile has remained relatively constant over the same period, indicating that some providers may be restricted by lending covenants or the capacity to service new loans limiting them from taking on new debt.
5.17 The weighted average gearing however reduced from 47.7% to 47.2%. The decrease relative to last year is attributed to higher levels of cash retention as a result of on-going restrictions and delays to capital programmes (cash and cash equivalents increased by £1.1bn compared to previous years), this was mirrored by a similar increase in asset values of 3.2%.
| Weighted average | |||||
|---|---|---|---|---|---|
| 2021 | 2020 | 2019 | 2020-21 % change | 19-20 % change | |
| Management | £1,075 | £1,068 | £1,045 | 0.6% | 2.1% |
| Service charges | £678 | £662 | £626 | 2.4% | 5.8% |
| Maintenance and major repairs | £1,926 | £2,051 | £1,965 | -6.1% | 4.4% |
| Other | £470 | £468 | £481 | 0.5% | -2.8% |
| HSHC | £4,150 | £4,249 | £4,118 | -2.3% | 3.2% |
5.18 Over the past year, the sector’s weighted average Headline Social Housing Cost per unit fell by 2.3% to £4,150. The reported dip in costs was largely driven by lower maintenance and major repairs expenditure which fell by 6.1% due to restrictions around planned works
5.19 Over the past three years, management costs per unit increased by 2.9%; in real terms however, that is allowing for inflation, the overall increase is only 0.7% over the same period. Despite the impact of coronavirus on wages and employment throughout 2020, costs continue to be influenced by upward pressure on wages and relatively low unemployment.
5.20 The latest quarterly data shows that unemployment between November 2020 and January 2021 was 5.0%, compared to a recorded low of 3.8% in 2019. Average weekly earnings for total pay have increased by 6.6% between March 2019 and March 2021 - a 4.3% real terms increase. This means that for those organisations with significant resources at or near the minimum wage, real costs of labour are likely to have risen by a higher proportion due to real terms increases in the Living Wage rate. The rate stood at £8.72 between April 2020 and March 2021, 6.2% above the previous year.
5.21 Since 2019, the weighted average costs associated with providing services has also increased by 8.3% to £678 per unit. There is tentative evidence which suggests that the increase in service charge expenditure over the past three years is likely associated with costs relating to building safety compliance costs and the delivery of a range of essential services in response to the COVID-19 pandemic.
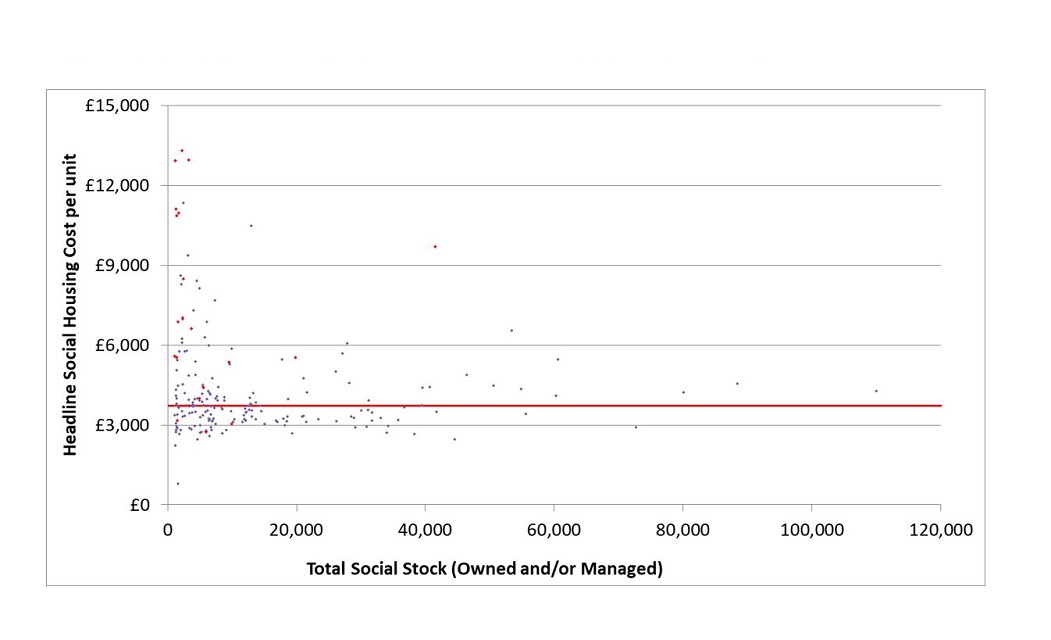
5.22 To illustrate the extent of the variation around the median for each value for money metric, figure 1 shows the overall spread of costs across different size of providers. The mean [footnote 10] headline social housing cost per unit is £4,150. This compares to the median average cost per unit which is £3,730 and is denoted by the red line. The difference between the median and the mean is driven by measurable factors such as location and specialism which are discussed in more detail in section 6.
5.23 The regulator’s regression analysis in the past has shown that not all this variation can be explained by measurable factors, and much of the variation will stem from the business decisions taken by providers themselves.
Figure 1: HSHC per unit by total social stock owned and/or managed
5.24 The latest financial forecasts, show that the Headline Social Housing Cost is forecast to rise by £430 per unit over the next year. This increase is dominated by forecast rises to maintenance and major repairs of £360 per unit – this accounts for 85% of the total increase in expenditure between 2021 and 2022 as the sector responds to the backlog of repairs and maintenance, building safety works and meeting energy efficiency costs.
5.25 Between 2022 and 2026 costs are forecast to rise by 5.0%, which is significantly below the central inflation forecasts of 8.6%, maintenance and major repairs are again expected to be the key underlying factors driving increased expenditure.
Figure 2: HSHC Actual FVA data (2015-2021) and HSHC FFR Forecasts 2019-2021 versus 2015 HSHC inflated by CPI

5.26 Figure 2 shows how the Headline social housing cost has performed over time relative to registered providers’ 2015 costs [footnote 13], (inflated by central CPI forecasts) – the last full financial year prior to the announcement of the minus 1% rent reductions. While the outlook beyond 2021 remains uncertain, it shows that if planned increases in costs continue, 2022 will be the first year in which costs rise above their 2015 levels, in real terms, before dipping in 2023/24.
5.27 Figure 3 shows the impact of inflationary rent increases since 2020 and the impact on the operating margin (SHL). The increase is primarily driven by SHL turnover which rose from £15.7bn to £16.1bn in 2021.
Figure 3: Impact of the rent reduction on operating margin – social housing lettings (2016-2021)
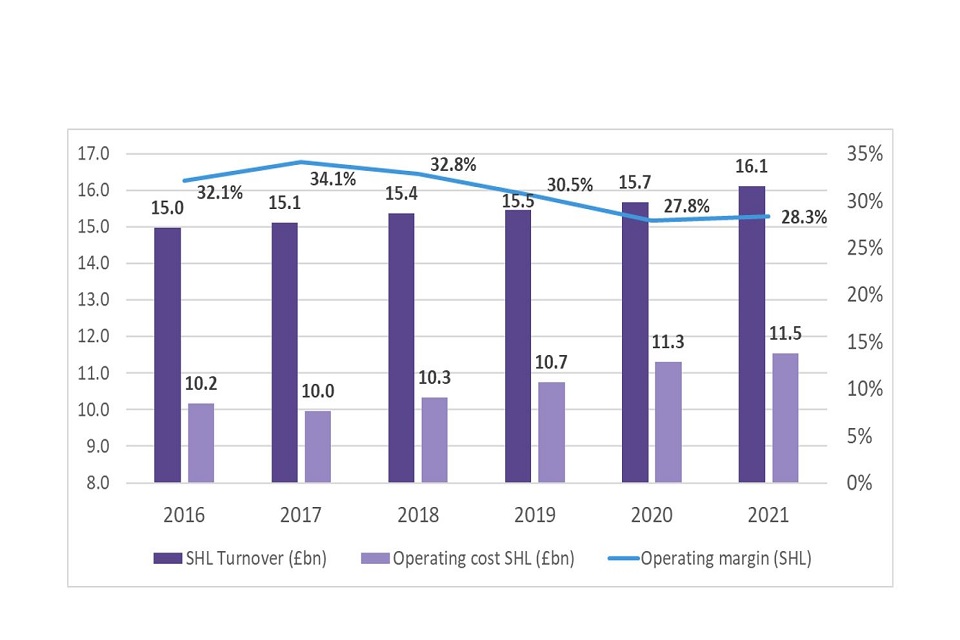
5.28 In 2021, the weighted average operating margin (overall), is six percentage points lower than the operating margin from social housing lettings. This demonstrates that the margins across most non-social housing activities are lower compared to providers’ core business. This includes for example, nursing homes and student accommodation which were both negatively impacted as a result of the COVID-19 pandemic. In aggregate nursing homes generated a net loss of £11.3m (2020: £3.4m net surplus), while the surplus generated by student accommodation fell by almost half compared to previous years.
5.29 The ROCE metric assesses the efficiency of investment of capital resources and compares the operating surplus to total asset values. The weighted average ROCE fell by 2.6% compared to previous years. This can be explained by a 0.1% increase in operating surplus (inclusive of joint ventures) being more than offset by a 2.7% increase total asset values less liabilities.
6. Sub-sector analysis
| Quartile data | No of RPs | % of sector (social units owned) | Re-investment | New supply (Social) | New supply (Non-social) | Gearing | EBITDA MRI interest cover | Headline social housing cost per unit (£K) | Operating margin (Social) | Operating margin (Overall) | Return on capital employed | |
|---|---|---|---|---|---|---|---|---|---|---|---|---|
| All returns | Upper quartile | 208 | 100.00% | 8.20% | 2.00% | 0.10% | 53.30% | 248.00% | £4.76 | 32.60% | 28.20% | 4.20% |
| Median | 5.80% | 1.30% | 0.00% | 43.90% | 182.50% | £3.73 | 26.30% | 23.90% | 3.30% | |||
| Lower quartile | 4.00% | 0.50% | 0.00% | 32.90% | 134.20% | £3.21 | 22.20% | 18.10% | 2.70% | |||
| Provider sub-set | ||||||||||||
| Size | > 30,000 | 27 | 47.30% | 5.10% | 1.50% | 0.14% | 46.00% | 171% | £3.68 | 31.60% | 24.30% | 3.50% |
| (Social units owned) | 20,000 - 29,999 | 15 | 14.00% | 5.20% | 1.30% | 0.08% | 45.80% | 149% | £3.54 | 24.90% | 22.00% | 2.60% |
| 10,000 - 19,999 | 35 | 18.20% | 7.10% | 1.10% | 0.00% | 48.80% | 180% | £3.37 | 26.00% | 24.00% | 3.80% | |
| 5,000 - 9,999 | 54 | 13.50% | 5.90% | 1.40% | 0.00% | 47.10% | 185% | £3.65 | 27.00% | 24.50% | 3.50% | |
| 2,500 - 4,999 | 31 [footnote 14] | 4.30% | 5.00% | 1.20% | 0.00% | 41.80% | 200% | £3.94 | 24.40% | 24.20% | 3.50% | |
| < 2,500 | 46 | 2.70% | 4.60% | 0.80% | 0.00% | 33.70% | 205% | £4.79 | 25.10% | 22.10% | 2.90% | |
| Cost factor | LSVT < 12yrs.[footnote 15] | 9 | 3.10% | 13.20% | 0.70% | 0.00% | 28.10% | 166% | £3.98 | 25.60% | 20.60% | 3.70% |
| London [footnote 16] | 26 | 11.10% | 4.40% | 0.70% | 0.00% | 40.50% | 118% | £6.20 | 23.70% | 19.40% | 2.10% | |
| SH provider [footnote 17] | 16 | 1.50% | 4.10% | 1.50% | 0.00% | 11.60% | 309% | £9.68 | 13.40% | 7.40% | 3.30% | |
| HOP provider [footnote 18] | 7 | 3.10% | 5.90% | 1.10% | 0.00% | 34.80% | 133% | £5.55 | 18.10% | 16.70% | 3.20% |
6.1 The sub-sector analysis provides more detailed insight into the difference between types of registered providers. At a sub-sector level, the composition of different groups can have an impact on results. During 2021, the number of providers in the cohort, 2,500-4,999 [footnote 19] fell which means comparisons to previous year’s performance is more challenging.
6.2 There is a notable difference in performance on the VFM metrics across the range of size bands and cost factors. The influence of size on reported performance is complex; some size bands show material divergence from sector averages – some of which can be explained by the differing prevalence of providers with particular characteristics, as shown in table 4. The key variances are explained in the commentary that follows in this section.
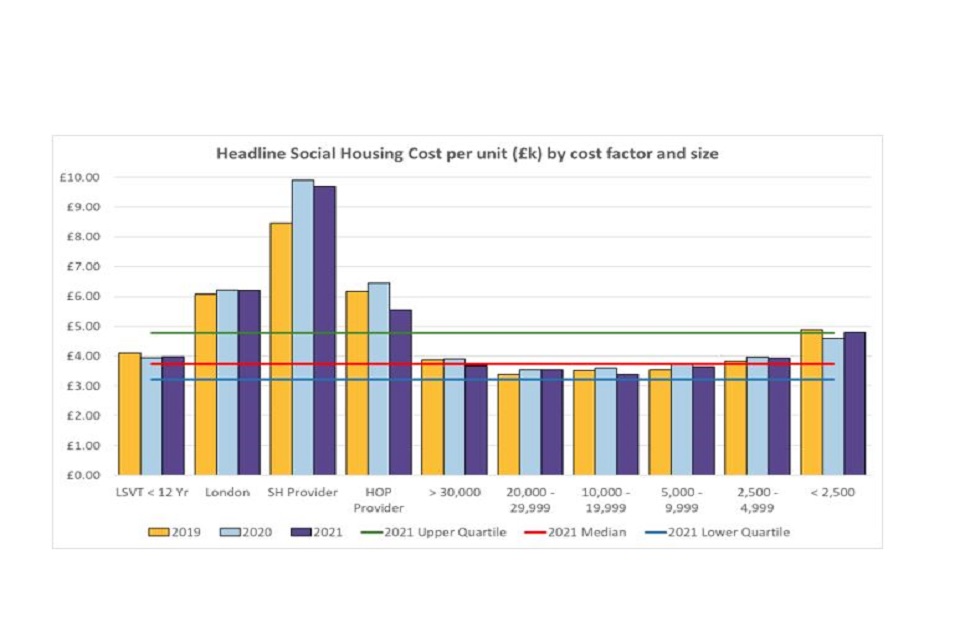
6.3 Figures, 3, 4 and 5 below illustrate the range of performance for these different groups for three of the key VFM performance measures: reinvestment, new supply (social) and headline social housing cost per unit.
Figure 4: Reinvestment (medians) by cost factor and size
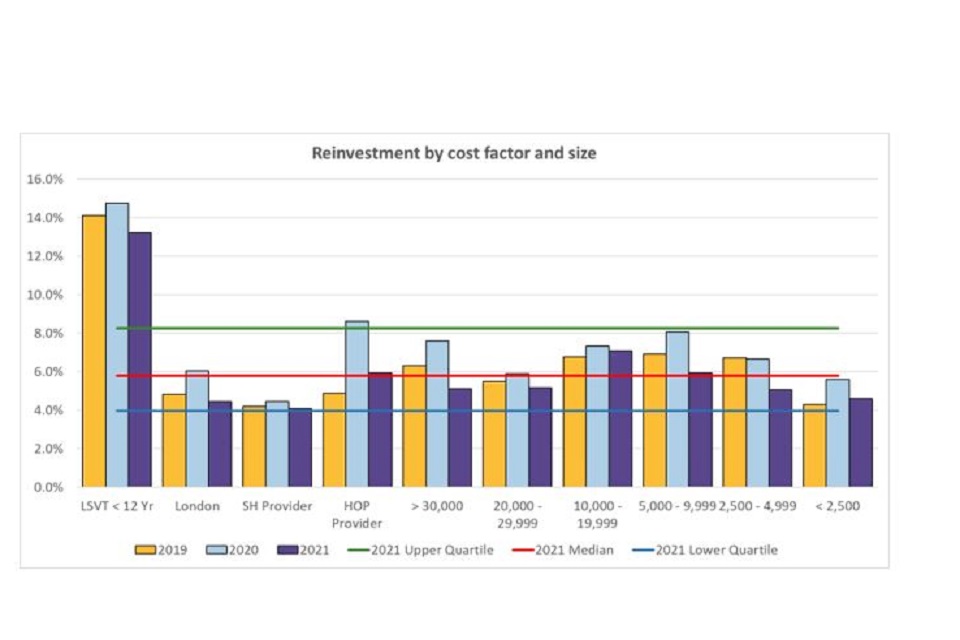
Figure 5: New supply (social) medians by cost factor and size
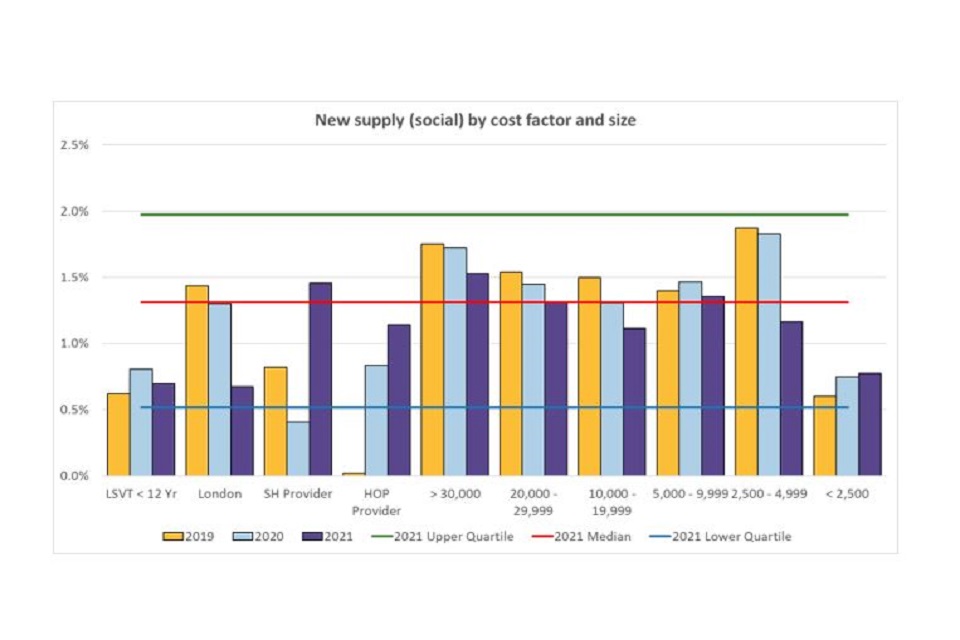
Figure 6: Headline social housing cost per unit medians by cost factor and size
Cost factor
Supported housing and housing for older people
6.4 Most registered providers own and or manage some supported housing or housing for older people units. But there are a minority of providers where this activity forms a material part of their business. Supported housing and housing for older people providers [footnote 23] account for 11% of all registered providers (4.6% of social stock owned in the sector), with more than 1,000 units.
6.5 Lease-based providers account for almost 20% of the total number of providers in the supported housing sub-group. These providers have a distinctive business model in that they own little or no housing stock and have low levels of debt. The lower-than-average asset values (the denominator of the reinvestment metric), mean that lease-based providers often have very high reinvestment measures and the low debt levels lead to high EBITDA MRI Interest rate and ROCE metrics.
6.6 Supported housing and housing for older people providers are associated with having higher costs [footnote 24] and lower margins. This is likely to be associated with the broad range of activities undertaken and the level of service supplied by organisations with a specialist focus. These higher costs and lower margins tend to mean these providers are less able to support debt to finance investment activity.
6.7 Reductions in headline social housing cost per unit have been recorded for both supported housing and housing for older people providers. The median headline social housing cost for supported housing providers fell from £9,900 per unit in 2020 to £9,680 in 2021, [footnote 25] while across the housing for older people sub-group, headline costs fell sharply from £6,440 per unit to £5,500 over the same period. A significant part of the reduction in costs is driven by two providers due to a deferral of major repair expenditure and planned maintenance work.
6.8 Unusually, there has been a significant increase in new supply (social) across supported housing providers which generally reflects the volatility of provider’s development programmes. The median new supply (social) increased from 0.4% in 2020 to 1.5% in 2021 – the increase was driven by five providers across a number of regions who delivered a weighted average new supply (social) figure of 2.1% in 2021, this compares to zero supply (social) units delivered in the previous year.
6.9 The operating margin (social) was also significantly higher across supported housing providers compared to previous years. The median operating margin increased from 10.4% to 13.4% due to turnover rising by 2.9%, driven by the return on inflationary rent increases while operating expenditure remained relatively stable.
Large scale voluntary transfers less than 12 years old
6.11 Over the past three years the composition of the LSVT sub-group has significantly changed. Since 2019, eight providers have matured past 12 years since transfer (beyond which point LSVTs tend to have similar characteristics with traditional providers). This sub-group now accounts for only 3.1% of the sectors social housing stock owned compared to 7.3% in 2019.
6.12 Overall, performance of this sub-group remains broadly in line with previous years allowing for some small movements as a result of the COVID-19 pandemic. This group of providers have commitments in place which means that they have higher reinvestment (13.2%), compared to the sector average of 5.8%. The higher than average headline social housing unit costs of £3,980 compared to the sector average of £3,730 is also a key feature of this group, as they fulfil post-transfer agreements - this includes rent settlement agreements, re-investment into transferred stock and regeneration within the local community. On average LSVT major repair costs (including capitalised costs), are £150 per unit higher compared to the weighted sector average.
6.13 Accordingly, this sub-group of providers is also characterised by lower than average operating margins (social), of 20.6%, compared to the sector median of 26%, due to lower levels of rental income and higher repairs and maintenance costs. Higher levels of investment into existing stock means that development of additional homes is limited or precludes them from investing in new supply altogether. The lower operating margins can be further explained due to regional differences - around 78% of LSVT providers less than 12 years old are based in the North East or North West of England.
Size of providers
6.14 It is important to note that the range of performance across each size band is influenced by the composition of each group. This can change on an annual basis due to movements in housing stock. Regression analysis undertaken by the regulator in recent years has shown that there is no direct linear relationship between size and performance on the VFM metrics after controlling for other factors. Each size band in table 4 contains a range of different providers who have distinctive characteristics, particularly the very largest providers (those with more than 30,000 properties), and the very smallest (those with fewer than 2,500 units). However, much of the difference can be explained by other factors rather than size, this includes the amount of stock owned in London, and the prevalence of supported housing [footnote 27].
6.15 Over the past three years, the percentage of stock owned by providers with over 30,000 units, increased from 36% in 2018 to 47% in 2020.The number of providers within this group has remained relatively stable over the past year due to a limited number of small mergers undertaken compared to previous years.
6.16 The median headline social housing cost across the largest providers fell from £3,900 to £3,680 per unit, compared to previous years. This was driven by a 2.1% reduction in expenditure related to maintenance and major repairs. The median reinvestment output across this group also fell from 7.6% in 2020 to 5.1% in 2021. Almost 90% of providers within the group reported a fall in the reinvestment metric over the past two years. Analysis shows that this is associated with reduced levels of capital expenditure rather than an increase in property prices – the denominator of the reinvestment metric.
6.17 The largest providers delivered 45% of total new social housing units and continue to account for the majority of market facing activity. This group of providers also developed 64% of the total number of non-social units in the sector, this compares to 60% in the previous year. Of the 4,156 non-social units developed by the largest providers, 89% were built by ten providers that are London based or by those providers with a regional presence [footnote 28]. Just over a third of these units were delivered by three London providers, despite owning just under 16% of the total units within the cohort.
6.18 The very notable range of performance by providers with between 20,000 and 29,999 units is driven by geographical factors and a small change to the composition of the group [footnote 28]. Around one third of providers in this cohort are concentrated in the North East and North West. In these regions operating margins tend to be squeezed due to lower rental income but have costs that are relatively similar to some other regions in England.
6.19 Due to lower operating surpluses and lower asset values, the median EBITDA MRI interest cover for this sub-group of providers was 149% compared to the sector median of 183%.
6.20 Meanwhile ROCE, which is a measure of an organisation’s efficiency, also recorded a sharp decline - it fell to a median of 2.6% compared to 3.1% in the previous year. The lower than average performance of both interest cover and ROCE have been affected by lower operating surpluses reported by four providers in the cohort.
6.21 The sharpest decline in Headline social housing cost per unit was reported by providers with between 10,000 to 19,999 units. Performance for the year shows that the median fell to £3,370, this compared to previous year’s performance of £3,600. The year-on-year variance is associated with lower capitalised major repairs and planned maintenance expenditure which was driven by three providers.
6.22 Registered providers with between 5,000 and 9,999 units reported the largest fall in reinvestment which fell from 8.1% in 2020 to 5.9% in 2021. In contrast to previous years, 73% of providers in the cohort, have delivered lower levels of investment in to new and existing properties. Overall, total reinvestment fell by almost 20% from £1.43bn to £1.15bn compared to previous years.
6.23 The other size category with distinctive average metrics is the sub-group of providers with fewer than 2,500 units. The reported performance of this group is significantly affected by providers with a high proportion of supported housing and housing for older people stock. It is not surprising that providers in this cohort continue to have higher costs of £4,790 compared to the sector median of £3,730 per unit and lower overall operating margins of 22.1% compared to the sector median of 23.9%.
7. Regional analysis
7.1 This section complements the sub-sector analysis of the report and analyses the geographical patterns of performance by registered providers by region across England [footnote 29]. This section is also designed to help boards to understand how their organisation’s performance compares to other providers in their region of operation. Commentary on the metrics in this section has been limited to a core number of VFM metrics only.
7.2 An important aspect of regional performance is understanding the relative importance of the underlying factors that affect each region. For example, in London and the South East, labour costs are higher compared to the rest of the country, leading to higher headline costs. Higher property valuations in London will lead to lower reinvestment, gearing and ROCE measures, as the higher property values result in higher denominators across each of the three metrics. Furthermore, social sector rents are closer to private sector rents in the North East and North West which would intuitively indicate lower levels of demand [footnote 30].
7.3 The contextual reasons set out above mean that care should be taken when interpreting the data provided in this section. To better support understanding of this section readers should also refer to the variation of cost performance in the Value for Money Technical Regression Report 2018.
7.4 Each registered provider is assigned to a region based on where the majority of its social housing stock is owned. For the purposes of this report that is 50% of stock in a single region. Providers who have less than 50% of stock in any one region are defined as mixed providers. The regional characteristics data can be found in Annex B.
Table 5: Summary of metrics by region
| Medians | No of providers | % of sector (social units owned) | Re-investment | New supply (social) | New supply (non-social) | Gearing | EBITDA MRI interest rate cover | Headline social housing CPU (£K) | Operating margin (social) | Operating margin | Return on capital employed | |
|---|---|---|---|---|---|---|---|---|---|---|---|---|
| Regions | ||||||||||||
| East Midlands | 8 | 2.70% | 8.70% | 2.20% | 0.00% | 51.50% | 193% | £3.34 | 26.90% | 24.50% | 3.60% | |
| East of England | 21 | 6.20% | 6.70% | 1.80% | 0.00% | 53.50% | 177% | £3.52 | 33.00% | 29.50% | 3.60% | |
| London | 26 | 11.10% | 4.40% | 0.70% | 0.00% | 40.50% | 118% | £6.20 | 23.70% | 19.40% | 2.10% | |
| Mixed | 27 | 27.80% | 4.60% | 1.30% | 0.01% | 44.80% | 143% | £4.44 | 24.90% | 21.30% | 3.30% | |
| North East | 11 | 5.60% | 5.70% | 0.90% | 0.00% | 45.00% | 213% | £3.16 | 26.00% | 26.10% | 3.50% | |
| North West | 36 | 16.50% | 6.80% | 0.80% | 0.00% | 41.20% | 223% | £3.54 | 25.40% | 23.00% | 3.70% | |
| South East | 21 | 10.00% | 4.90% | 1.50% | 0.01% | 51.00% | 196% | £3.93 | 34.40% | 29.60% | 3.50% | |
| South West | 20 | 6.10% | 5.60% | 1.90% | 0.00% | 38.20% | 214% | £3.71 | 28.30% | 24.70% | 3.50% | |
| West Midlands | 22 | 8.40% | 5.70% | 1.30% | 0.00% | 47.50% | 197% | £3.40 | 27.20% | 25.00% | 3.90% | |
| Yorkshire & the Humber | 16 | 5.70% | 5.40% | 1.00% | 0.00% | 41.60% | 205% | £3.30 | 22.90% | 23.00% | 3.10% | |
| England | 208 | 100.00% | 5.77% | 1.30% | 0.00% | 43.90% | 183% | £3.73 | 26.30% | 23.90% | 3.30% |
Table 6: Summary of sector trends (2019-2021) by region
| Medians | Sector | East Midlands | East of England | London | Mixed | North East | North West | South East | South West | West Midlands | Yorkshire & the Humber | |
|---|---|---|---|---|---|---|---|---|---|---|---|---|
| Reinvestment | 2021 | 5.80% | 8.70% | 6.70% | 4.40% | 4.60% | 5.70% | 6.80% | 4.90% | 5.60% | 5.70% | 5.40% |
| 2020 | 7.20% | 8.30% | 8.20% | 6.00% | 6.50% | 7.90% | 7.30% | 7.60% | 8.70% | 5.40% | 6.90% | |
| 2019 | 6.20% | 7.20% | 8.20% | 4.80% | 4.60% | 5.80% | 6.00% | 6.50% | 6.80% | 6.00% | 7.10% | |
| New supply (social) | 2021 | 1.30% | 2.20% | 1.80% | 0.70% | 1.30% | 0.90% | 0.80% | 1.50% | 1.90% | 1.30% | 1.00% |
| 2020 | 1.50% | 2.20% | 2.40% | 1.30% | 1.50% | 1.20% | 0.80% | 2.40% | 1.70% | 1.60% | 1.70% | |
| 2019 | 1.50% | 2.30% | 2.50% | 1.40% | 1.50% | 0.60% | 0.70% | 2.20% | 1.90% | 1.90% | 1.40% | |
| Headline social housing CPU (£K) | 2021 | £3.73 | £3.34 | £3.52 | £6.20 | £4.44 | £3.16 | £3.54 | £3.93 | £3.71 | £3.40 | £3.30 |
| 2020 | £3.83 | £3.44 | £3.56 | £6.20 | £4.52 | £3.40 | £3.65 | £3.84 | £3.64 | £3.49 | £3.48 | |
| 2019 | £3.69 | £3.16 | £3.41 | £6.07 | £4.53 | £3.37 | £3.50 | £3.61 | £3.44 | £3.40 | £3.53 | |
| Return on capital employed | 2021 | 3.30% | 3.60% | 3.60% | 2.10% | 3.30% | 3.50% | 3.70% | 3.50% | 3.50% | 3.90% | 3.10% |
| 2020 | 3.40% | 4.10% | 3.80% | 2.40% | 3.10% | 3.90% | 3.60% | 3.30% | 3.40% | 4.30% | 3.10% | |
| 2019 | 3.80% | 4.10% | 4.00% | 2.80% | 3.50% | 3.60% | 4.40% | 3.80% | 3.90% | 4.70% | 3.00% | |
7.5 There is a wide range of performance across each region in England, but the pattern of performance has remained relatively consistent over the past three years. Where there is unusual year on year movements across a particular region these are explained in more detail below.
Reinvestment
Table 7: Reinvestment by region of operation
| Reinvestment | |||||||||
|---|---|---|---|---|---|---|---|---|---|
| Regions | Median | Weighted average | Existing stock (weighted average) | Develop. & other (weighted average) | Per unit (£k) | Existing stock (per unit) (£k) | Develop. & other (per unit) (£k) | Avg. property value (£k) | |
| East Midlands | 8.70% | 8.00% | 1.00% | 7.00% | £3.86 | £0.47 | £3.40 | £48.44 | |
| East of England | 6.70% | 6.90% | 0.90% | 6.00% | £4.29 | £0.56 | £3.73 | £62.26 | |
| London | 4.40% | 4.80% | 0.70% | 4.20% | £5.65 | £0.76 | £4.89 | £116.72 | |
| Mixed | 4.60% | 5.50% | 1.00% | 4.50% | £3.69 | £0.67 | £3.02 | £67.22 | |
| North East | 5.70% | 6.30% | 1.80% | 4.50% | £1.90 | £0.54 | £1.36 | £30.34 | |
| North West | 6.80% | 6.80% | 1.40% | 5.30% | £2.21 | £0.47 | £1.74 | £32.72 | |
| South East | 4.90% | 5.20% | 0.70% | 4.50% | £4.02 | £0.54 | £3.48 | £76.69 | |
| South West | 5.60% | 6.20% | 0.80% | 5.40% | £3.25 | £0.41 | £2.83 | £52.18 | |
| West Midlands | 5.70% | 6.80% | 0.90% | 5.90% | £3.12 | £0.40 | £2.72 | £46.12 | |
| Yorkshire & the Humber | 5.40% | 5.70% | 1.40% | 4.30% | £1.92 | £0.48 | £1.44 | £33.83 | |
| England | 5.80% | 5.70% | 0.90% | 4.80% | £3.46 | £0.57 | £2.90 | £60.52 |
7.6 Property values are a key driver of the reinvestment metric which takes into account investment of existing stock and acquisition, or development of new stock, and is affected by geographical location. The average property value [footnote 31] in London is £116,720 and is almost four times higher compared to the North East where an average property is £30,340. This means that providers based in London must invest over three times more in absolute terms to achieve the same reinvestment metric result as providers in the North of the country.
7.7 Reinvestment into existing stock is broadly consistent across each region in England. The average expenditure across England is £570 per unit. The lowest investment into existing stock is in the West Midlands and South West of the country where investment averages are £400 and £410 per unit respectively. The weighted average reinvestment in existing stock as a percentage of the total asset value in these regions however is in line with the sector average due to lower than average property values.
7.8 Registered providers based in London have a lower reinvestment median of 4.4% compared to the sector average of 5.8%. This is driven by higher property values rather than providers in this region investing less into existing stock or new supply. Overall, London based providers invest 63% more in absolute terms into existing social housing stock and new supply compared to the sector average on a per unit basis.
7.9 On the other hand, the weighted average investment into existing stock in the North East, North West and Yorkshire is higher compared to other regions. This is due to lower property values in these regions. In the North East and North West regions there also a higher proportion of young LSVT’s compared to the rest of the country, who have committed capital programmes post transfer. The higher than average reinvestment in the East Midlands, is driven by two providers in the region who significantly invested in new housing stock compared to previous years.
New supply
7.10 The wide range of performance relating to new social homes delivered across different regions is affected by demand in certain regions in England. The range of performance this year also reflects the COVID-19 restrictions that were imposed throughout the year. The regional performance of new supply output is shown in Table 8. This demonstrates that the number of new social units delivered in England fell by 19% compared to previous years. During the first lockdown construction projects were delayed, or altogether cancelled while at other stages throughout the year different regions in England were imposed with tighter restrictions compared to their counterparts.
Table 8: New supply – Social by region of operation
| Region of operation | New supply (social) units | Total social units owned | New supply (Social) – median | New supply (Social) – weighted average |
|---|---|---|---|---|
| East Midlands | 1,574 | 75,418 | 2.20% | 2.10% |
| East of England | 3,238 | 176,177 | 1.80% | 1.80% |
| London | 4,915 | 331,113 | 0.70% | 1.50% |
| Mixed | 12,090 | 794,028 | 1.30% | 1.50% |
| North East | 1,341 | 154,872 | 0.90% | 0.90% |
| North West | 4,437 | 463,633 | 0.80% | 1.00% |
| South East | 4,626 | 289,794 | 1.50% | 1.60% |
| South West | 2,998 | 171,229 | 1.90% | 1.80% |
| West Midlands | 3,583 | 233,311 | 1.30% | 1.50% |
| Yorkshire and the Humber | 1,735 | 160,443 | 1.00% | 1.10% |
| England | 40,537 | 2,850,018 | 1.30% | 1.40% |
7.11 As previously highlighted in earlier sections of this report, the North East and North West regions of England deliver lower levels of new supply (social). This can be partly explained by the high proportion of LSVT organisations that are less than twelve years old based in these regions. The median level of new supply as a proportion of existing stock is 0.9% in the North East and 0.8% in the North West of the country - this compares to the sector median of 1.3%. The low level of new supply (social), in the North West is driven by a core group of providers (LSVTs and housing for older people providers), who did not deliver additional social units in 2021.
7.12 In the East Midlands region, the higher than average outturn of new supply (social), delivered was 2.2% of total stock owned, compared to the national weighted average of 1.4% - this was driven by one provider.
7.13 In the South West, providers delivered new social homes equivalent to 1.9% of their existing stock in 2021, compared to 1.7% the previous year. The increase in performance was primarily driven by one supported housing provider who increased their new supply by 5.4% in the year.
7.14 In the London region, there continues to be a large gap between the new supply (social) median of 0.7% and weighted average, 1.5%. The difference can be explained by a higher than average proportion of small providers who make up almost one quarter of the group. The cohort also has higher than average supported housing or housing for older people stock, which tends to drag down the median figure
Table 9: Non-social housing supply by region of operation
| Region of operation | New supply (non-social) units | Total units owned | New supply (non-social) - median | New supply (non-social) - weighted average |
|---|---|---|---|---|
| East Midlands | 70 | 77,230 | 0.00% | 0.09% |
| East of England | 182 | 182,821 | 0.00% | 0.10% |
| London | 1,910 | 358,400 | 0.00% | 0.53% |
| Mixed | 2,372 | 855,305 | 0.01% | 0.28% |
| North East | 200 | 155,831 | 0.00% | 0.13% |
| North West | 320 | 476,030 | 0.00% | 0.07% |
| South East | 958 | 301,351 | 0.01% | 0.32% |
| South West | 213 | 175,487 | 0.00% | 0.12% |
| West Midlands | 89 | 239,434 | 0.00% | 0.04% |
| Yorkshire and the Humber | 163 | 162,827 | 0.00% | 0.10% |
7.15 The new supply non-social metric excludes new units developed through joint ventures. Similar to new supply (social), there are large regional variations across England. Table 9 shows that providers in London [footnote 32] deliver a weighted average non-social supply which is 13 times higher compared to providers in the West Midlands. The difference can be explained by factors including higher demand for non-social products in London and higher costs of developing new social units. This means that providers operating in London must derive more profit from non-social activities to cross subsidise social development.
Headline social housing unit costs
7.16 Registered providers with the highest headline social housing costs tend to be based in London where the median cost per unit is £6,200 per unit. This is 1.7 times higher than the England median of £3,730. The largest differences in expenditure between London and England relate to service charge costs, development services, and charges for support services – these higher costs reflect the high proportion of specialist care providers in the London region. Providers in the mixed region sub-group also have higher costs compared to the England average which is primarily due to their stock profile - around 15% of mixed provider’s housing stock is in London.
7.17 The median headline costs in the South East and South West regions rose by £90 and £70 per unit respectively. In the South East, the increase in expenditure related to major repairs and development services [footnote 33].
Table 10: Headline social housing cost by region of operation
| Region of operation | Headline Social Housing Cost - median (£K) | Headline Social Housing Cost - weighted average (£K) |
|---|---|---|
| East Midlands | £3.34 | £3.91 |
| East of England | £3.52 | £3.79 |
| London | £6.20 | £6.10 |
| Mixed | £4.44 | £4.54 |
| North East | £3.16 | £3.18 |
| North West | £3.54 | £3.60 |
| South East | £3.93 | £4.01 |
| South West | £3.71 | £3.54 |
| West Midlands | £3.40 | £3.40 |
| Yorkshire & the Humber | £3.30 | £3.45 |
| England | £3.73 | £4.15 |
7.18 In the North East, North West and Yorkshire and the Humber regions, the median Headline Social Housing unit costs fell by £240, £110, and £180 per unit respectively. The sharp fall in expenditure is associated with reduced levels capitalised major repairs, and community and development services.
7.19 Overall, the weighted average Headline Social Housing Cost for England is £4,150 which is £420 per unit higher compared to the England median. The higher weighted average is driven by specialist providers who have significantly higher costs compared to the sector median.
Return on capital employed
7.20 The ROCE metric measures the efficient investment in capital resources and is underpinned by movements in the operating surplus, it includes the profit from joint ventures and total property values. The range in the ROCE performance across England fell from 1.9 to 1.8 percentage points (excluding the London region ROCE fell by 0.8 percentage points), compared to previous years. In London, the ROCE is affected by higher returns generated from joint venture activity as well as higher asset values. The West Midlands region continues to have the highest median ROCE at 3.9%. The large difference when measured against the sector average is driven by lower than average returns generated from joint ventures (the West Midlands average is 1% of the England average), and lower than average property values
7.21 Excluding London, Yorkshire and the Humber has the lowest median ROCE of 3.1%. The largest difference between Yorkshire and the Humber and England relates to lower than average operating surplus. The largest regional fall in ROCE compared to previous years was in the East Midlands where the median fell from 4.1% to 3.6%. This was due to lower operating surpluses compared to previous years, combined with an increase in property values. There are relatively few providers in the East Midlands which means the median is sensitive to changes across a small number of providers.
Annex A: Summary of Value for Money metrics and methodology
7.22 This publication, along with the VFM metrics dataset, provides registered providers with a useful comparative baseline for annual reporting and monitoring of trends. The dataset includes the metrics for all registered providers with more than 1,000 properties and with a financial year end of 31st March 2021 or 31st December 2020. The metrics are provided at both a group and an entity level, however only group level data was used in the analysis. For consistency, the metrics for individual registered providers have been calculated on the basis set out in the regulator’s metrics technical note, using the FVA electronic accounts data submitted by registered providers.
7.23 The analysis for 2021 is based on 208 registered providers compared to 210 in 2020 and 217 in 2019, this represents more than 95% of the sector’s stock. One not-for-profit registered provider has been excluded from the analysis due to data quality issues. There are a further five registered providers who do not have a financial year ending 31st March or 31st December. This group of providers have been excluded from our analysis also.
7.24 The vast majority of the VFM metrics are set at a group level and take account of registered providers’ core activities, which for most registered providers include the provision of social housing lettings. The metrics also take account of non-social housing activities in unregistered subsidiaries and joint ventures [footnote 34] which provide a comprehensive assessment of registered providers performance. The exception to this is the delivery of new non-social housing through joint ventures, which is excluded for consistency reasons.
7.25 We encourage registered providers to use the regulator’s published metrics to benchmark and challenge performance against relevant peer groups, both at a sector and sub sector level. The latest VFM metrics dataset is available on the website with this report.
7.26 Quoted quartile ranges apply to performance on individual metrics, so a provider may be in the upper quartile for one metric and the lower quartile for another. ### Table 11: The Value for Money metrics
| Metric | Subdivision – consolidated or social housing | Metric description | |
|---|---|---|---|
| 1 | Reinvestment % (in existing homes and new homes) | Consolidated | Scale of investment into existing housing and acquisition or development of new housing in relation to the size of the asset base |
| 2 | New supply delivered % | Consolidated and social housing | Units acquired or developed in year as a proportion of existing stock [footnote 34] |
| 3 | Gearing % | Consolidated | Proportion of borrowing in relation to size of the asset base |
| 4 | Earnings Before Interest, Tax, Depreciation, Amortisation, Major Repairs, Included Interest cover % | Consolidated | Key indicator for liquidity and investment capacity |
| 5 | Headline social housing cost per unit | Social housing only | Social housing costs per unit |
| 6 | Operating margin % | Consolidated and social housing | Operating surplus (deficit) divided by turnover (demonstrates the profitability of operating assets) |
| 7 | Return on capital employed % | Consolidated | Surplus/(deficit) plus disposal of fixed assets plus profit /(loss) of joint ventures compared to total assets |
Table 12: Headline Social Housing Cost regression cost breakdown (2017 prices)
Table 12 highlights the additional headline social housing cost per unit associated with owning or managing a property that meets one of the measurable cost factors. For example, the average supported housing property is associated with costs of £6,700 per unit above a General Needs property. The results are derived from the 2018 regression analysis undertaken by the Regulator of Social Housing with the costs quoted being in 2017 prices. The figures should help to provide useful context for the analysis of headline social housing cost per unit included within the Sub-sector analysis section.
notes:
Baseline [footnote 36]
Median [footnote 37]
| Cost factor | Associated headline social housing cost per unit £ |
|---|---|
| Baseline | £3,300 |
| Supported housing unit | +£6,700 |
| Housing for older people unit | +£1,400 |
| ASHE wage – London vs England average | +£1,900 |
| LSVT <7 years | +£1,100 |
| LSVT 7-12 Years | +£100 |
| Indices of Multiple Deprivation – Most deprived 1% of areas vs median | +£350 |
Annex B: Regional characteristics
Table 13 outlines the number of providers in each region and also includes information on contextual factors that can help to explain some of the differential regional performances seen in the Regional analysis section.
Table 13: Providers by region
| Regions | No of providers | % of sector (social units owned) | SH provider | HOP provider | >30,000 units | 20,000 - 29,999 | 10,000 - 19,999 | 5,000 - 9,999 | 2,500 - 4,999 | < 2,500 | LSVT < 12 years |
|---|---|---|---|---|---|---|---|---|---|---|---|
| East Midlands | 8 | 2.70% | 1 | 1 | 0 | 1 | 1 | 4 | 0 | 2 | 0 |
| East of England | 21 | 6.20% | 0 | 0 | 1 | 0 | 4 | 9 | 5 | 2 | 0 |
| London | 26 | 11.10% | 3 | 1 | 3 | 0 | 2 | 6 | 4 | 11 | 0 |
| Mixed | 27 | 27.80% | 6 | 4 | 12 | 2 | 2 | 1 | 4 | 6 | 0 |
| North East | 11 | 5.60% | 1 | 0 | 1 | 2 | 3 | 1 | 1 | 3 | 2 |
| North West | 36 | 16.50% | 1 | 0 | 3 | 3 | 11 | 13 | 3 | 3 | 5 |
| South East | 21 | 10.00% | 0 | 1 | 1 | 4 | 2 | 10 | 1 | 3 | 1 |
| South West | 20 | 6.10% | 2 | 0 | 2 | 0 | 3 | 4 | 6 | 5 | 1 |
| West Midlands | 22 | 8.40% | 2 | 0 | 2 | 2 | 4 | 4 | 5 | 5 | 0 |
| Yorkshire & the Humber | 16 | 5.70% | 0 | 0 | 2 | 1 | 3 | 2 | 2 | 6 | 0 |
| England | 208 | 100.00% | 16 | 7 | 27 | 15 | 35 | 54 | 31 | 46 | 9 |
Annex C: Cost factor and size cohort sizes (2019-2021)
Table 14 outlines the number of providers included in each cost factor and size cohort in each of the years 2019 to 2021 which provides some context as to how the cohorts have changed over time. Most notably the number of LSVTs within the first 12 years after transfer has almost halved, from 17 to 9.
Table 14: Number of providers included in each cost factor or size cohort (2019-2021)
| No. of providers | ||||
|---|---|---|---|---|
| 2021 | 2020 | 2019 | ||
| Cost factor | LSVT < 12 Yr | 9 | 12 | 17 |
| London | 26 | 27 | 28 | |
| SH Provider | 16 | 16 | 17 | |
| HOP Provider | 7 | 7 | 7 | |
| Size (Social units owned) | > 30,000 | 27 | 27 | 25 |
| 20,000 - 29,999 | 15 | 14 | 14 | |
| 10,000 - 19,999 | 35 | 34 | 37 | |
| 5,000 - 9,999 | 54 | 53 | 55 | |
| 2,500 - 4,999 | 31 | 37 | 38 | |
| < 2,500 | 46 | 45 | 48 |
-
Expensed routine and planned maintenance and major repairs ↩
-
Financial forecast returns set out the financial elements of providers business plan covering the next 30 years, including projections and key financial assumptions. ↩
-
The Housing and Regeneration Act 2008 ss.68-70 and the annual Statistical Data Return guidance provide definitions of social housing and “owned” and “managed” in this context ↩
-
Upper quartiles, medians and lower quartile figures represent the range for each individual metric. There is not a single cohort of ‘upper quartile’ or ‘lower quartile’ providers across the full range of metrics. ↩
-
New supply (social) is a measure of the number of new social units developed or acquired in the year divided by the total number of social units (including leasehold) owned. ↩
-
Includes works to existing (total housing properties) costs only. ↩
-
Includes development of new properties (total housing properties), newly built properties acquired (total housing properties), schemes completed (total housing properties) and capitalised interest (total housing properties) costs. ↩
-
The VFM Gearing metric is based on net debt: Total debt owed by providers net of cash and cash equivalents as a percentage of Tangible fixed assets: Housing properties. ↩
-
Gross debt is £0.3bn lower than the figure quoted in 2021 Global Accounts due to the exclusion of one provider from VFM metric analysis. ↩
-
Weighted average meaning that cost lines are totalled for all providers in the sector and then divided by the total social housing units owned and/or managed. ↩
-
Red markers indicate supported housing (SH) and housing for older people (HOP) providers; defined as providers with at least 30 per cent SH stock or at least 30 per cent HOP stock. There are four supported housing providers, with cost of over £15,000 per unit that are not included in the graph. ↩
-
Business plans are commercially sensitive and the data at a provider level cannot be shared ↩
-
Green line: 2015 weighted average HSHC inflated by central CPI forecasts available in 2015. ↩
-
Size of cohort reduced from 37 to 31 in 2021. Seven providers are no longer in the cohort: three groups increased in size to above the 5,000 threshold, two groups who were in the cohort in 2020 merged into larger groups, one group are reporting slightly fewer than 2,500 units this year, and one provider have been removed for data quality reasons. One provider has moved into the cohort after reporting more than 2,500 units for the first time. ↩
-
LSVT <7 years and LSVT 7-12 years cohorts have been combined since 2019- only three providers (1% of the sector’s total stock) transferred after 2014. ↩
-
Defined as a provider with at least 50% of their stock owned in London. ↩
-
Defined as providers with at least 30% supported housing stock. ↩
-
Defined as providers with at least 30% housing for older people stock. ↩
-
The size of the cohort has reduced from 37 providers in 2020 to 31 in 2021. One provider has been removed from the dataset due to data quality issues and a further five providers have moved into other size bands due to mergers or increase/decrease in unit numbers reported. ↩
-
The number of providers in each of the cohorts, in each of the years 2019 to 2020, are outlined in Annex C. ↩
-
The number of providers in each of the cohorts, in each of the years 2019 to 2020, are outlined in Annex C. ↩
-
The number of providers in each of the cohorts, in each of the years 2019 to 2020, are outlined in Annex C. ↩
-
Those providers where supported housing or housing for older people accounts for over 30% of their stock. ↩
-
Results of the 2017 regression analysis that estimated impacts of cost factors on cost are available in Table 12 in Annex A. ↩
-
Result is driven by one lease-based provider. ↩
-
Providers who have less than 50% of stock in any one region are defined as mixed providers. ↩
-
One provider moved into the 30,000 units size band while another two providers from other groups moved into the cohort. ↩ ↩2
-
Variation of cost factor and size by region is outlined in Annex B, Table 13 ↩
-
In 2019 average net general needs levels were 63% of the average PRS rent in the North East and 59% of average PRS rent in the North West. This compares to equivalent figures of 31% in London and an England average of 48% (2019 SDR and 2019 VOA private Rental Market Statistics data). ↩
-
Total tangible fixed asset divided by the number of units – it does not refer to market valuations. ↩
-
Average property prices are highest in the capital. ↩
-
These costs were driven by just under 20% of providers in the South East cohort. ↩
-
The VFM metrics are restricted to data derived from registered providers’ Annual Accounts regulatory returns (FVA) – New supply developed by joint ventures are therefore not included in the New supply (Non-social) metric. ↩ ↩2
-
The costs associated with owning or managing a social housing unit are based on 2017 values. Nevertheless, the Regulator anticipates that the same cost factors associated with additional costs set out in table 12 remain relevant. ↩
-
This is based on a traditional provider with the median number of units all of which are general needs, operating in an area with average deprivation and wages. It is composed of the regression intercept (£2,900) plus the effect of average neighbourhood deprivation and stock holding. ↩
-
Provider level IMD deprivation score calculated by averaging IMD deprivation scores across the seven domains of deprivation, at a Lower Super Output Area (LSOA) level to obtain a LSOA deprivation score, and then mapping providers onto LSOAs using CORS letting data. ↩