Total income of DCMS-funded cultural institutions 2020/21: headline release
Published 16 December 2021
Applies to England

© Crown copyright 2021
This publication is licensed under the terms of the Open Government Licence v3.0 except where otherwise stated. To view this licence, visit nationalarchives.gov.uk/doc/open-government-licence/version/3 or write to the Information Policy Team, The National Archives, Kew, London TW9 4DU, or email: psi@nationalarchives.gov.uk.
Where we have identified any third party copyright information you will need to obtain permission from the copyright holders concerned.
This publication is available at https://www.gov.uk/government/statistics/total-income-of-dcms-funded-cultural-organisations-202021/total-income-of-dcms-funded-cultural-institutions-202021
1. Details
Released: 16 December 2021
Next release : 2022
Geographic Coverage: England
This release covers the total income of DCMS-funded cultural organisations. The categories reported here are different to those used in the DCMS-sponsored museums and galleries annual performance indicators 2020/21 report. For example, the performance indicators report includes trading net profit, but this report includes trading income.
The organisations covered by this release are also different. In addition to the 15 DCMS-sponsored museums and galleries, they include the British Film Institute, Arts Council England and their National Portfolio Organisations, Historic England and the British Library.
The 15 DCMS-sponsored museums and galleries are:
- British Museum
- Museum of the Home
- Horniman Museum
- Imperial War Museums
- National Gallery
- National Museums Liverpool
- National Portrait Gallery
- Natural History Museum
- Royal Armouries
- Royal Museums Greenwich
- Science Museum Group
- Sir John Soane’s Museum
- Tate Gallery Group
- Victoria and Albert Museum[footnote 1]
- The Wallace Collection
The data for this report covers income for these organisations up to the 2020/21 financial year (April 2020 to March 2021).
Analysis of visitor numbers during this period has shown a large fall in visits to DCMS-sponsored museums and galleries in 2020/21 compared to 2018/19 (the latest financial year completely unaffected by the pandemic) and 2019/20. This may have affected ‘other income’ figures, which include admissions and retail sales, and ‘fundraising income’ figures as museums and galleries were unable to open or faced capacity restrictions for the majority of the financial year, impeding fundraising functions.
2. Headline findings
2.1 Summary
In 2020/21, the total income of DCMS-funded cultural organisations was £4.2 billion, a 9.4% real term increase from £3.6 billion in 2019/20 and a 7.1% increase from £3.6 billion in 2018/19 (the last financial year unaffected by the Covid-19 pandemic) when adjusted for inflation [footnote 2]. The income for 2020/21 includes additional Grant-in-Aid for a range of organisations as part of the Culture Recovery Fund.
Figure 1: Total income breakdown for DCMS-funded cultural institutions over time, 2017/18 to 2020/21[footnote 3]
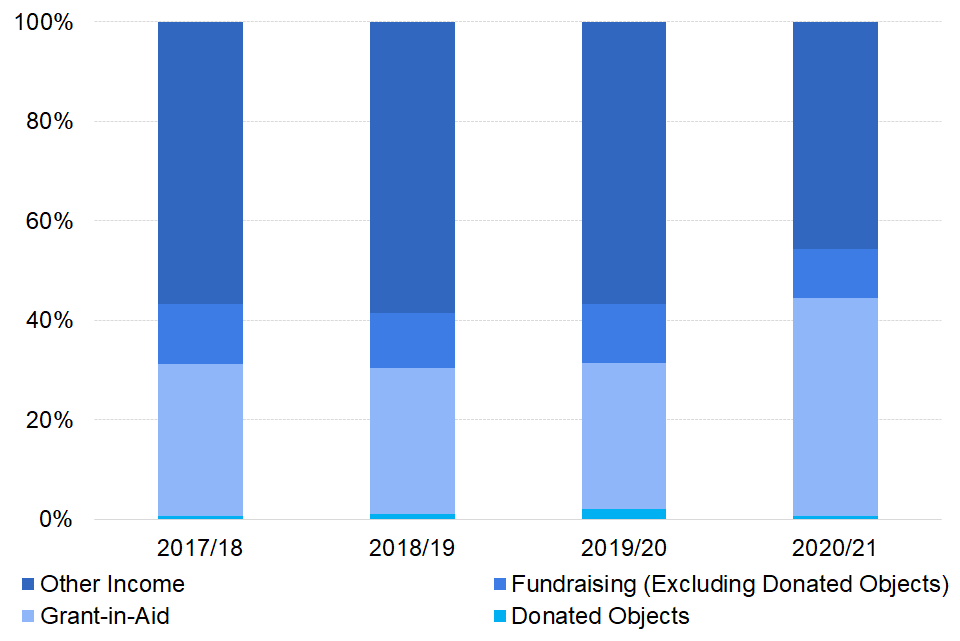
See Glossary for the definition of each income type.
2.2 Grant-in-Aid
In 2020/21, DCMS-funded cultural organisations received a total of £1.8 billion in Grant-in-Aid. This is an increase of 62.7% from 2019/20, after adjusting for inflation [footnote 4]. This increase is partially due to the distribution, by Arts Council England, of money from the Culture Recovery Fund to both National Portfolio Organisations and to other cultural organisations who applied to the fund.
The DCMS-funded cultural organisations have a variety of funding models, reflecting their diversity of size, type and purpose. The proportion of Grant-in-Aid to total income ranged from 19.0% to 99.9% across the cultural organisations.
The average proportion of Grant-in-Aid to total income over all institutions was 43.8% an increase from 29.4% in 2019/20.
2.3 Fundraising income (charitable giving, excluding donated objects)
In 2020/21, DCMS-funded cultural organisations generated a total of £413.3 million through fundraising income (excluding donated objects). This is a decrease of 8.4% in real terms [footnote 5] from 2019/20.
The proportion of fundraising income (excluding donated objects) to total income ranged from 0.1% to 46.3%. The overall average was 9.9%, a fall from 11.8% from 2019/20.
The ratio of fundraising income (including donated objects) to Grant-in-Aid was 24.2%, meaning that for every £1 of Grant-in-Aid DCMS-funded cultural organisations received in 2020/21, they generated an additional 24.2 pence in fundraising income. This compares to generated fundraising income (including donated objects) of an additional 47.1 pence per £1 in Grant-in-Aid in 2019/20 [footnote 6].
When donated objects are excluded from the fundraising income total, the ratio of fundraising income to Grant-in-Aid decreased to 22.6%, 17.5 percentage points lower than in 2019/2020 (40.1%).
2.4 Fundraising income (donated objects)
In 2020/21, DCMS-funded cultural organisations collectively received £30.3 million in the form of donated objects, a decrease of 61.9% from the previous year after adjusting for inflation [footnote 7].
The proportion of income from donated objects to total income in 2020/21 ranged from 0.0% to 18.0%. The average over all the institutions was 0.7% a fall from 2.1% in 2019/20.
The value of donated objects varies considerably over time, and between institutions. In the case of some organisations, a one off ‘star’ donation can dramatically increase this figure, whereas a few organisations do not, or rarely, receive donated objects. See technical note for further details. Caution should therefore be taken when making annual comparisons.
2.5 Other income
In 2020/21, DCMS-funded cultural organisations generated a total of £1.9 billion through other activities such as trading, investment income and admission fees. This is a decrease of 12.0% from 2019/20, after adjusting for inflation [footnote 8].
The proportion of other income to total income ranges from 0.0% to 65.8% across the cultural organisations. The average for all institutions was 45.6% of total income, a fall from 56.6% in 2019/20.
For full details of the funding sources, see the tables accompanying this release.
3. Data sources
The data presented in this report is collected from the DCMS-funded cultural organisations annual reports and accounts. The Grant-in-Aid figures [footnote 9] The Grant-in-Aid figures exclude other public funding including the DCMS/Wolfson Museums and Galleries Improvement fund and the National Lottery Heritage fund.
Data for the Arts Council England’s National Portfolio Organisations (NPOs) (formerly known as Regularly Funded Organisations, RFOs) is based on the NPO annual survey. The Arts Council England provides funding through Grant-in-Aid and National Lottery to a portfolio of organisations which includes museums, libraries and arts organisations. The latest figures reported are from the annual survey of the 828 organisations that will be funded from April 2018 to March 2022 by Arts Council England.
4. Glossary
4.1 Grant-in-Aid
Grant-in-Aid is money provided by central government departments to arms-length bodies in support of the general objectives of the organisation.
4.2 Fundraising income (charitable giving)
Fundraising income (charitable giving) does not include any money received from a publicly funded organisation, central government grants, investment income or lottery grant funding. It is defined as any money or gift received from an individual, charity or private company in one of the following forms:
- Donations, legacies, bequests and similar income
- Donated objects (also identified separately)
- Sponsorship
- Donations from connected charities + other donations
- Capital grants and donations (not from public bodies)
- Membership schemes
4.3 Other income
Other income is constituted of any other forms of income not included in the definitions for fundraising income and Grant-in-Aid. This is summarised as:
- Trading income
- Investment income
- Admissions & exhibition fees
- Development funds
- Activities for generating funds
5. Annex A: Technical Note
This statistics release is an Official Statistic and has been produced to the high professional standards set out in the Code of Practice for Statistics. For more information, see the Code of Practice for Statistics
On 1st April 2015, English Heritage split into two organisations: Historic England and English Heritage Trust. Comparisons between 2015/16 or 2016/17 and other years are therefore not possible. As of 2017/18 Historic England’s fundraising income reached a level that is comparable with those of other funded cultural organisations and is therefore now included in the report.
The following cultural organisations do not have values for donated objects. This is because:
-
The Museum of the Home accepts donated objects which fit within the collecting policy of the museum. Objects which have a value of over £1,000 are added to the museum’s collection and accounts, however no objects with a value of over £1,000 have been donated since accounting records began.
-
The Sir John Soane’s Museum receives donated objects on rare occasions and no financial value is ascribed to these in the Museum’s accounts. The founding bequest for the Wallace Collection prevents the museum from adding donated objects to their collection.
-
The V&A museum site in Dundee is operated as a separate charity to the main V&A museum group. As such, its figures are excluded from this publication and data set. ↩
-
Data from Her Majesty’s Treasury on the UK gross domestic product (GDP) deflator at current market prices was used to convert between current and 2020/21 prices. ↩
-
2017/2018 is the latest comparable year where the portfolio of funded cultural organisations includes Historic England ↩
-
See footnote 2. ↩
-
See footnote 2 ↩
-
This ratio has been amended from last year’s release (46.3%) following revisions to the fundraising income figures for a number of organisations. See published tables for more information ↩
-
See footnote 2 ↩
-
See footnote 2 ↩