Reported road casualties Great Britain: Injury severity within injury-based reporting systems 2019 and 2020
Updated 28 September 2023

© Crown copyright 2023
This publication is licensed under the terms of the Open Government Licence v3.0 except where otherwise stated. To view this licence, visit nationalarchives.gov.uk/doc/open-government-licence/version/3 or write to the Information Policy Team, The National Archives, Kew, London TW9 4DU, or email: psi@nationalarchives.gov.uk.
Where we have identified any third party copyright information you will need to obtain permission from the copyright holders concerned.
This publication is available at https://www.gov.uk/government/statistics/reported-road-casualties-great-britain-injury-severity-within-injury-based-reporting-systems/reported-road-casualties-great-britain-injury-severity-within-injury-based-reporting-systems-police-forces
This factsheet presents an initial high-level summary of statistics on injury severity and injury type, for reported road accidents in injury-based reporting systems police forces in Great Britain. The department welcomes feedback on this factsheet and, subject to this, will complete further analysis for our annual statistics scheduled for September.
This factsheet is based on data for 2019 and 2020. This includes a period impacted by the national restrictions implemented from March 2020 onwards following the coronavirus (COVID-19) pandemic. More information can be found here in our release The impact of lockdown on reported road casualties in Great Britain.
Introduction
Since 2012, some police forces have begun providing STATS19 road casualty data through injury-based reporting systems, most commonly CRaSH (Collision Recording and SHaring system). Within injury-based reporting systems, casualty severity data is determined by the most severe injury sustained.
This has provided 2 new variables that have not previously been published, most severe injury sustained and a more specific casualty severity variable. The figure below shows how the traditional severity-based assessment of casualties as killed, serious and slight map to each injury-based reporting system casualty severity level and the associated injuries (a copy in table format is available in related guidance). This classification was informed by research commissioned by the department.
Figure 1: Injury-based classification of severity

This analysis is based on data for the 23 police forces using the CRaSH system in 2019 and 2020. Although the Metropolitan police also used an injury-based system over this period, the data was not considered to be sufficiently consistent for inclusion. More details are contained within the caveats section. The full list of forces using injury-based systems in 2019 and 2020 can be found in Reported road casualties in Great Britain: 2019 annual report. No new forces joined injury-based reporting systems between 2019 and 2020.
The data therefore does not represent all casualties in Great Britain, and may not be representative of all police forces. This should be kept in mind when interpreting the results.
Casualty severity - overall
There were 66,805 casualties reported within injury-based reporting system police forces in 2019, dropping to 53,713 casualties in 2020. Table 1 shows the breakdown of these by casualty severity, including the breakdown of serious casualties into very serious, moderately serious and less serious. The proportions of casualties of each severity were broadly similar between 2019 and 2020, with the majority being slight casualties.
Table 1: Number and proportion of casualties of each severity: injury-based reporting system forces 2019 and 2020
| Casualty severity | Casualties in 2019 | % of all 2019 casualties | Casualties in 2020 | % of all 2020 casualties |
|---|---|---|---|---|
| Killed | 810 | 1.2 | 763 | 1.4 |
| Very Serious | 1,730 | 2.6 | 1,581 | 2.9 |
| Moderately Serious | 2,718 | 4.1 | 2,466 | 4.6 |
| Less Serious | 7,857 | 11.8 | 6,846 | 12.7 |
| Slight | 53,690 | 80.4 | 42,057 | 78.3 |
| Total | 66,805 | 100.0 | 53,713 | 100.0 |
Casualty severity by road user type
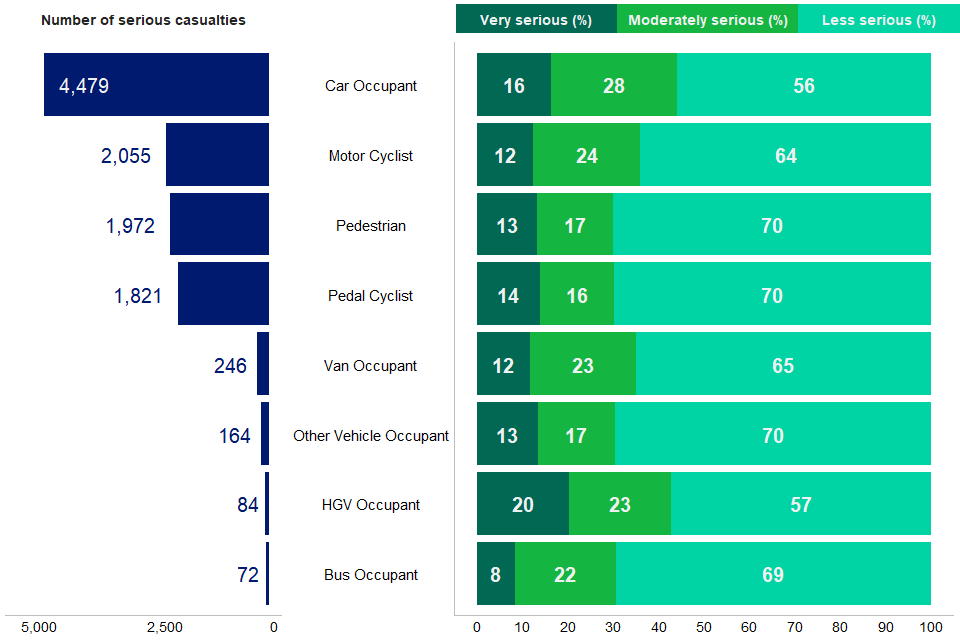
Chart 1 shows the number of serious casualties (including less, moderately and very serious) for each road user type in 2020. The chart also shows the percentage of each serious casualty type, as a proportion of the total number of serious casualties, broken down by road user type in 2020.
Within the serious category, ‘less serious’ injuries were the most common for each road user type, and ‘very serious’ injuries were least common.
Vulnerable road users (for example pedestrians, pedal cyclists) generally had a higher proportion of less serious injuries than non-vulnerable road users. In 2020, 70% of serious pedestrian and pedal cyclist casualties were categorised as ‘less serious’, compared to 56% of serious car occupant casualties.
Chart 1: Number and severity breakdown of serious casualties, by road user type: 2020
Most severe injury sustained - overall
Table 2 shows the number and percentage of casualties with each injury in 2019 and 2020. Note that this is only the most severe injury recorded by the police, not a full list of all injuries sustained. The absolute number of casualties for each injury generally decreased from 2019 to 2020. However, the proportion of injuries categorised under each injury remained broadly stable between the two years.
Table 2: Number and percentage of casualties, by most severe injury recorded: 2019 and 2020
| Most severe injury type | Casualty severity | Casualties in 2019 | % of all 2019 casualties | Casualties in 2020 | % of all 2020 casualties |
|---|---|---|---|---|---|
| Deceased | Killed | 807 | 1.2 | 763 | 1.4 |
| Broken neck or back | Very Serious | 485 | 0.7 | 521 | 1.0 |
| Internal injuries | Very Serious | 424 | 0.6 | 329 | 0.6 |
| Multiple severe injuries, unconscious | Very Serious | 196 | 0.3 | 167 | 0.3 |
| Severe chest injury | Very Serious | 192 | 0.3 | 165 | 0.3 |
| Severe head injury, unconscious | Very Serious | 421 | 0.6 | 399 | 0.7 |
| Deep penetrating wound | Moderately Serious | 79 | 0.1 | 81 | 0.2 |
| Fractured pelvis or upper leg | Moderately Serious | 892 | 1.3 | 786 | 1.5 |
| Loss of arm or leg (or part) | Moderately Serious | 41 | 0.1 | 35 | 0.1 |
| Multiple severe injuries, conscious | Moderately Serious | 492 | 0.7 | 341 | 0.6 |
| Other chest injury, not bruising | Moderately Serious | 1,177 | 1.8 | 1,208 | 2.2 |
| Deep cuts, lacerations | Less Serious | 797 | 1.2 | 729 | 1.4 |
| Fractured arm, collarbone, hand | Less Serious | 2,771 | 4.2 | 2,403 | 4.5 |
| Fractured lower leg, ankle, foot | Less Serious | 2,041 | 3.1 | 1,707 | 3.2 |
| Other head injury | Less Serious | 2,202 | 3.3 | 1,985 | 3.7 |
| Bruising | Slight | 10,926 | 16.4 | 8,233 | 15.3 |
| Shallow cuts, lacerations, abrasions | Slight | 10,831 | 16.2 | 9,325 | 17.4 |
| Shock | Slight | 2,382 | 3.6 | 1,863 | 3.5 |
| Sprains and strains | Slight | 11,222 | 16.8 | 9,246 | 17.2 |
| Whiplash or neck pain | Slight | 18,162 | 27.2 | 13,358 | 24.9 |
| Other injury | Any | 213 | 0.3 | 45 | 0.1 |
| Total | All | 66,753 | 100.0 | 53,689 | 100.0 |
Most severe injury sustained by road user type
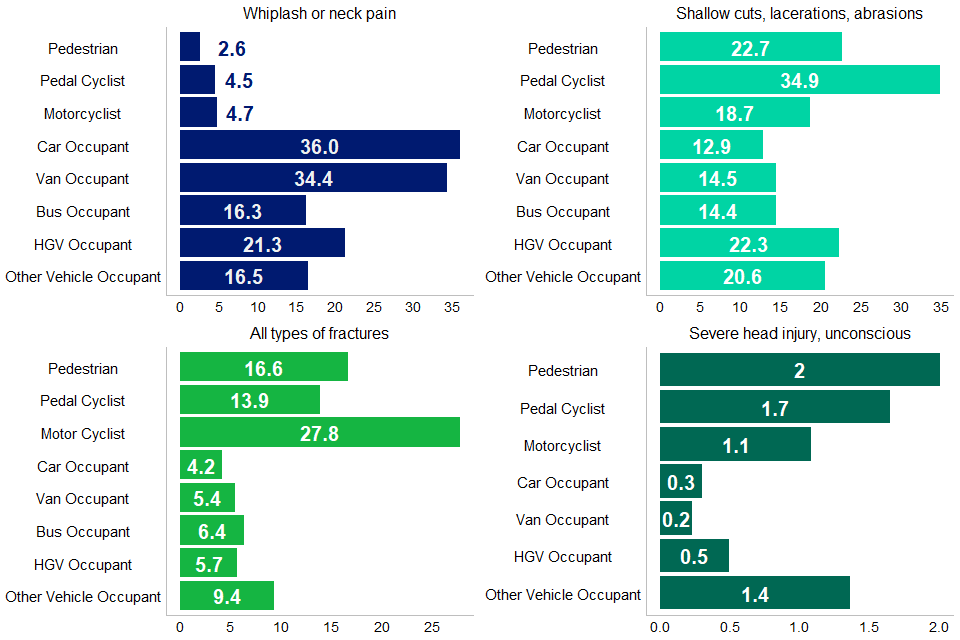
Table 3 shows the percentage of casualties assigned each most severe injury sustained, broken down by road user type, in 2020.
Compared to other road user types, van and car occupants had higher proportions of injuries categorised as whiplash or neck pain. Motorcyclists had a higher proportion of injuries categorised under all 3 types of fractures compared to other road user types. Pedal cyclists, pedestrians and motor cyclists had a higher proportion of severe head injuries and, alongside HGV occupants, a higher proportion of shallow cuts, lacerations and abrasions. These road user type differences are illustrated in Chart 2.
Table 3: Percentage of casualties assigned each most severe injury, by road user type: 2020
| Most severe injury type | Casualty severity | Pedestrian | Pedal cyclist | Motorcyclist | Car occupant | Van occupant | Bus occupant | HGV occupant | Other vehicle occupant |
|---|---|---|---|---|---|---|---|---|---|
| Deceased | Killed | 2.6 | 1.1 | 3.1 | 1.0 | 1.2 | 0.2 | 2.7 | 1.2 |
| Broken neck or back | Very Serious | 0.7 | 1.1 | 1.6 | 0.9 | 0.4 | 0.7 | 1.7 | 0.9 |
| Internal injuries | Very Serious | 0.8 | 0.7 | 1.1 | 0.5 | 0.5 | 0.0 | 1.0 | 0.5 |
| Multiple severe injuries, unconscious | Very Serious | 0.4 | 0.3 | 0.8 | 0.2 | 0.3 | 0.2 | 0.5 | 0.7 |
| Severe chest injury | Very Serious | 0.1 | 0.4 | 0.7 | 0.3 | 0.2 | 0.2 | 0.5 | 0.3 |
| Severe head injury, unconscious | Very Serious | 2.0 | 1.7 | 1.1 | 0.3 | 0.2 | 0.0 | 0.5 | 1.4 |
| Deep penetrating wound | Moderately Serious | 0.2 | 0.2 | 0.5 | 0.1 | 0.2 | 0.4 | 0.5 | 0.0 |
| Fractured pelvis or upper leg | Moderately Serious | 3.0 | 2.0 | 4.3 | 0.7 | 0.8 | 2.0 | 0.5 | 1.0 |
| Loss of arm or leg (or part) | Moderately Serious | 0.1 | 0.0 | 0.3 | 0.0 | 0.1 | 0.0 | 0.7 | 0.2 |
| Multiple severe injuries, conscious | Moderately Serious | 0.9 | 0.7 | 1.8 | 0.4 | 0.4 | 0.0 | 0.7 | 0.7 |
| Other chest injury, not bruising | Moderately Serious | 0.9 | 1.8 | 3.0 | 2.5 | 1.8 | 0.5 | 2.2 | 2.6 |
| Deep cuts, lacerations | Less Serious | 1.9 | 2.9 | 1.7 | 0.9 | 1.1 | 1.1 | 3.0 | 3.2 |
| Fractured arm, collarbone, hand | Less Serious | 4.7 | 8.8 | 12.5 | 2.5 | 3.3 | 2.7 | 3.0 | 5.1 |
| Fractured lower leg, ankle, foot | Less Serious | 8.9 | 3.1 | 11.0 | 1.0 | 1.3 | 1.6 | 2.2 | 3.2 |
| Other head injury | Less Serious | 5.7 | 5.4 | 1.6 | 3.2 | 3.6 | 3.7 | 3.7 | 7.7 |
| Bruising | Slight | 24.5 | 17.1 | 13.8 | 13.4 | 13.0 | 25.8 | 11.1 | 14.1 |
| Shallow cuts, lacerations, abrasions | Slight | 22.7 | 34.9 | 18.7 | 12.9 | 14.5 | 14.4 | 22.3 | 20.6 |
| Shock | Slight | 2.4 | 0.9 | 0.6 | 4.5 | 3.7 | 9.0 | 5.4 | 3.6 |
| Sprains and strains | Slight | 15.1 | 12.3 | 17.1 | 18.5 | 18.8 | 21.0 | 16.3 | 16.2 |
| Whiplash or neck pain | Slight | 2.6 | 4.5 | 4.7 | 36.0 | 34.4 | 16.3 | 21.3 | 16.5 |
| Other injury | Any | 0.0 | 0.1 | 0.1 | 0.1 | 0.1 | 0.2 | 0.0 | 0.5 |
| Total | All | 100.0 | 100.0 | 100.0 | 100.0 | 100.0 | 100.0 | 100.0 | 100.0 |
Chart 2: Road user type differences in the percentage of casualties assigned certain most severe injuries
Caveats
The Metropolitan police used an injury-based system to report road casualties over this period. However, casualty data from the Metropolitan police is currently inconsistently populated within the STATS19 database. Metropolitan police data has therefore been removed from this analysis. The exception to this is the small number of casualties that occurred in Metropolitan police areas, but were reported by neighbouring police forces using CRaSH. This casualty data was retained for Table 1 and Chart 1. Additionally, a small number of casualties across several police forces were removed from this analysis, due to inconsistent casualty severity and most severe injury type data. Solutions to these data issues are being investigated by the department.
Feedback
We welcome further feedback on any aspects of the department’s road safety statistics including content, timing, and format, via the contact details below.
Instructions for printing and saving
Depending on which browser you use and the type of device you use (such as a mobile or laptop) these instructions may vary.
How to search
Select Ctrl and F on a Windows laptop or Command and F on a Mac
This will open a search box in the top right-hand corner of the page. Type the word you are looking for in the search bar and press enter.
Your browser will highlight the word, usually in yellow, wherever it appears on the page. Press enter to move to the next place it appears.
Tablets and mobile devices normally have the option to “find in text” and “print or save” in their sharing or quick options menu of their browser, but this will vary by device model.
Contact details
Road safety statistics