Local Alcohol Profiles for England: short statistical commentary, October 2021
Published 5 October 2021
Applies to England

© Crown copyright 2021
This publication is licensed under the terms of the Open Government Licence v3.0 except where otherwise stated. To view this licence, visit nationalarchives.gov.uk/doc/open-government-licence/version/3 or write to the Information Policy Team, The National Archives, Kew, London TW9 4DU, or email: psi@nationalarchives.gov.uk.
Where we have identified any third party copyright information you will need to obtain permission from the copyright holders concerned.
This publication is available at https://www.gov.uk/government/statistics/local-alcohol-profiles-for-england-lape-october-2021-update/local-alcohol-profiles-for-england-short-statistical-commentary-october-2021
New in this update
New and revised alcohol-related mortality and hospital admissions data have been added to the Local Alcohol Profiles for England (LAPE) tool on the Fingertips platform. The following indicators have been updated and are available at local authority level as well as for England, the regions, and various inequality groups:
- alcohol-related mortality
- alcohol-related admissions (Broad)
- alcohol-related admissions (Narrow)
- alcohol-related admissions (Narrow): <40s
- alcohol-related admissions (Narrow): 40-64
- alcohol-related admissions (Narrow): 65+
- alcohol-related admissions (Narrow) for unintentional injuries
- alcohol-related admissions (Narrow) for mental and behavioural disorders
- alcohol-related admissions (Narrow) for intentional self-poisoning due to exposure to alcohol
- alcohol-related admissions (Broad) for cardiovascular disease
- alcohol-related admissions (Broad) for mental and behavioural disorders
- alcohol-related admissions (Broad) for alcoholic liver disease
The calculation that underlies all alcohol-related indicators has been updated to take account of the latest academic evidence and more recent alcohol-consumption figures. This change has been applied to all indicators covering data for 2016. The result has been that the newly published mortality and admission rates are lower than those previously published. This is due to a change in methodology rather than a sudden reduction in the amount of harm caused by alcohol.
Figures published previously did not misrepresent the burden of alcohol based on the previous evidence – the methodology used in this update is as close as sources and data allow to the original method. Though the number of deaths and admissions attributed to alcohol each year is lower than previously, the direction of trend and the key inequalities due to alcohol harm remain the same. Alcohol remains a significant burden on the health of the population and the harm alcohol causes to individuals remains unchanged.
Main findings
There were 19,190 alcohol-related deaths in England in 2019, a minor reduction in the rate to 35.7 (per 100,000). The rate shows no significant change since 2016.
There were 976,425 alcohol-related hospital admissions under the Broad definition in England in 2019 to 2020, an increase in the rate to 1,815 (per 100,000). This represents the third consecutive increase in the rate since 2016 to 2017.
There were 280,185 alcohol-related hospital admissions under the Narrow definition in England in 2019 to 2020, an increase in the rate to 519 (per 100,000). This represents the second consecutive increase in the rate since 2017 to 2018.
Except for admissions in the under 40s (Narrow) and all age admissions for self-poisoning by and exposure to alcohol (Narrow) and mental and behavioural disorders due to use of alcohol (Narrow) all admission indicators show an increase for the latest time point (2019 to 2020).
Gender and inequality gaps persist across the measures showing that greater levels of harm are seen in men and the most deprived (with noted exception that the female admission rate is higher for self-poisoning (Narrow)).
Key definitions used in this release
Alcohol-related mortality: Deaths from alcohol-related conditions based on underlying cause of death. Each alcohol related death is assigned an alcohol attributable fraction based on underlying cause of death.
Alcohol-related admissions (Broad): A measure of hospital admissions where either the primary diagnosis (main reason for admission) or one of the secondary (contributory) diagnoses is an alcohol-related condition. This represents a Broad measure of alcohol-related admissions but is sensitive to changes in coding practice over time.
Alcohol-related admissions (Narrow): A measure of hospital admissions where the primary diagnosis (main reason for admission) is an alcohol-related condition. This represents a Narrower measure. Since every hospital admission must have a primary diagnosis it is less sensitive to coding practices but may also understate the part alcohol plays in the admission.
In general, the Broad measure gives an indication of the full impact of alcohol on hospital admissions and the burden placed on the NHS. The Narrow measure estimates the number of hospital admissions which are primarily due to alcohol consumption and provides the best indication of trends in alcohol-related hospital admissions.
Summary of updated indicators
Alcohol-related mortality
There were 19,190 alcohol-related deaths in England in 2019. This equates to a rate of 35.7 (per 100,000) and the trend shows no significant change since 2016. The female rate in 2019 was 19.4 (per 100,000) while the male rate was 54.7 (per 100,000). Consequently, the number of alcohol-related deaths in 2019 for men (13,705) was more than double the figure for women (5,485).
Figure 1: Alcohol-related mortality by sex, England
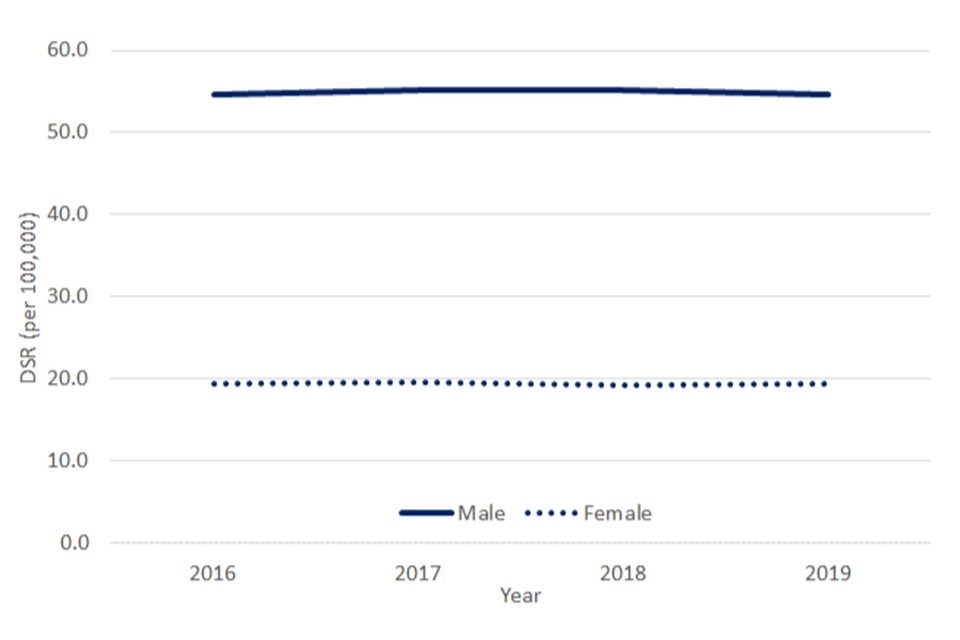
For the most recent period (2019) the rate of alcohol-related deaths in the most deprived LTLA areas (45.3 per 100,000) is significantly higher than the rate observed in the least deprived areas (27.3 per 100,000).
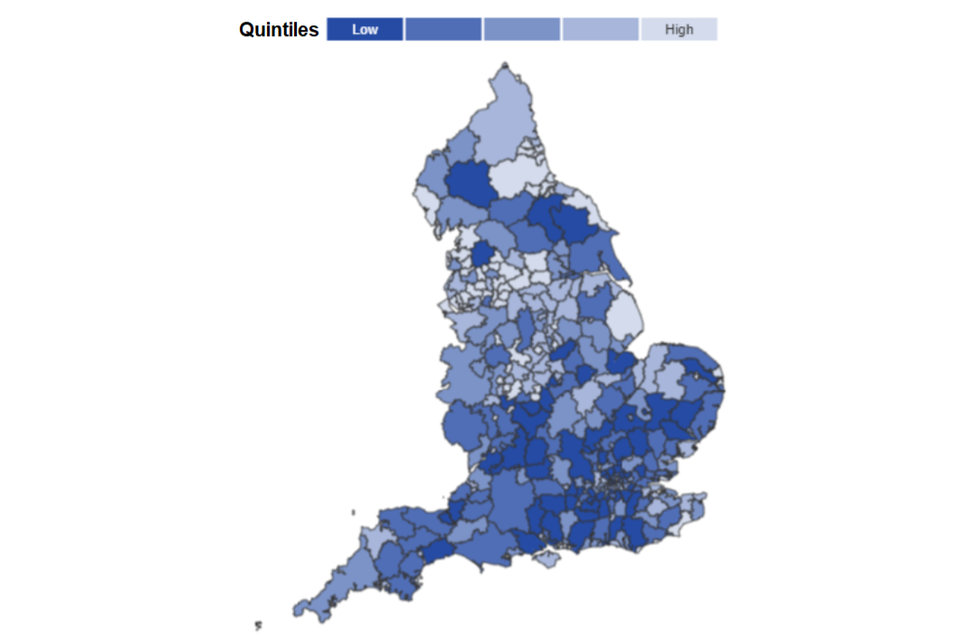
Figure 2 shows the variation in alcohol-related mortality rates across lower tier local authorities in England, ranging from 19.7 (per 100,000) in South Cambridgeshire to 65.4 (per 100,000) in Blackpool.
Figure 2: Alcohol-related mortality, district and unitary authorities in England, 2019
Alcohol-related admissions (Broad)
There were 976,425 alcohol-related admissions under the Broad definition in 2019 to 2020. This equates to a rate of 1,815 (per 100,000). The female rate was 943 (per 100,000) while the male rate was 2,809 (per 100,000). Consequently, the number of Broad alcohol-related admissions in 2019 to 2020 for men (713,550) was almost three times the figure for women (262,875).
Figure 3: Alcohol-related admissions (Broad) by sex, England
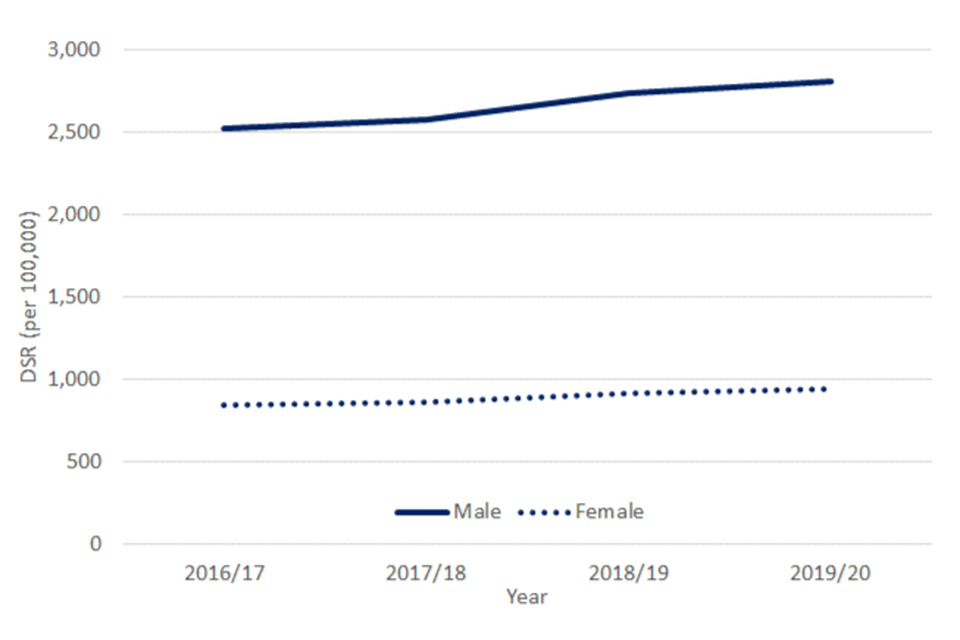
For the most recent period (2019 to 2020) the rate of Broad alcohol-related admissions in the most deprived LTLA areas (2,274 per 100,000) was significantly higher than the rate in the least deprived (1,401 per 100,000).
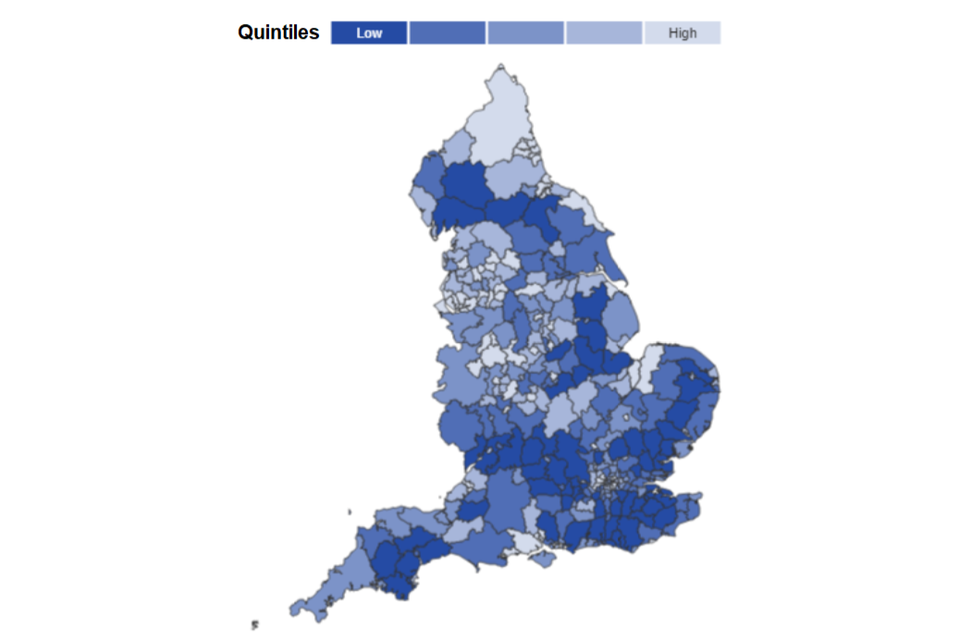
Figure 4 shows the variation in Broad alcohol-related admissions across lower tier local authorities in England, ranging from 1,048 (per 100,000) in East Devon to 4,067 (per 100,000) in Southampton.
Figure 4: Alcohol-related admissions (Broad) district and unitary authorities in England, 2019 to 2020
Alcohol-related admissions (Narrow)
There were 280,185 alcohol-related admissions under the Narrow definition in 2019 to 2020. This equates to a rate of 519 (per 100,000). The female rate was 359 (per 100,000) while the male rate was 695 (per 100,000). Consequently, the number of Narrow alcohol-related admissions in 2019/20 for men (180,940) was almost double the figure for women (99,245).
Figure 5: Alcohol-related admissions (Narrow) by sex, England
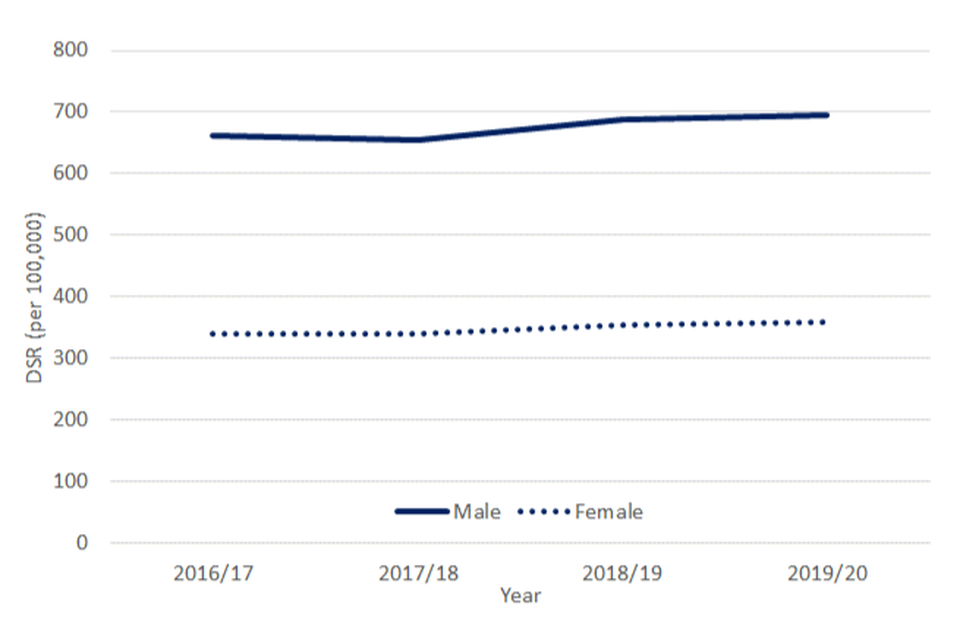
For the most recent period (2019 to 2020) the rate of Narrow alcohol-related admissions in the most deprived LTLA areas (603 per 100,000) was significantly higher than the rate in the least deprived (380 per 100,000).
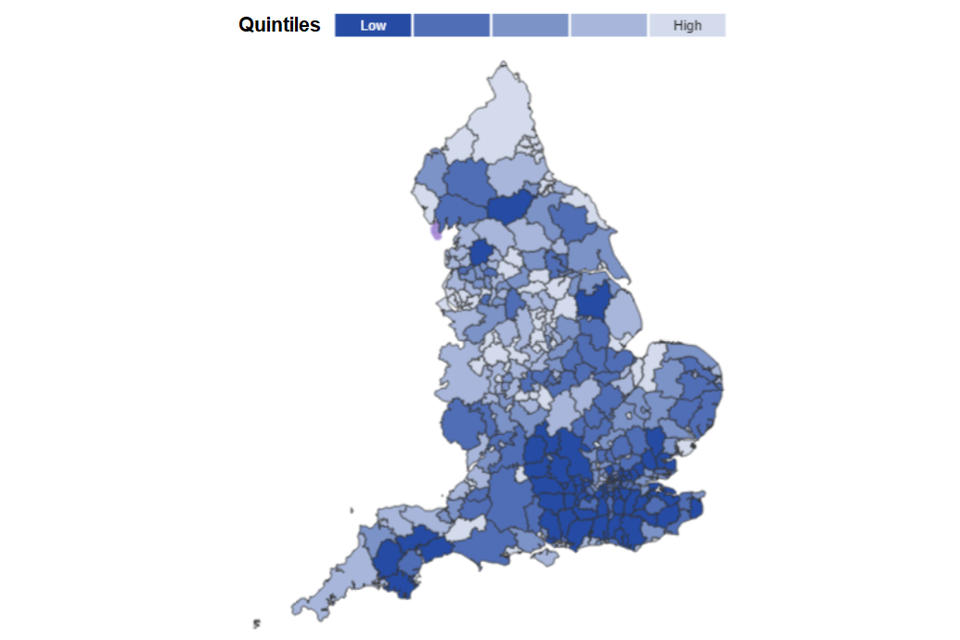
Figure 6 shows the variation in Narrow alcohol-related admissions across lower tier local authorities in England, ranging from 286 (per 100,000) in Wokingham to 917 (per 100,000) in Stoke-on-Trent.
Figure 6: Alcohol-related admissions (Narrow) district and unitary authorities in England, 2019 to 2020
Background and further information
LAPE have been published on an annual basis since 2006. These profiles have been designed to help local government and health services assess the effect of alcohol use on their local populations. They will inform commissioning and planning decisions to tackle alcohol use and improve the health of local communities.
The LAPE data tool helps local areas assess alcohol-related harm and monitor the progress of efforts to reduce this.
View the LAPE Profile
Definitions and methodology for all LAPE indicators is described in our user guide.
View the LAPE User Guide (PDF, 516KB)
Responsible statistician, product lead: Mark Cook For queries relating to this publication, please contact: lape@phe.gov.uk