Local Alcohol Profiles for England: short statistical commentary, August 2022
Published 2 August 2022
Applies to England

© Crown copyright 2022
This publication is licensed under the terms of the Open Government Licence v3.0 except where otherwise stated. To view this licence, visit nationalarchives.gov.uk/doc/open-government-licence/version/3 or write to the Information Policy Team, The National Archives, Kew, London TW9 4DU, or email: psi@nationalarchives.gov.uk.
Where we have identified any third party copyright information you will need to obtain permission from the copyright holders concerned.
This publication is available at https://www.gov.uk/government/statistics/local-alcohol-profiles-for-england-lape-august-2022-update/local-alcohol-profiles-for-england-short-statistical-commentary-august-2022
1. New in this update
New data have been added to the Local Alcohol Profiles for England (LAPE) tool on the Fingertips platform. The following indicators have been updated and are available at local authority level as well as for England, the regions, and various inequality groups:
-
potential years of life lost (PYLL) due to alcohol-related conditions (new methodology)
-
casualties in road traffic accidents where a failed breath test (or refusal to provide a sample) occurred
-
incidence rate of alcohol-related cancer
2. Main findings
The main findings are:
-
there were 293,980 years of life lost due to alcohol-related conditions for males in England in 2020. This equates to a rate of 1,116 per 100,000 population
-
there were 138,060 years of life lost due to alcohol-related conditions for females in England in 2020. This equates to a rate of 500 per 100,000 population
-
there were 14,020 casualties in road traffic accidents where a failed breath test occurred in England in 2018 to 2020. This equates to 3.6% of casualties in all reported accidents
-
between 2017 to 2019 there were an estimated 60,240 cancer registrations which were related to alcohol consumption. This equates to a rate of 38.0 per 100,000 population
3. Background
For this update the potential years of life lost (PYLL) due to alcohol-related conditions indicator has been revised. This is presented as a new indicator in Fingertips due to an improvement in the methodology that now measures years of life lost up to average life expectancy, rather than up to age 75 as under the previous definition. A back trend to 2016 has been published; this brings the indicator into alignment with other alcohol-related mortality indicators available in LAPE.
It has not been possible to update the road traffic accidents indicator for several years due to issues with the source data. This has now been addressed with a new methodology based on new source data available from Department of Transport.
4. Key definitions used in this release
The key definitions are:
-
Potential years of life lost (PYLL): measure of mortality based on summing alcohol-related deaths occurring at each age and multiplying this with the number of remaining years left to live according to life expectancy tables published by the Office of National Statistics
-
Casualties in road traffic accidents where a failed breath test occurred: percentage of casualties in reported accidents where a failed breath test (or refusal to provide a sample) occurred of those accidents where a motor vehicle was involved whether a driver or rider was breathalysed or not
-
Incidence rate of alcohol-related cancer: age standardised rate of new alcohol-related cancers per 100,000 population
5. Summary of updated indicators
5.1 Potential years of life lost (PYLL) due to alcohol-related conditions
There were 293,980 years of life lost due to alcohol-related conditions for males in England in 2020. This equates to a rate of 1,116 (per 100,000 population). This represents an increase from 2019 where the rate was 1,094 per 100,000 population and the rate has been increasing since 2016.
There were 138,060 years of life lost due to alcohol-related conditions for females in England in 2020. This equates to a rate of 500 (per 100,000 population). This represents an increase from 2019 where the rate was 469 per 100,000 population.
Figure 1: age standardised potential years of life lost due to alcohol-related conditions rates by sex, 2016 to 2020, England
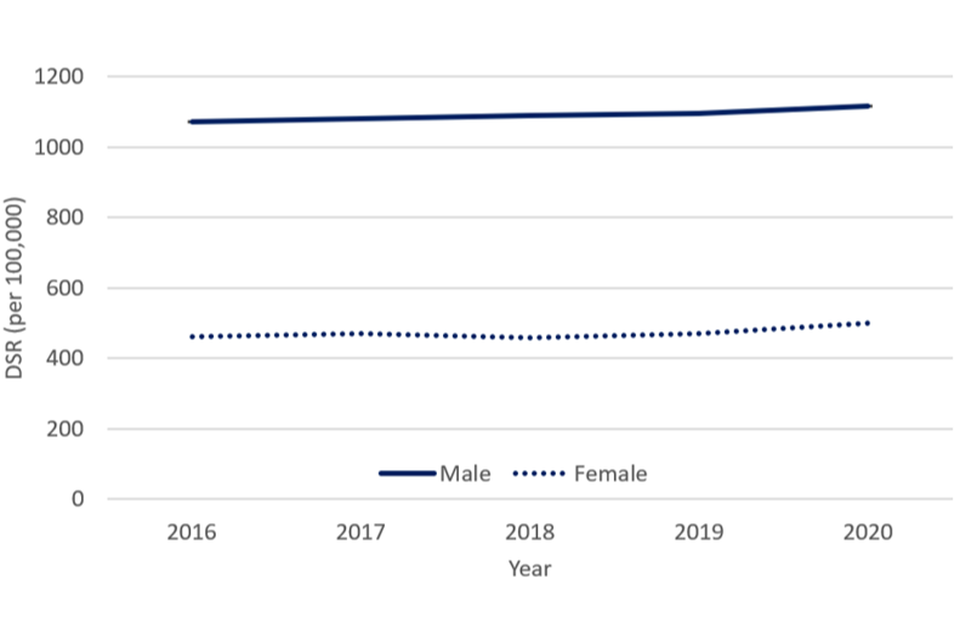
Source: Calculated by OHID: Population Health Analysis (PHA) team from the Office for National Statistics (ONS) Annual Death Extract Public Health Mortality File, ONS Single Year Life Tables, and ONS Mid-Year Population Estimates
For the most recent period (2020) the male rate of potential years of life lost in the most deprived tenth of district and unitary authorities (1,542 per 100,000) was double the rate in the least deprived (798 per 100,000).
For the most recent period (2020) the female rate of potential years of life lost in the most deprived tenth of district and unitary authorities (646 per 100,000) was 1.7 times higher than the rate in the least deprived (373 per 100,000).
5.2 Casualties in road traffic accidents where a failed breath test (or refusal to provide a sample) occurred
There were 14,020 casualties in road traffic accidents where a failed breath test occurred in England in 2018 to 2020. This equates to 3.6% of casualties in all reported accidents (whether the driver passed, failed, or was not breathalysed). This has not changed since 2017 to 2019 (3.5%).
Figure 2 shows the variation in casualties across England where the percentage ranges from 7.3% (Rutland) and 7.0% (Leicestershire) in mainly rural areas to around 1% in mainly inner city areas such as Camden (0.9%) and Hammersmith and Fulham (1.0%).
Figure 2: percentage of casualties in reported accidents in which at least one driver or rider failed a breath test or refused to provide a sample, 2018 to 2020, England
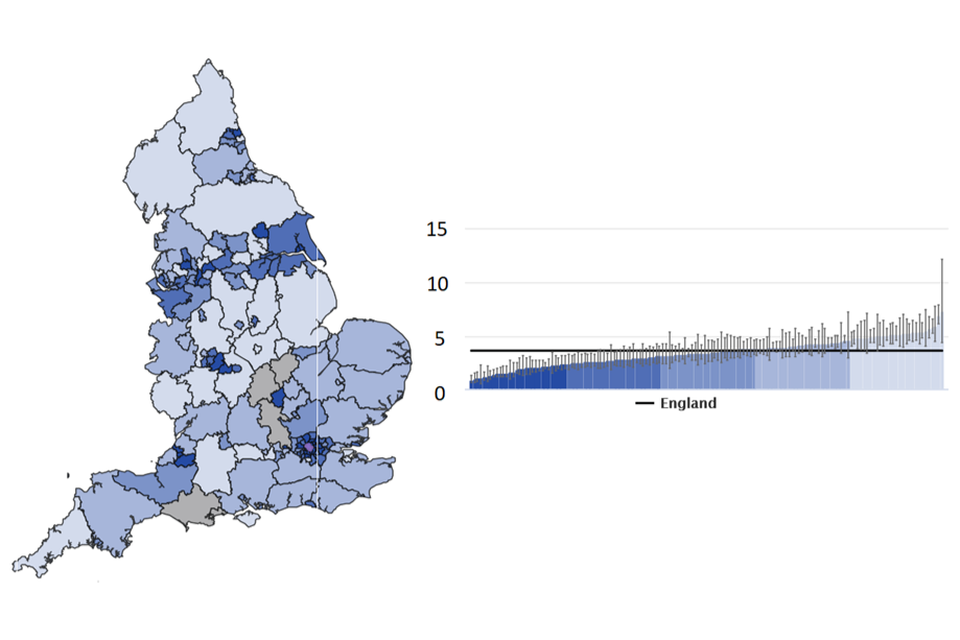
Source: Calculated by OHID: Population Health Analysis (PHA) team from Department for Transport STATS19 breath test data
5.3 Incidence rate of alcohol-related cancer
Between 2017 to 2019 there were an estimated 60,240 cancer registrations which were related to alcohol consumption. This equates to a rate of 38.0 per 100,000 population. The rate has been static at around 38.0 per 100,000 since 2010 to 2012.
Figure 3: Age standardised alcohol-related cancer incidence by sex, 2004 to 2006 to 2017 to 2019, England
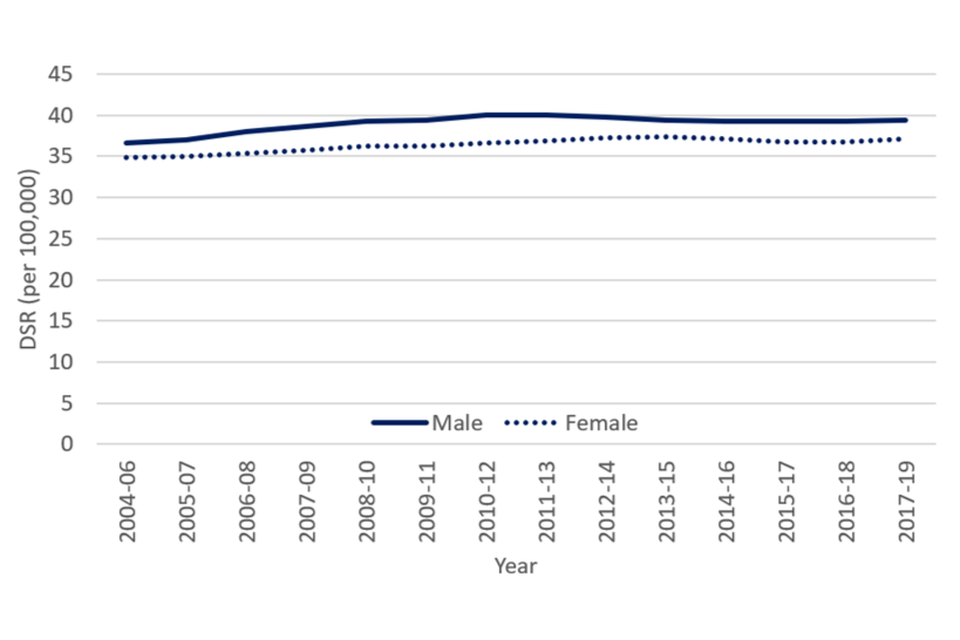
Source: Calculated by OHID: Population Health Analysis (PHA) team from incidence data produced from the National Cancer Registration and Analysis Service (NCRAS) and the ONS published mid-year population estimates
For the most recent period (2017 to 2019) alcohol-related cancer incidence rates in the most deprived tenth of district and unitary authorities (41.4 per 100,000) were higher than the rate in the least deprived (35.9 per 100,000). For 2017 to 2019, Blackpool (48.1 per 100,000) had the highest rate followed by Manchester (47.1 per 100,000), while Camden (29.2 per 100,000) had the lowest followed by Westminster (29.5 per 100,000).
6. Background and further information
The Local Alcohol Profiles for England (LAPE) have been published on an annual basis since 2006. These profiles have been designed to help local government and health services assess the effect of alcohol use on their local populations. They will inform commissioning and planning decisions to tackle alcohol use and improve the health of local communities.
The LAPE data tool helps local areas assess alcohol-related harm and monitor the progress of efforts to reduce this.
View the LAPE Profile
Responsible statistician, product lead: Mark Cook