Monthly UK statistics on cattle, sheep and pig slaughter and meat production – May 2023 (published 15 June 2023)
Updated 15 February 2024

© Crown copyright 2024
This publication is licensed under the terms of the Open Government Licence v3.0 except where otherwise stated. To view this licence, visit nationalarchives.gov.uk/doc/open-government-licence/version/3 or write to the Information Policy Team, The National Archives, Kew, London TW9 4DU, or email: psi@nationalarchives.gov.uk.
Where we have identified any third party copyright information you will need to obtain permission from the copyright holders concerned.
This publication is available at https://www.gov.uk/government/statistics/historical-statistics-notices-on-the-number-of-cattle-sheep-and-pigs-slaughtered-in-the-uk-2023/monthly-uk-statistics-on-cattle-sheep-and-pig-slaughter-and-meat-production-may-2023-published-15-june-2023
Following a quality assurance exercise, from April 2023 livestock numbers will be obtained from Food Standards Agency (FSA) administrative data. Data from Defra’s slaughterhouse survey will be used to collect weights of meat produced and to apportion FSA data into livestock categories.
This release contains a revision to slaughter data from January 2021. This revision is due to an issue we identified in our previous methodology for calculating slaughter numbers. These revisions used the FSA livestock totals. Please see the section 5.2.1. for further information.
1. Key messages.
-
UK prime cattle (steers, heifers and young bulls) slaughterings in May 2023 were down 8.7% on May 2022 at 173,000 head. Beef and veal production was 74,000 tonnes, 8.5% lower than in May 2022.
-
UK clean sheep slaughterings were down 4.1% on May 2022 at 902,000 head. Mutton and lamb production was 23,000 tonnes, 3.0% lower than in May 2022.
-
UK clean pig slaughterings were down 14% on May 2022 at 842,000 head. Pigmeat production was 78,000 tonnes, 15% lower than in May 2022.
2. Livestock slaughtered
2.1 Monthly numbers of home killed livestock slaughtered
Table 2.1 shows monthly estimates of the number of home killed cattle, sheep and pigs, slaughtered as meat for human consumption in UK abattoirs.
Table 2.1: United Kingdom monthly numbers of livestock slaughtered (Thousand head)
| May 22 | Mar 23 | Apr 23 | May 23 | yr on yr | |
|---|---|---|---|---|---|
| 31 days | 31 days | 30 days | 31 days | % change | |
| Steers | 97 | 92 | 84 | 89 | -8.4% |
| Heifers | 72 | 72 | 64 | 66 | -8.3% |
| Young Bulls | 20 | 12 | 14 | 17 | -11% |
| Cows and Adult Bulls | 48 | 53 | 45 | 45 | -7.3% |
| Calves | 8 | 13 | 8 | 8 | -4.9% |
| Clean Sheep | 941 | 1174 | 952 | 902 | -4.1% |
| Ewes and Rams | 139 | 155 | 125 | 134 | -3.6% |
| Clean Pigs | 984 | 859 | 765 | 842 | -14% |
| Sows and Boars | 23 | 21 | 18 | 20 | -12% |
2.2 Average weekly number of home killed livestock slaughtered
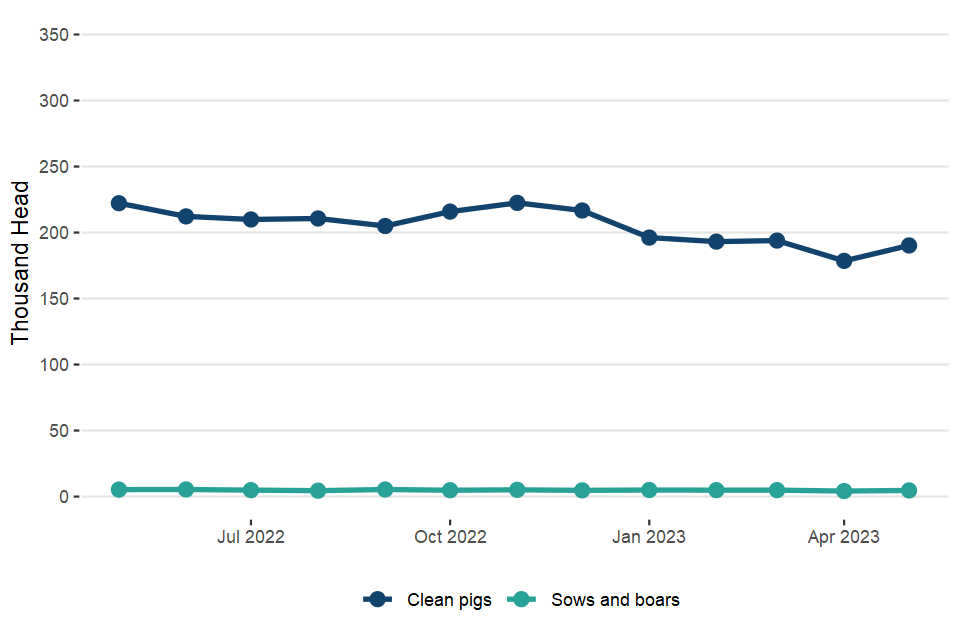
Table 2.2 shows the average weekly slaughter figures for the last three months and the previous year’s current month for comparison. The monthly slaughter figures in section one are affected by the number of days in the survey period. To get a clearer measure of trends weekly averages are calculated using the number of livestock slaughtered and the number of days in each period. Longer term trends can be seen in Figures 2.1, 2.2 and 2.3, following this table.
Table 2.2: United Kingdom average weekly numbers of livestock slaughtered (Thousand head)
| May 22 | Mar 23 | Apr 23 | May 23 | |
|---|---|---|---|---|
| Steers | 22 | 21 | 20 | 20 |
| Heifers | 16 | 16 | 15 | 15 |
| Young Bulls | 4 | 3 | 3 | 4 |
| Cows and Adult Bulls | 11 | 12 | 10 | 10 |
| Calves | 2 | 3 | 2 | 2 |
| Clean Sheep | 212 | 265 | 222 | 204 |
| Ewes and Rams | 31 | 35 | 29 | 30 |
| Clean Pigs | 222 | 194 | 179 | 190 |
| Sows and Boars | 5 | 5 | 4 | 5 |
Figure 2:1 United Kingdom average weekly numbers of cattle slaughtered
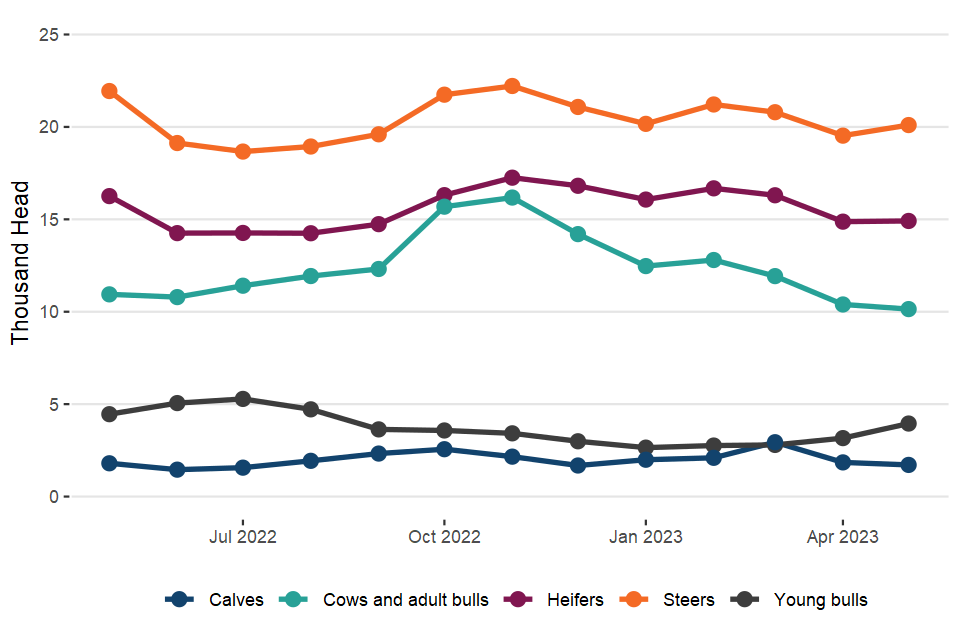
Figure 2:2 United Kingdom average weekly numbers of sheep slaughtered
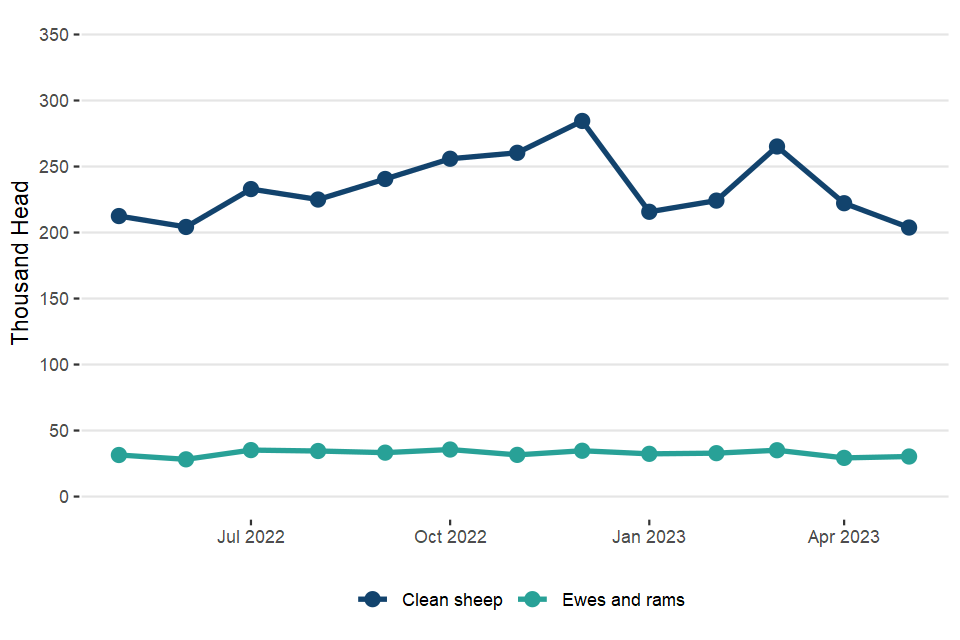
Figure 2:3 United Kingdom average weekly numbers of pigs slaughtered
2.3 Monthly numbers of home killed livestock slaughtered by country
Table 2.3 shows monthly estimates of the number of cattle, sheep and pigs slaughtered for meat in England and Wales, Scotland, Great Britain and Northern Ireland.
Table 2.3: United Kingdom monthly numbers of livestock slaughtered by country (Thousand head)
| England & Wales | Mar 23 | Apr 23 | May 23 |
|---|---|---|---|
| 31 days | 30 days | 31 days | |
| Steers | 61 | 55 | 62 |
| Heifers | 45 | 39 | 44 |
| Young Bulls | 9 | 9 | 12 |
| Cows and Adult Bulls | 37 | 31 | 32 |
| Calves | 13 | 7 | 7 |
| Clean Sheep | 1029 | 845 | 812 |
| Ewes and Rams | 151 | 122 | 131 |
| Clean Pigs | 679 | 596 | 696 |
| Sows and Boars | 20 | 16 | 19 |
| Scotland | Mar 23 | Apr 23 | May 23 |
|---|---|---|---|
| 31 days | 30 days | 31 days | |
| Steers | 16 | 14 | 15 |
| Heifers | 14 | 12 | 12 |
| Young Bulls | 1 | 1 | 3 |
| Cows and Adult Bulls | 6 | 5 | 5 |
| Calves | 0 | 0 | 0 |
| Clean Sheep | 105 | 77 | 62 |
| Ewes and Rams | 2 | 2 | 2 |
| Clean Pigs | 20 | 19 | 18 |
| Sows and Boars | 2 | 2 | 2 |
| Great Britain | Mar 23 | Apr 23 | May 23 |
|---|---|---|---|
| 31 days | 30 days | 31 days | |
| Steers | 77 | 69 | 77 |
| Heifers | 59 | 51 | 55 |
| Young Bulls | 10 | 11 | 15 |
| Cows and Adult Bulls | 43 | 36 | 37 |
| Calves | 13 | 7 | 7 |
| Clean Sheep | 1134 | 922 | 873 |
| Ewes and Rams | 153 | 124 | 133 |
| Clean Pigs | 699 | 615 | 714 |
| Sows and Boars | 21 | 18 | 20 |
| Northern Ireland | Mar 23 | Apr 23 | May 23 |
|---|---|---|---|
| 31 days | 30 days | 31 days | |
| Steers | 15 | 15 | 12 |
| Heifers | 13 | 13 | 11 |
| Young Bulls | 3 | 3 | 3 |
| Cows and Adult Bulls | 9 | 9 | 7 |
| Calves | 0 | 0 | 0 |
| Clean Sheep | 40 | 31 | 29 |
| Ewes and Rams | 2 | 2 | 1 |
| Clean Pigs | 160 | 150 | 128 |
| Sows and Boars | 0 | 0 | 0 |
3. Average dressed carcase weights
3.1 Monthly average dressed carcase weights for cattle, sheep, and pigs
Table 3.1 shows the monthly average dressed carcase weight (DCW) of livestock slaughtered for meat for human consumption in the United Kingdom.
Table 3.1 United Kingdom average dressed carcase weights (Kilogrammes)
| Feb 23 | Mar 23 | Apr 23 | May 23 | |
|---|---|---|---|---|
| Steers | 358.8 | 359.6 | 358.5 | 359.7 |
| Heifers | 325.1 | 324.2 | 325.2 | 323.7 |
| Young Bulls | 340.1 | 347.3 | 348.6 | 355.1 |
| Cows and Adult Bulls | 314.0 | 321.4 | 315.2 | 315.1 |
| Calves | 78.0 | 61.2 | 67.7 | 76.4 |
| Clean Sheep | 20.0 | 20.5 | 19.5 | 21.0 |
| Ewes and Rams | 26.3 | 24.9 | 27.1 | 28.2 |
| Clean Pigs | 88.9 | 89.1 | 89.4 | 88.6 |
| Sows and Boars | 147.0 | 146.9 | 142.0 | 142.2 |
The dressed carcase weight of calves varies significantly depending on the age of the calves.
4. Home killed meat production
4.1 Monthly volumes of home killed meat production
Table 4.1 shows the monthly volumes of meat produced in UK abattoirs.
Table 4.1: United Kingdom monthly volumes of meat production (Thousand tonnes)
| May 22 | Mar 23 | Apr 23 | May 23 | yr on yr | |
|---|---|---|---|---|---|
| 31 days | 31 days | 30 days | 31 days | % change | |
| Beef | 81 | 79 | 70 | 74 | -8.5% |
| Mutton and Lamb | 23 | 28 | 22 | 23 | -3.0% |
| Pigmeat | 91 | 80 | 71 | 78 | -15% |
5. About these statistics
5.1 Methodology
Following a quality assurance exercise from April 2023 livestock numbers will be obtained from Food Standards Agency (FSA) administrative data. The FSA data provides complete monthly coverage of slaughterhouse throughput in England and Wales.
Defra runs monthly slaughterhouse surveys that collects information on livestock slaughter numbers and weight of meat produced by category. These data are used to apportion FSA data into livestock categories and for quality assurance purposes. The survey goes to all major slaughterhouses and survey response is typically around 90%.
Similar surveys are run by RESAS in Scotland and by DAERA in Northern Ireland. Scottish statistics on livestock slaughterings are available in [the Economic Report on Scottish Agriculture at the Economic Report on Scottish Agriculture webpage from Scottish government (Tables A5 and A6). This website also contains contact details and more information. Northern Ireland results are available at the Northern Ireland cattle sheep slaughterings webpage and Northern Ireland pig slaughterings webpage.
Information on the weight of meat produced from a sample of animals weighed at slaughterhouses is obtained from survey respondents. From the information provided average dressed carcase weights for each animal type are primarily calculated by adding up the total weight of the meat produced and dividing by the number of animals weighed. Cold dressed carcase weights are recorded.
The volume of meat production is estimated from the number of all livestock slaughtered and average dressed carcase weight information collected. This total ‘Home killed’ production includes livestock imported into the United Kingdom for slaughter.
With effect from February 2016 the statistics published in this notice are based on calendar rather than statistical months. This change simplifies our survey processes and brings our slaughter survey in line with our milk surveys which are already run on a calendar month basis; it also removes the need for the 53 week year (which would have to be 2016). Since the end of weekly slaughter survey several years ago, there is no legislative requirement for weekly data, so since then we have derived the average weekly throughput from the monthly survey data.
The January 2016 data will include the last week of December 2015 and therefore be classed as a 5 week month. From 1st February 2016 onwards the statistics are based on calendar months.
We have carried out a review of the methodology for calculating the dressed carcase weights in order to align with UK specifications. Some slaughterhouses provide Cattle Dressed Carcase Weights (DCW) including Kidney Knob and Channel Fat (KKCF); some slaughterhouses provide pig weights at EC specification. From September 2019 cattle DCWs are calculated to UK specification which excludes KKCF; Pigs are dressed to UK specification.
To calculate the DCW of animals by category:
- If the slaughterhouse includes KKCF in the total weight, a deduction of 3.9% occurs. This aligns to the UK DCW specification.
- If pigs are dressed to EC specification then an increase of 1.6% to the DCW occurs to align with UK specification.
- Link to pig carcase grade scheme webpage
Some slaughterhouses specialise for niche markets. These slaughterhouses are treated separately so their DCW are not used to raise the data for those slaughterhouses who do not provide DCW data.
Data have been revised to January 2018 using the new methodology. If you have any questions or comments, please contact us at livestock.statistics@defra.gov.uk
5.2 Revisions
5.2.1 Revision – April 2023
From April 2023 we have revised our livestock numbers across all categories from January 2021 to March 2023. The updated figures have been included in the accompanying dataset.
This revision is due to an issue identified in our previous methodology for calculating slaughter numbers. Due to the method of processing the monthly figures, subsequent updates to the slaughter numbers from the Food Standards Agency were not captured and there was underestimation of slaughter numbers in some categories. We have revised the data from January 2021 to March 2023 to capture these updated figures. Further we have revised our livestock categories ratios based on previous year’s survey data for data accuracy purposes.
Due to the change in methodology comparisons with previous years will not be possible.
If you have any questions or comments, please contact us at livestock.statistics@defra.gov.uk
5.2.2 Revision Policy
Figures in this notice are provisional and subject to revision. We will provide information about any revisions we make to previously published information in this statistics notice and the associated datasets. Revisions could occur for various reasons, including:
-
if we have not received survey data from respondents we make an estimate based on their previous returns. These estimates will be replaced with actual survey data when it is received.
-
survey respondents occasionally supply amended figures for previous periods.
-
FSA administrative data can be revised up to two months after production. We will include any revised administrative data in the subsequent publication releases.
5.3 Data users
The livestock industry is a major user of the data, including divisions of the Agriculture and Horticulture Development Board (AHDB). AHDB Pork (formally known as BPEX, representing the English pig industry) and AHDB Beef and Lamb (formerly EBLEX, representing the English beef and sheep industry). Industry users rely heavily on the numbers of slaughterings and meat production to assess the current state of the industry and predict the available supplies of meat for the coming year. This, in turn, can affect meat prices and trade decisions on levels of imports and exports to maintain supply. Users have always been very keen for the slaughtering statistics to be produced as quickly as possible so that the data is still relevant. For this reason, we collect and publish these statistics to a very tight timetable, publishing within three weeks of the survey date. The “Market Intelligence” and “Market Outlook” Reports on the AHDB Beef and Lamb website refer consistently to our statistics at the AHDB Beef and lamb webpage The AHDB Pork site provides more in-depth analysis of pigmeat production statistics at the AHDB pigmeat production webpage.
6. Definitions
-
Steers (or Bullocks): Castrated males over 1 year old, raised for beef.
-
Heifers: Female animals that have not calved. Over 1 year old, raised for beef.
-
Young bulls: Non-castrated young males, raised for beef, generally slaughtered around 13 months old.
-
Prime cattle: All those raised specifically for beef production. Total of Steers + Heifers + Young Bulls.
-
Breeding bulls: Older cull males, previously used for breeding
-
Cows: Older cull females, previously used for breeding
-
Calves: All bovine animals aged 1 year old or younger. Prior to May 2014, the definition was “animals weighing less than 165kg”.
7. National Statistics status
National Statistics are produced to high professional standards. They undergo regular quality assurance reviews to ensure that they meet customer needs. They are produced free from any political interference.
The continued designation of these statistics as National Statistics was confirmed in 2014 following a compliance check by the UK Statistics Authority (now the Office for Statistics Regulation) against the Code of Practice for Statistics.
Since the last review of these statistics in 2014, we have continued to comply with the Code of Practice for Statistics, and have made improvements including: - Providing a detailed breakdown of livestock categories following user feedback - Improved the data quality by updating guidance for data providers and carrying out enhanced validation checks on data received
For general enquiries about National Statistics, contact the National Statistics Public Enquiry Service:
Tel: 0845 601 3034 Email: info@statistics.gov.uk.
You can find National Statistics on the internet at the UK government statistics webpage.
8. Future publications
This notice will be updated at 09:30 on Thursday 13th July 2023. Additional time series which include weekly slaughter averages, production and trade data can be found at the the UK government livestock statistics web page.
Enquiries to: Livestock statistics team, Tel: +44 (0) 208 026 6306
Email: julie.rumsey@defra.gov.uk
Defra, Rm 201,
Foss House,
Kings Pool,
1-2 Peasholme Green,
York,
YO1 7PX