England's Material Footprint
Updated 9 August 2023
Applies to England

© Crown copyright 2023
This publication is licensed under the terms of the Open Government Licence v3.0 except where otherwise stated. To view this licence, visit nationalarchives.gov.uk/doc/open-government-licence/version/3 or write to the Information Policy Team, The National Archives, Kew, London TW9 4DU, or email: psi@nationalarchives.gov.uk.
Where we have identified any third party copyright information you will need to obtain permission from the copyright holders concerned.
This publication is available at https://www.gov.uk/government/statistics/englands-material-footprint/englands-material-footprint
1. Key messages
-
The ‘material footprint’ is a measure of the global primary raw material extraction attributable to final domestic demand for goods and services by the residents of an institutional unit, typically a nation.
-
In 2020, England’s material footprint was an estimated 783 million tonnes, accounting for 84% of the UK’s material footprint.
-
The material footprint was over a third (35%) lower in 2020 than in 2004, when at its highest in the series.
-
Non-metallic minerals made up over half (55%) of England’s material footprint in 2020 and biomass made up around a quarter (24%).
-
In 2020, England’s material footprint was primarily associated with household consumption (47%), followed by gross fixed capital formation (31%) and expenditure on government services (20%).
-
Between 2001 and 2020, the majority of global material extraction driven by final domestic demand in England occurred outside of the UK. Reliance on overseas extraction in the footprint varied by type of material.
2. Overview
Data on material flows in the UK are compiled in the national Material Flow Accounts. These track primary raw material extraction within domestic boundaries, in addition to headline indicators adjusted for the raw materials and products physically crossing national borders.
Demand or consumption-based accounting involves reallocating environmental pressures or change linked to the production of goods and services, to sources of final demand rather than location of associated extraction, emission, or occurrence. This can be done through the use of an environmentally-extended multiregional input-output database, which combines monetary data on inter-industry and final demand flows (as recorded in national supply and use tables) alongside data on physical environmental flows or changes for the same period and across multiple regions.
By covering whole economies in a systematic way, multiregional input-output analysis ensures material inputs along entire supply chains and in re-imported products are more accurately quantified.
Demand-based accounting can be applied to a range of environmental phenomena, including, but not limited to, greenhouse gas emissions (such as statistics on the UK and England’s carbon footprint), material extraction and deforestation.
The ‘material footprint’ or raw material consumption, is the allocation of global primary raw material extraction to final domestic demand for goods and services by a country’s residents. It captures the full upstream raw material inputs entering often complex and international supply chains for the goods and services we consume.[footnote 1]
The figures presented here have been produced using a methodology developed by the University of Leeds on behalf of Defra that builds on a similar approach for estimating the carbon footprint of the UK and England. To derive England-level estimates, UK-level household material footprint data has been apportioned to final demand within England using statistics on household expenditure. The non-household categories of raw material consumption have been apportioned using population shares.
Final domestic demand measures consumption by resident households in a country, in addition to expenditure by those households on goods and services provided by government and non-profit institutions, investment in the form of gross fixed capital formation[footnote 2] and changes in inventories and valuables. Raw material consumption excludes ‘hidden flows’ or materials displaced at the stage of extraction, but which do not actually enter production processes, such as overburden from mining operations.
3. Footprint by material group
In 2020 (the most recent year for which estimates are available), England’s material footprint was an estimated 783 million tonnes or 84% of the UK’s material footprint. The proportion has been relatively consistent between 2001 and 2020.
There has been a general decrease in England’s material footprint since 2001 when it stood at 922 million tonnes. Per capita, the material footprint in England was 13.8 tonnes in 2020, down from 18.7 tonnes in 2001.
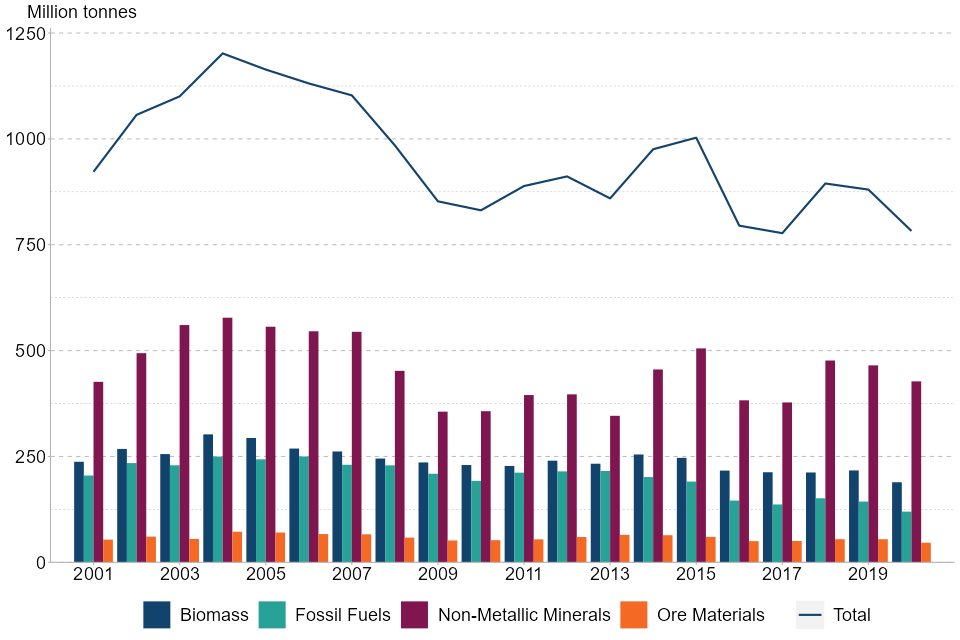
Figure 1 shows the change over time of raw material consumption in England between 2001 and 2020 by different material groups .
As shown in Figure 1, following an initial increase between 2001 and 2004, England’s material footprint peaked at 1,202 million tonnes in 2004. The material footprint fell year-on-year until 2012, with a steep decline between 2007 and 2009 during the economic recession. In more recent years, England’s material footprint rose to 1,003 million tonnes in 2015 before falling again to 783 million tonnes in 2020.
Figure 1: Trends in annual raw material consumption, total and by material group, England, 2001-2020, million tonnes
Download the data for this figure
In 2020, non-metallic minerals such as sand and gravel made up the majority of England’s material footprint (55%, or 427 million tonnes), while biomass materials such as crops and wood comprised a quarter (24%, or 189 million tonnes).
In absolute terms, non-metallic minerals in the footprint fell by over a third (37%) between 2004, when at their highest in the series, and 2020. Levels of non-metallic minerals in the footprint were nevertheless far higher in 2020 (427 million tonnes) than in 2013, when at their lowest level in the series (346 million tonnes). Consumption of non-metallic minerals, much of which are used for construction purposes, are closely tied to fluctuations in the economy. Biomass consumption is less variable, having changed relatively little in absolute terms between 2001 and 2020.
In 2020, fossil fuels made up just 15% of England’s material footprint, down from 22% in 2001. This is due to the fossil fuel footprint having fallen by 42% in absolute terms between 2001 and 2020. Ore materials constituted the smallest category of materials in the footprint by mass, comprising 6% in 2020. This was a fairly consistent proportion between 2001 and 2020, with ores in the material footprint having fallen from 54 million tonnes to 46 million tonnes across the period, in line with levels of reduction seen in the total footprint more generally.
Please see the accompanying dataset for a more detailed breakdown of the material footprint by material group.
4. Footprint by end use
The material footprint can be broken down by the sources of final demand and product groups which drive it.
In 2020, almost half (47%) of England’s material footprint, or 367 million tonnes, was associated with expenditure by resident households on goods and services to meet their everyday needs.[footnote 3] In the same year, 31%, or 243 million tonnes was attributable to gross fixed capital formation (or investment in produced fixed assets). Around 20%, or 156 million tonnes was associated with government consumption expenditure. The costs of providing goods and services by non-profit institutions, changes in inventories and valuables, together contributed to 2% of the material footprint in 2020.
The share of the total footprint contributed by each category of final demand remained relatively constant between 2001 and 2020.
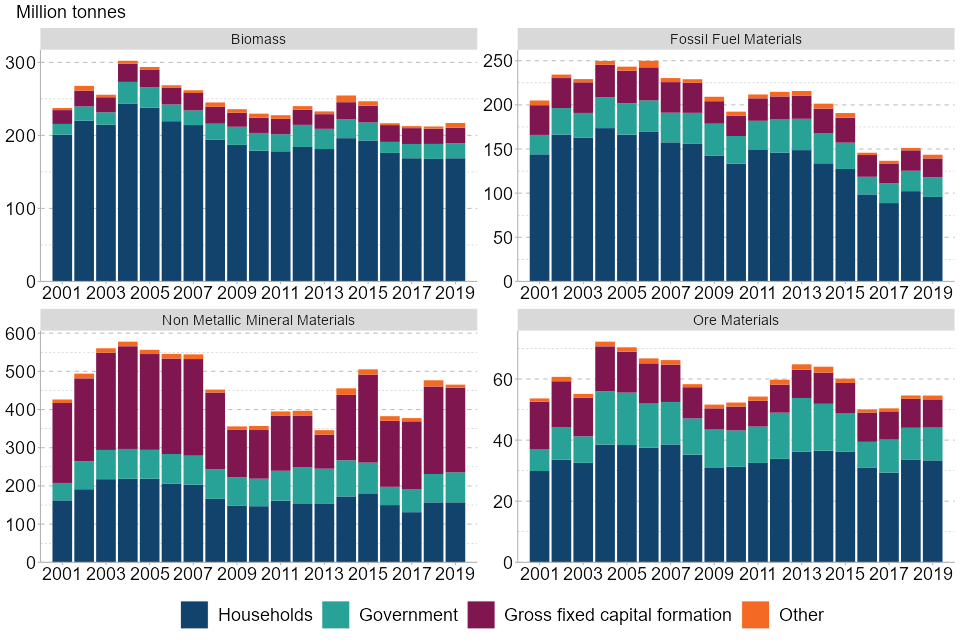
The contribution of household consumption to England’s material footprint varied by material type; in 2020, 76% of the biomass extraction and harvesting was due to households, whilst households comprised only 30% of the extraction of non-metallic minerals.
Figure 2 presents change over time in the sources of domestic final demand, or end use, which contribute to each material within the footprint.
Figure 2: Trends in annual raw material consumption by material group, split by end use, England, 2001-2020, million tonnes (1)(2)
Download the data for this figure
Notes - Figure 2
- Other includes non-profit institutions serving households, change in inventories and valuables.
- Please note that in this figure, the vertical axis varies for each chart to aid visualisation.
Household expenditure can be classified by function according to the United Nations Classification of Individual Consumption by Purpose (COICOP).
Table 1 presents the share of annual raw material consumption associated with household consumption using the COICOP classification in 2001 and 2020.
Using this classification, food and non-alcoholic beverages made up the largest share of material extraction associated with household consumption in England in 2020 (29%). This was largely biomass materials. Transportation was the second most significant household consumption category contributing to the material footprint in 2020, comprising around a sixth of the footprint (15%). Housing and power accounted for around 13% of household consumption. Goods and services captured under the category of recreation, culture and communication (including, for instance, information processing equipment), made up a similar proportion.
Consumption of these four product groups together were responsible for around 70% of the material footprint associated with household consumption in England in 2020.
Goods and services associated with hotels and restaurants comprised 16% of the household raw material consumption in 2001, declining the most of all product groups to 11% in 2020. This decline was, to a large extent, due to the drop in fossil fuels within the footprint across this period. Goods and services associated with food and beverages comprised 24% of the household raw material consumption in 2001, increasing the most of all product groups to 29% in 2020.
Table 1: Change in the share of annual raw material consumption associated with household consumption across product categories, England, 2001 and 2020, %
| Category | 2001 | 2020 |
|---|---|---|
| Food and beverages (1) | 24% | 29% |
| Transportation | 15% | 15% |
| Recreation, Culture & Communication | 12% | 13% |
| Furnishing, appliances | 7% | 6% |
| Housing & power | 15% | 13% |
| Hotels & restaurants | 16% | 11% |
| Clothing & footwear | 2% | 2% |
| Other consumption (2) | 8% | 11% |
Notes - Table 1
- This encompasses food, non-alcoholic drinks and alcoholic beverages.
- Other Consumption encompasses tobacco, health, education and miscellaneous goods and services.
Please see the accompanying dataset for a more detailed breakdown by product group of the material footprint associated with household consumption in England.[footnote 4]
5. Footprint by source region
Estimates of England’s material footprint by source region have been produced using a model with a 15 country and world region disaggregation. UK-level material footprint data (stretching back further than is available for England), indicates overseas extraction has made up an increasing share of the UK’s material footprint since the 1990s.
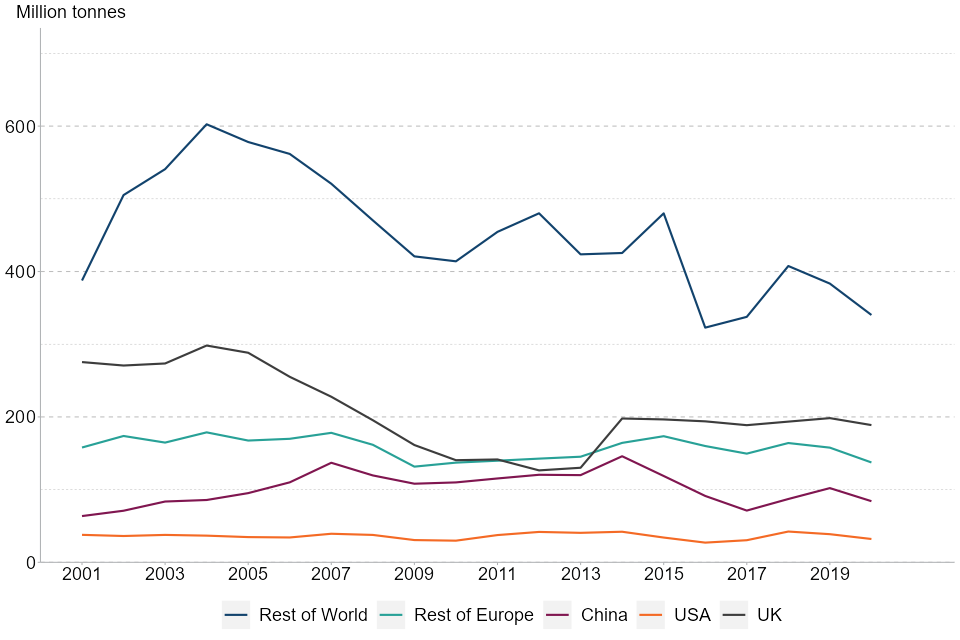
Figure 3 presents the change over time of raw material consumption in England between 2001 and 2020 by different source regions .
Figure 3: Trends in annual raw material consumption by select source regions, England, 2001-2020, million tonnes
Download the data for this figure
In 2020, the largest contributor to England’s material footprint was the Rest of the World, accounting for 340 million tonnes or 43% of material extraction. The second largest contributor to England’s material footprint in 2020 was UK domestic extraction, accounting for 189 million tonnes or 24% of material extraction, down from 30% in 2001. The Rest of Europe was the next greatest contributing source region to England’s material footprint in 2020, at 18% or 137 million tonnes. China was the fourth largest contributing source region to England’s material footprint in 2020, at 11% or 84 million tonnes, up from 7% in 2001.
The contributions to England’s material footprint from material extraction in South Africa and Russia (within the Rest of the World grouping) fell significantly between 2001 and 2020, by 78% and 57%, respectively. This was driven, to a large extent, by a reduction in fossil fuels in the footprint. The contributions to England’s material footprint from material extraction in India (within the Rest of the World grouping) rose significantly between 2001 and 2020, (by 104%) and now constitutes 25% of the Rest of the World contribution. This rise is driven by a rise in non-metallic minerals.
The most significant source regions contributing to England’s footprint varied by material type. In 2020, 35% of England’s biomass footprint or 67 million tonnes, was sourced from within the UK (the highest share across all material categories), while 21% or 41 million tonnes occurred within the Rest of Europe. Though the UK has a long history of ore extraction, it is estimated that less than 1% of England’s ore material footprint came from domestic sources across the available time series.
Please see the accompanying dataset for a more detailed break down of the material footprint by source country and region.
6. What you need to know about this release
6.1 Contact details
Responsible statistician: Adele Storr
Email: EnviroStatistics@Defra.gov.uk
Media enquiries: 0330 041 6560 (Defra Press Office) or refer to Defra’s media enquiries page.
6.2 Official Statistics
This is an Official Statistics publication. These statistics have been produced to the high professional standards set out in the Code of Practice for Official Statistics, which sets out eight principles including meeting user needs, impartiality and objectivity, integrity, sound methods and assured quality, frankness and accessibility. For more information, please see the Official Statistics Code of Practice.
6.3 Feedback
We welcome feedback on the data from all users including how and why the data is used. This helps us to understand the value of the statistics to external users. Please see our contact details section of this notice.
7. Glossary
Classification of Individual Consumption by Purpose (COICOP): A United Nations developed classification for categorising household expenditure by function or purpose.
Final domestic demand: The expenditure on goods and services by resident units of a country in an accounting period. The sum of final consumption, gross fixed capital formation and stock building expenditures by the private and general government sectors.
Gross fixed capital formation: Purchases of material and intangible fixed assets in an economy in an accounting period. Largely made up of investment in the business sector such as in machinery and equipment. Purchases of dwellings by households are also captured here, as is general government expenditure on infrastructure and other forms of fixed assets.
Material flow accounts: A collection of statistics showing how the environment contributes to an economy via physical flows of materials. Such accounts are compiled at a country-level as part of wider Environmental Accounts and typically in accordance with the United Nations System of Environmental-Economic Accounting.
Primary raw materials: First-use materials extracted or harvested from the environment, as distinct from secondary raw materials made available through recycling processes within the economy.
Raw material consumption: Alternatively ‘material footprint’. The allocation of global primary raw material extraction to final domestic demand for goods and services by a country’s residents. A key benefit of this indicator is that it measures domestic extraction and overseas raw material extraction along supply chains to produce imported goods and services on an equal basis. The material footprint includes biomass materials harvested from, or cultivated within, ecosystems, including crops, wood and wild fish catch. The footprint also encompasses mineral resources (both metallic ores e.g. iron, as well as non-metallic minerals such as limestone, clay or sand), in addition to fossil fuels such as oil and gas. It does not include other types of resources such as water or air.
Supply and use tables: Tables capturing in monetary units, relationships between components of value added, industry inputs and outputs and product supply and demand in an economy. A source of the data underpinning the calculation of gross domestic product as well as the material footprint.
-
Raw material consumption is broader than the material flow indicator ‘domestic material consumption’, which sums the used fraction of domestically extracted and harvested materials, in addition to the mass of imported raw materials, semi-finished and manufactured products, while excluding those exported. This is because domestic material consumption measures traded components of material flows in terms of the mass of goods actually crossing borders rather than, as raw material consumption does, also accounting for the upstream raw materials required to produce those products. ↩
-
Assets intended for use in the production of other goods and services for a period of more than one year e.g. machinery and buildings. Purchases of dwellings by households are also captured here. ↩
-
Due to accounting conventions, the purchases of dwellings by households are included in gross fixed capital formation rather than as part of household consumption. ↩
-
It is important to note that for some COICOP categories such as education or healthcare, only the portion of these services directly paid for by households are captured under household expenditure. The actual consumption and associated material footprint of these functions is larger, but partly captured under individual-consumption-related government expenditure. ↩