Overview of assessment of change for all indicators and their component measures
Updated 3 April 2024
Applies to England

© Crown copyright 2024
This publication is licensed under the terms of the Open Government Licence v3.0 except where otherwise stated. To view this licence, visit nationalarchives.gov.uk/doc/open-government-licence/version/3 or write to the Information Policy Team, The National Archives, Kew, London TW9 4DU, or email: psi@nationalarchives.gov.uk.
Where we have identified any third party copyright information you will need to obtain permission from the copyright holders concerned.
This publication is available at https://www.gov.uk/government/statistics/england-biodiversity-indicators/overview-of-assessment-of-change-for-all-indicators-and-their-component-measures--2
1. Assessment of change: all measures
There are 51 individual measures that make up 24 indicators, of those measures, 42 are suitable for assessment.
In the long term:
- 20 measures (39%) show an improvement
- 5 measures (10%) show little or no overall change and
- 14 measures (27%) show a deterioration.
There are insufficient data to make long-term assessments for 3 measures (6%), and 9 measures (18%) are not assessed.
In the short term:
- 11 measures (22%) show an improvement
- 9 measures (18%) show little or no overall change and
- 17 measures (33%) show a deterioration.
There are insufficient data to make short-term assessments for 3 measures (6%), and 11 measures (22%) are not assessed.
Tables 1 to 4 at the bottom of this page show the assessment results of all the measures across 4 strategic themes. Figure 1 summarises the results for all measures, Figures 2 to 4 break the results down by theme.
Figure 1. Number of long-term and short-term indicator assessments by direction of change, all measures and strategy themes
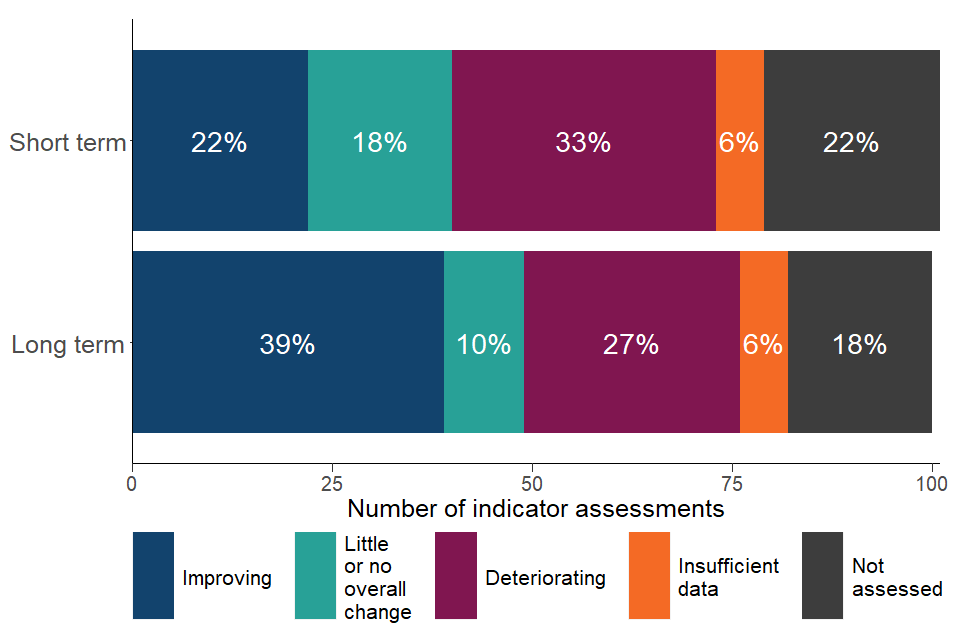
Note: Based on 51 measures, which make up 24 indicators.
2. Strategy theme 1 – A more integrated, large scale approach to conservation on land and at sea
Table 1 shows the assessment results for the indicators in this theme, Figure 2 summarises these results visually.
Over the long term, 9 measures have improved, of these:
- 4 continue to improve in the short term:
- Extent of protected areas - Extent of protected areas at sea
- Species in the wider countryside: farmland - Bat populations on farmland
- Biodiversity and ecosystem services: terrestrial - Removal of greenhouse gases by UK forests
- Genetic resources for food and agriculture: plant genetic resources - Cumulative Enrichment Index
- 3 are declining in the short term:
- Species in the wider countryside: wetlands - Wintering water birds
- Genetic resources for food and agriculture: animal genetic resources - effective population size of native breeds at risk in the UK - Effective population size of native sheep breeds at risk
- Genetic resources for food and agriculture: animal genetic resources - effective population size of native breeds at risk in the UK - Effective population size of native cattle breeds at risk
- 2 show little or no overall change.
Of the 11 measures deteriorating in the long term:
- 8 also deteriorated over the short term:
- Status of threatened habitats: habitats of European importance - Percentage of habitats of European importance in favourable or improving conservation status
- Status of priority species: distribution - Change in status of priority species - distribution
- Status of threatened species: species of European importance - Percentage of species of European importance in favourable or improving conservation status
- Species in the wider countryside: farmland - Breeding birds on farmland
- Species in the wider countryside: woodland - Breeding birds in woodland
- Biodiversity and ecosystem services: marine - and benefit Fish size in the North-western North Sea
- Genetic resources for food and agriculture: animal genetic resources - effective population size of native breeds at risk in the UK - Effective population size of native pig breeds at risk
- Genetic resources for food and agriculture: animal genetic resources - effective population size of native breeds at risk in the UK - Effective population size of native horse breeds at risk
- none were improving in the short term
- 3 showed little or no overall change.
Figure 2. Strategy theme 1. Number of long-term and short-term indicator assessments by direction of change.
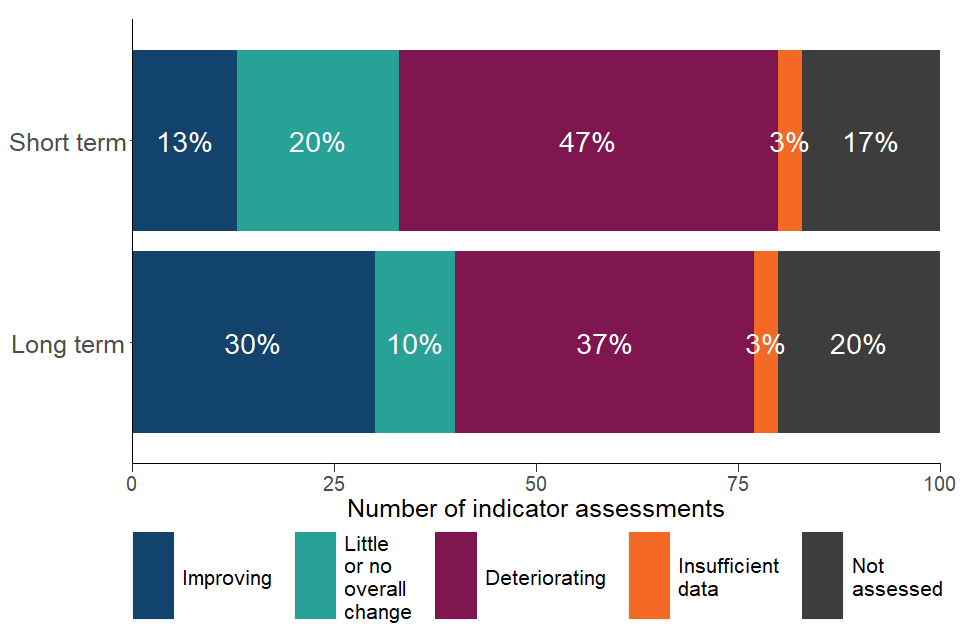
Note: Based on 30 measures, which make up 12 indicators.
3. Strategy theme 2 – Putting people at the heart of biodiversity policy
Table 2 shows the assessment results for the indicators in this theme, Figure 3 summarises these results.
4 measures in this theme show long-term improvement, of which:
- 2 have also improved in the short term:
- Funding for biodiversity - Public sector expenditure on biodiversity in England
-
Funding for biodiversity - NGO expenditure on biodiversity in England
- 2 have deteriorated in the short term:
- Taking action for the natural environment - Time spent in environmental volunteering
-
Integrating biodiversity considerations into local decision making - Local sites under positive management
- There was insufficient data for either a long term or short term assessment for 2 indicators.
Figure 3. Strategy theme 2. Number of long-term and short-term indicator assessments by direction of change.
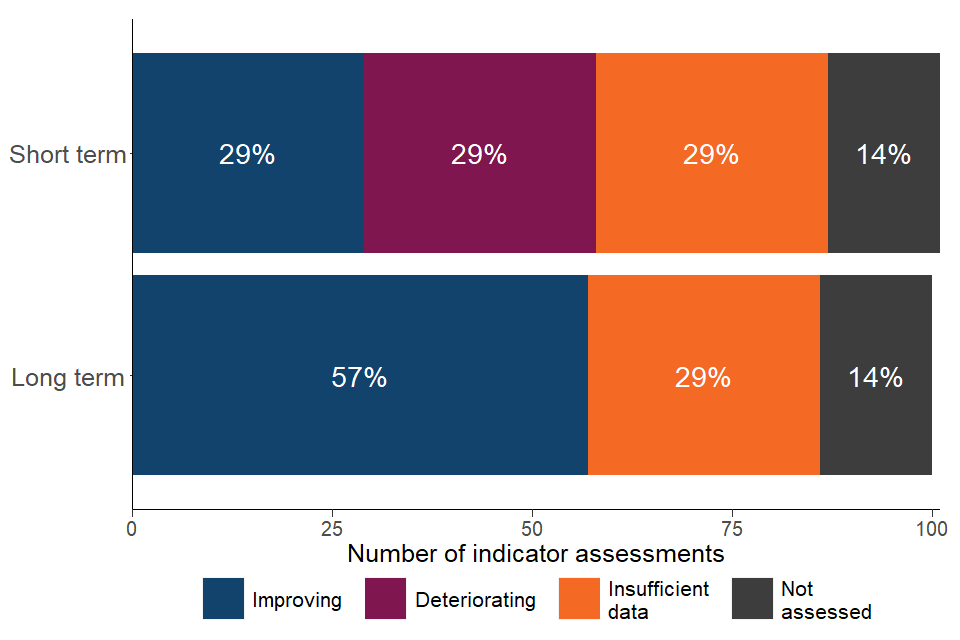
Note: Based on 7 measures which make up 5 indicators.
4. Strategy theme 3 – Reducing environmental pressures
Table 3 shows the assessment results for the indicators in this theme, Figure 4 summarises these results.
5 measures have improved in the long-term, of these:
- 4 have improved in the short term
- Trends in pressures on biodiversity: pollution - Air pollution impacts on sensitive habitats: area affected by acidity
- Trends in pressures on biodiversity: pollution - Marine pollution: combined input of hazardous substances
- Agricultural and forest area under environmental management schemes - Targeted agri-environment schemes
-
Sustainable fisheries: fish stocks harvested within safe limits - Fish stocks harvested within safe limits
- One measure has shown little or no change over the short term.
3 measures have deteriorated in the long-term, it is not possible to assess these measures in the short term, these measures all relate to pressure from invasive species.
There was insufficient data to perform either a long term or short term assessment for 1 indicator.
Figure 4. Strategy theme 3. Number of long-term and short-term indicator assessments by direction of change.
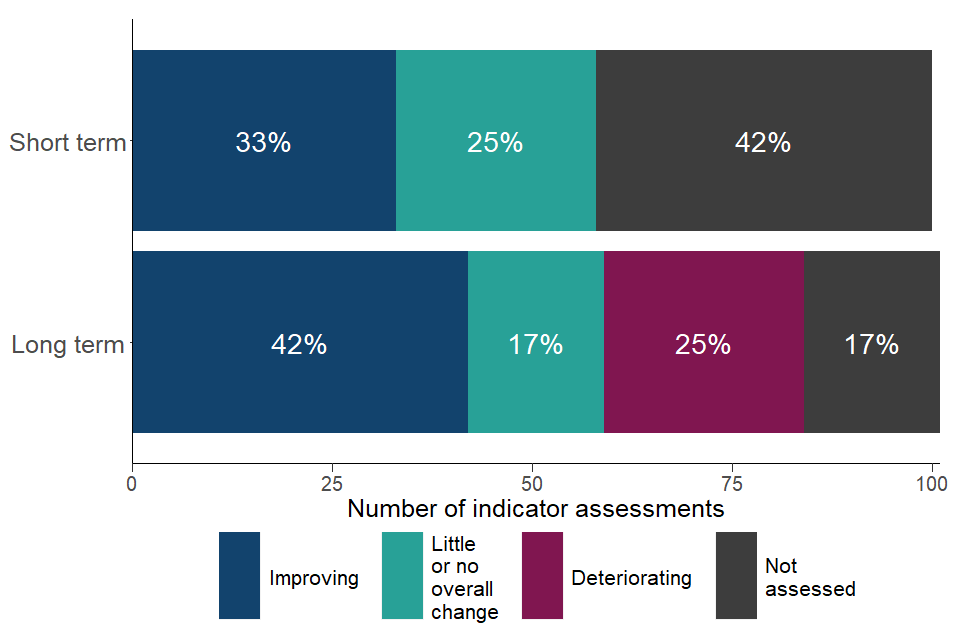
Note: Based on 12 measures which make up 6 indicators.
5. Strategy theme 4 – Improving knowledge
This theme only has one indicator (with 2 measures), so no chart is provided, Table 4 shows the assessment results for this indicator. The cumulative number of records in the National Biodiversity Network and the number of publicly accessible records at 1 square kilometre resolution or better, have both improved over the long term, the cumulative records in the National Biodiversity Network improved in the short term and the number of publicly accessible records at 1 square kilometre resolution or better deteriorated in the short term.
6. Assessment results tables
Table 1. Theme 1: A more integrated, large-scale approach to conservation on land and at sea – assessment results
| Indicator | Measure | Long term period | Long term | Short term period | Short term |
|---|---|---|---|---|---|
| 1a Extent of protected areas | Extent of protected areas on land | 2005 to 2023 | Improving | 2018 to 2023 | Little or no overall change |
| 1a Extent of protected areas | Extent of protected areas at sea | 2005 to 2023 | Improving | 2018 to 2023 | Improving |
| 1b Condition of Sites of Special Scientific Interest | Sites of Special Scientific Interest in favourable or unfavourable recovering condition | Not assessed | 2018 to 2023 | Deteriorating | |
| 2a Status of threatened habitats | Extent of priority habitats | Insufficient data | Insufficient data | ||
| 2a Status of threatened habitats | Condition of priority habitats | 2011 to 2021 | Improving | 2016 to 2021 | Little or no overall change |
| 2b Status of threatened habitats habitats of European importance | Percentage of habitats of European importance in favourable or improving conservation status | 2007 to 2019 | Deteriorating | 2013 to 2019 | Deteriorating |
| 3 Habitat connectivity in the wider countryside | Experimental statistic on functional connectivity in the UK | Not assessed | Not assessed | ||
| 4a Status of priority species relative abundance | Change in relative abundance of priority species | 1970 to 2021 | Deteriorating | 2016 to 2021 | Little or no overall change |
| 4b Status of priority species distribution | Change in distribution of priority species | 1970 to 2016 | Deteriorating | 2011 to 2016 | Deteriorating |
| 4c Status of threatened species species of European importance | Percentage of species of European importance in favourable or improving conservation status | 2007 to 2019 | Deteriorating | 2013 to 2019 | Deteriorating |
| 5a Species in the wider countryside farmland | Breeding birds on farmland | 1970 to 2021 | Deteriorating | 2016 to 2021 | Deteriorating |
| 5a Species in the wider countryside farmland | Butterflies of the wider countryside on farmland | 1990 to 2022 | Little or no overall change | 2017 to 2022 | Little or no overall change |
| 5a Species in the wider countryside farmland | Bat populations | 1999 to 2020 | Improving | 2015 to 2020 | Improving |
| 5b Species in the wider countryside farmland | Experimental statistic on abundance of farmland plant species | Not assessed | Not assessed | ||
| 6a Species in the wider countryside woodland | Breeding birds in woodland | 1970 to 2021 | Deteriorating | 2016 to 2021 | Deteriorating |
| 6a Species in the wider countryside woodland | Butterflies of the wider countryside in woodland | 1990 to 2022 | Deteriorating | 2017 to 2022 | Little or no overall change |
| 6b Species in the wider countryside woodland | Experimental statistic on abundance of woodland plant species | Not assessed | Not assessed | ||
| 7a Species in the wider countryside wetlands | Breeding wetland birds | 1975 to 2021 | Little or no overall change | 2016 to 2021 | Deteriorating |
| 7a Species in the wider countryside wetlands | Wintering waterbirds | 1975/1976 to 2020/2021 | Improving | 2015/2016 to 2020/2021 | Deteriorating |
| 7b Species in the wider countryside wetlands | Experimental statistic on abundance of wetlands plant species | Not assessed | Not assessed | ||
| 8 Species in the wider marine environment | Breeding seabirds | Not assessed | Not assessed | ||
| 9 Biodiversity and ecosystem services terrestrial | Cumulative net removal of greenhouse gases by forests | 1990 to 2021 | Improving | 2016 to 2021 | Improving |
| 10 Biodiversity and ecosystem services pollination | Distribution of pollinating insects in the UK | 1980 to 2022 | Deteriorating | 2017 to 2022 | Little or no overall change |
| 11 Biodiversity and ecosystem services marine | Fish size in the Northwestern North Sea | 1983 to 2020 | Deteriorating | 2015 to 2020 | Deteriorating |
| 12a Animal genetic resources | Goat breeds | 2004 to 2022 | Little or no overall change | 2017 to 2022 | Deteriorating |
| 12a Animal genetic resources | Pig breeds | 2000 to 2022 | Deteriorating | 2017 to 2022 | Deteriorating |
| 12a Animal genetic resources | Horse breeds | 2000 to 2022 | Deteriorating | 2017 to 2022 | Deteriorating |
| 12a Animal genetic resources | Sheep breeds | 2000 to 2022 | Improving | 2017 to 2022 | Deteriorating |
| 12a Animal genetic resources | Cattle breeds | 2000 to 2022 | Improving | 2017 to 2022 | Deteriorating |
| 12b Plant genetic resources | UK Cumulative Enrichment Index | 1960 to 2018 | Improving | 2013 to 2018 | Improving |
Table 2. Theme 2: Putting people at the heart of biodiversity policy – assessment results
| Indicator | Measure | Long term period | Long term | Short term period | Short term |
|---|---|---|---|---|---|
| 13 Public awareness understanding and support for conservation | Proportion of people highly engaged with the issue of biodiversity loss | Insufficient data | Insufficient data | ||
| 14a Taking action for the natural environment | Conservation volunteering | 2000 to 2021 | Improving | 2016 to 2021 | Deteriorating |
| 14b Taking action for the natural environment | Wildlife gardening | Insufficient data | Insufficient data | ||
| 15 Funding for biodiversity | Public sector expenditure on biodiversity in England | 2000/2001 to 2021/2022 | Improving | 2016/2017 to 2021/2022 | Improving |
| 15 Funding for biodiversity | Nongovernmental organisation expenditure on biodiversity in the UK | 2010/2011 to 2021/2022 | Improving | 2016/2017 to 2021/2022 | Improving |
| 16 Integrating biodiversity considerations into local decision making | Local sites under positive conservation management | 2008/2009 to 2021/2022 | Improving | 2016/2017 to 2021/2022 | Deteriorating |
| 17 Global biodiversity impacts of UK consumption | Area of tropical deforestation associated with UK consumption | Not assessed | Not assessed |
Table 3. Theme 3: Reducing environmental pressures – assessment results
| Indicator | Measure | Long term period | Long term | Short term period | Short term |
|---|---|---|---|---|---|
| 18 Climate change impacts | Timing of biological events Spring Index | Not assessed | Not assessed | ||
| 19a Pressures on biodiversity pollution | Air pollution area affected by acidity | 2003 to 2020 | Improving | 2015 to 2020 | Improving |
| 19a Pressures on biodiversity pollution | Air pollution area affected by nutrient nitrogen deposition | 2003 to 2020 | Little or no overall change | 2015 to 2020 | Little or no overall change |
| 19b Pressures on biodiversity pollution | Marine pollution combined input of hazardous substances into the UK marine environment | 1990 to 2019 | Improving | 2014 to 2019 | Improving |
| 20 Pressures on biodiversity invasive species | Terrestrial species | 1969 to 2022 | Deteriorating | Not assessed | |
| 20 Pressures on biodiversity invasive species | Freshwater species | 1969 to 2022 | Deteriorating | Not assessed | |
| 20 Pressures on biodiversity invasive species | Marine coastal species | 1969 to 2022 | Deteriorating | Not assessed | |
| 21 Trends in pressures on biodiversity surface water body status | Percentage of surface water bodies in High or Good ecological status | Not assessed | Not assessed | ||
| 22a Agricultural and forest area in environmental management schemes | Area of land under higherlevel or targeted agrienvironment schemes | 1987 to 2022 | Improving | 2017 to 2022 | Improving |
| 22b Agricultural and forest area in environmental management schemes | Percentage of woodland certified as sustainably managed | 2001 to 2023 | Little or no overall change | 2018 to 2023 | Little or no overall change |
| 23a Sustainable fisheries fish stocks harvested within safe limits | Percentage of UK fish stocks harvested sustainably | 1990 to 2020 | Improving | 2015 to 2020 | Improving |
| 23b Sustainable fisheries fish stocks harvested within safe limits | Percentage of UK fish stocks with biomass at full reproductive capacity | 1990 to 2020 | Improving | 2015 to 2020 | Little or no overall change |
Table 4. Theme 4: Improving knowledge - assessment results
| Indicator | Measure | Long term period | Long term | Short term period | Short term |
|---|---|---|---|---|---|
| 24 Biodiversity data for decision making | Cumulative number of records in the National Biodiversity Network | 2004 to 2023 | Improving | 2018 to 2023 | Improving |
| 24 Biodiversity data for decision making | Number of publicly accessible records at 1 square kilometre resolution or better | 2008 to 2023 | Improving | 2018 to 2023 | Deteriorating |