10 Status of pollinating insects
Updated 3 April 2024
Applies to England

© Crown copyright 2024
This publication is licensed under the terms of the Open Government Licence v3.0 except where otherwise stated. To view this licence, visit nationalarchives.gov.uk/doc/open-government-licence/version/3 or write to the Information Policy Team, The National Archives, Kew, London TW9 4DU, or email: psi@nationalarchives.gov.uk.
Where we have identified any third party copyright information you will need to obtain permission from the copyright holders concerned.
This publication is available at https://www.gov.uk/government/statistics/england-biodiversity-indicators/10-status-of-pollinating-insects--2
Data last updated: November 2023
Latest data available: 2022
Introduction
This indicator indicates changes in pollinator distribution (bees and hoverflies) in the UK. The indicator is based on 394 species (158 species of bee and 236 species of hoverfly), and measures change in the number of 1 km grid squares across the UK in which they were recorded in any given year: this is referred to as the ‘occupancy index’. Many insect species are involved in pollination but bees and hoverflies are known to be important and are presented here as an indicator of overall pollinator trend.
Type of indicator
State/Benefit indicator
Assessment of Change in the distribution of pollinators in the UK
- Long term (1980 to 2022): Deteriorating
- Short term (2017 to 2022): Little or no overall change
- Latest year (2021 to 2022): No change
Notes about the indicator assessment:
Analysis of the underlying trends is carried out by the data providers. See document on Assessing Indicators.
Distribution of pollinators in the UK
Trend description for Figure 10.1
The headline indicator for all pollinators, the index for hoverflies and the index for wild bees have all been updated since the 2022 publication with the time series extending to 2022. Since the 2022 publication, all indicators have been produced with a new methodology. New methods were used to select species based on the suitability of the underlying data for producing occupancy trends with acceptable precision, and a novel statistical approach for combining species trends into an indicator was applied (Freeman et al. 2020). These changes have caused the uncertainty estimation around the index to be smaller, and for the historic decline to be less severe. See the background section and the technical background document for further detail on the production of this indicator.
There was an overall decrease in the pollinator indicator from 1987 onwards. In 2022, the indicator showed a decrease of 24% compared to its value in 1980. The long-term trend was assessed as deteriorating (Figure 10.1).
Between 2017 and 2022, the indicator showed little or no change.
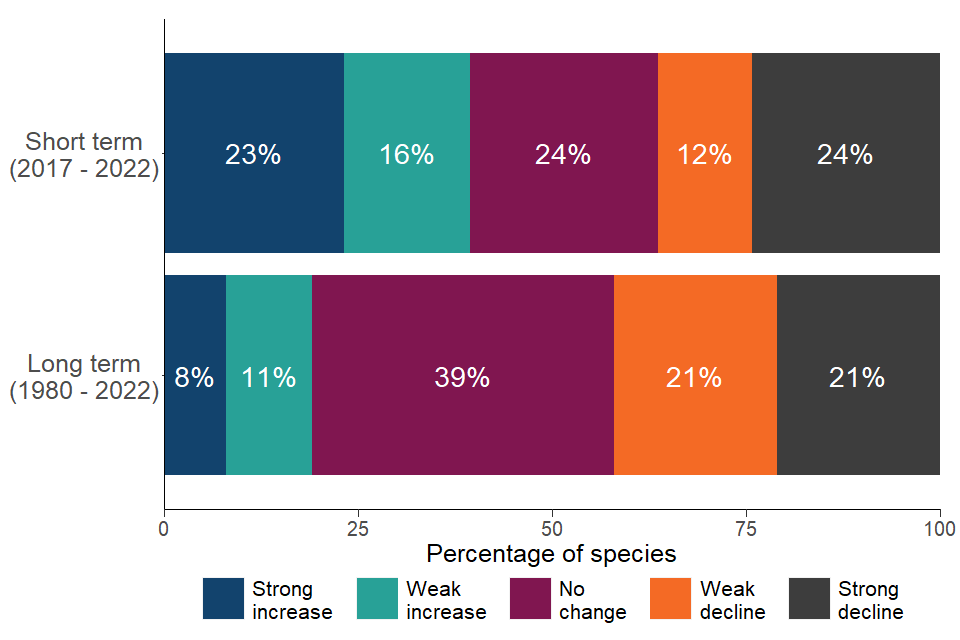
Over the long term, 19% of pollinator species became more widespread (8% exhibiting a strong increase), and 42% pollinator species became less widespread (21% exhibiting a strong decline).
Over the short term, 39% of pollinator species became more widespread (23% exhibiting a strong increase), and 36% of pollinator species became less widespread (24% exhibiting a strong decline).
Figure 10.1: Change in the distribution of 394 UK pollinators, 1980 to 2022.
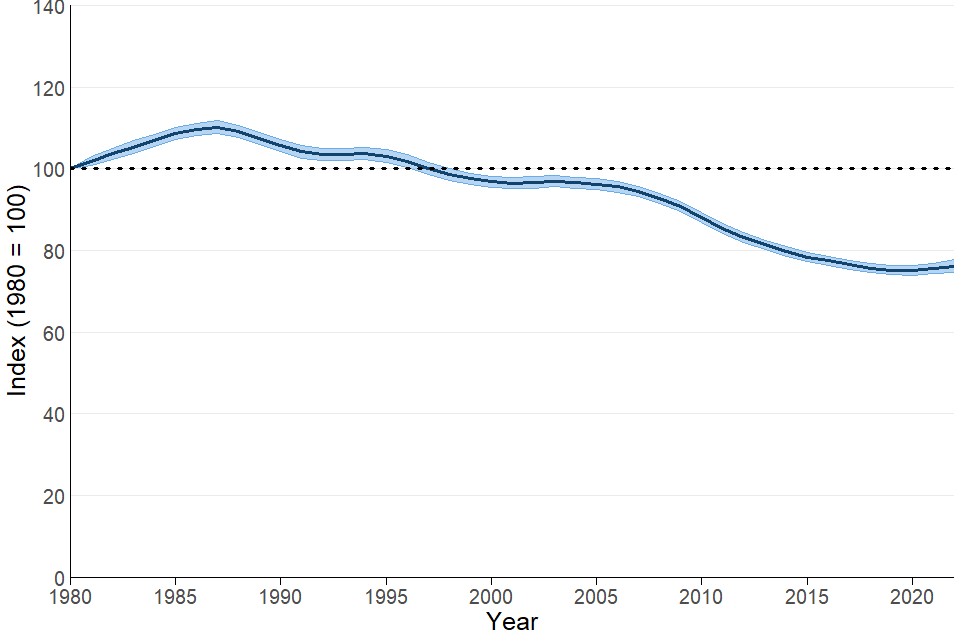
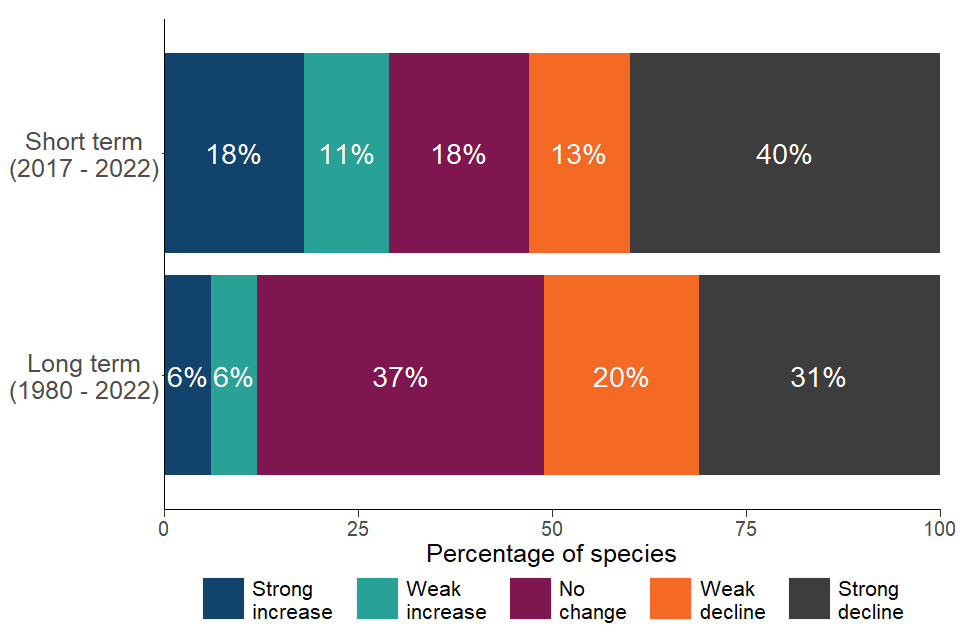
Figure 10.2: Long-term and short-term changes in individual species trends for 394 pollinators in the UK, 1980 to 2022.
Download the data for Figures 10.1 and 10.2 in ods format
Notes about Figure 10.1 and 10.2
- The index used in the indicator update in 2023 includes 394 species (158 wild bee and 236 hoverfly species); the number of species can vary between years.
- Figure 10.1 shows the unsmoothed composite indicator trend with variation around the line (shaded area) within which users can be 90% confident that the true value lies (credible interval)
- Figure 10.2 shows the percentage of species within the indicator that have increased, decreased or shown little change in occupancy, based on set thresholds of change (see supporting technical document)
- Since the 2021 publication a new methodology has been applied to the whole time series.
- Source: Bees, Wasps & Ants Recording Society; Biological Records Centre (supported by UK Centre for Ecology & Hydrology and Joint Nature Conservation Committee); Hoverfly Recording Scheme.
Background on Figure 10.1
As individual pollinator species become more or less widespread, the communities in any given area become more or less diverse, and this may have implications for pollination as more diverse communities are, in broad terms, more effective in pollinating a wider range of crops and wild flowers. Despite the inter-annual variation, the overall trend for pollinators remains downward.
The indicator occupancy index was also produced for the bee (Figure 10.3) and hoverfly (Figure 10.5) species separately.
Trend description for Figure 10.3
The wild bee index fluctuates around its initial value over much of the time series, but in 2022 it was estimated to be 19% higher than in 1980.
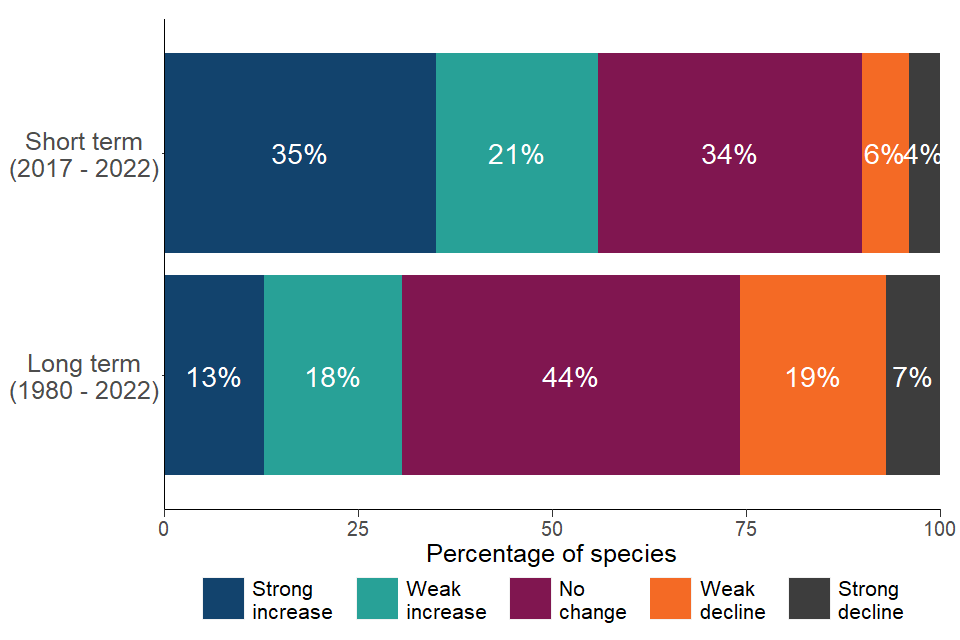
A greater proportion of bee species have increase than decreased in occupancy over both the long and short term. Over the long term, 31% of bee species became more widespread (13% exhibiting a strong increase), and 26% of bee species became less widespread (7% exhibiting a strong decline).
Over the short term, 56% of bee species became more widespread (35% exhibiting a strong increase), and 10% of bee species became less widespread (4% exhibiting a strong decline).
Loss of foraging habitat is understood to be a major driver of change in bee distribution (Vanbergen et al., 2014) and pesticide use has been shown to have an effect on bee behaviour and survival (Stanley et al., 2015). Weather effects, particularly wet periods in the spring and summer, are also likely to have had an impact. Further research would help to better understand the relative importance of these potential drivers of change.
Figure 10.3: Change in the distribution of 158 wild bee species in the UK, 1980 to 2022.
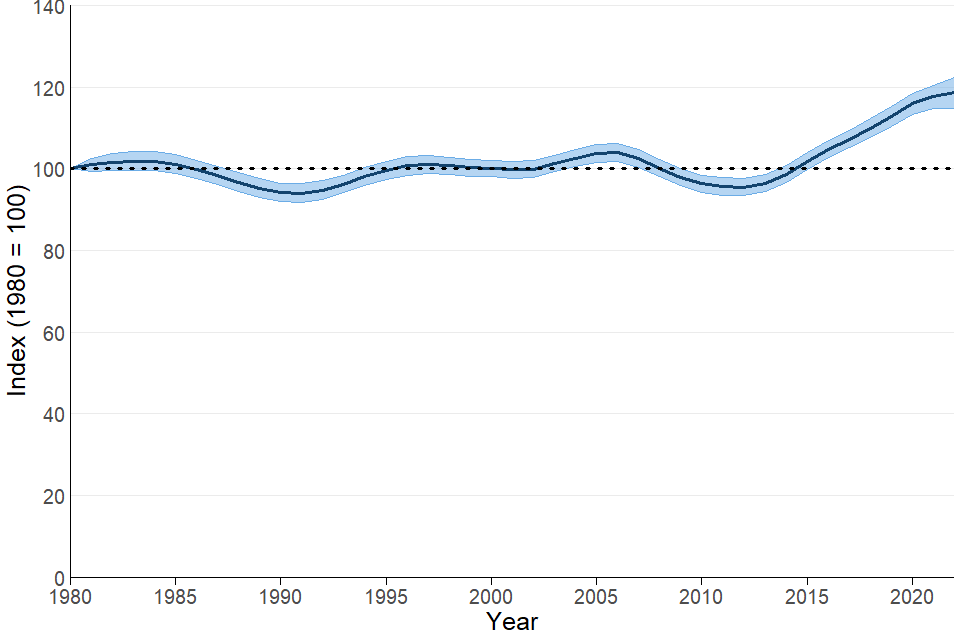
Figure 10.4: Long-term and short-term changes in individual species trends for 158 wild bees in the UK, 1980 to 2022.
Download the data for Figures 10.3 and 10.4 in ods format
Notes about Figure 10.3 and 10.4:
- The index used in the indicator update in 2023 includes 158 wild bee species; the number of species can vary between years.
- Figure 10.3 shows the unsmoothed composite indicator trend with variation around the line (shaded area) within which we can be 90% confident that the true value lies (credible interval)
- Figure 10.4 shows the percentage of species within the indicator that have increased, decreased or shown little change in occupancy, based on set thresholds of change
- Since the 2021 publication a new methodology has been applied to the whole time series.
- Source: Bees, Wasps & Ants Recording Society; Biological Records Centre (supported by UK Centre for Ecology & Hydrology and Joint Nature Conservation Committee).
Trend description for Figure 10.5
The hoverflies index peaked in 1987 (18% higher than the baseline of 100 in 1980), and then underwent a progressive decline, and in 2022 it was estimated to be 44% lower than in 1980.
A greater proportion of hoverflies have declined than increased in occupancy over both the long and short term. Over the long term, 12% of hoverfly species became more widespread (6% exhibiting a strong increase), and 51% of hoverfly species became less widespread (31% exhibiting a strong decline).
Over the short term, 29% of hoverfly species became more widespread (18% exhibiting a strong increase), and 53% of hoverfly species became less widespread (40% exhibiting a strong decline).
It is not clear why hoverflies show a different trend to bees, although differences in the life cycle will mean they respond differently to weather events and habitat change.
Figure 10.5: Change in the distribution of 236 hoverfly species in the UK, 1980 to 2022.
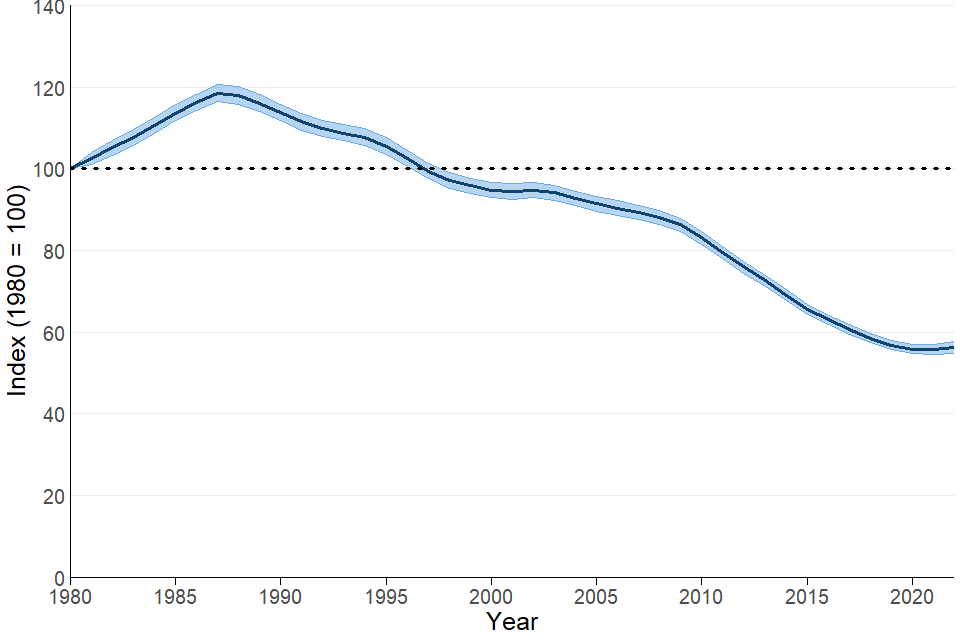
Figure 10.6: Long-term and short-term changes in individual species trends for 236 hoverflies in the UK, 1980 to 2022.
Download the data for Figures 10.5 and 10.6 in ods format
Notes about Figures 10.5 and 10.6:
- The index used in the indicator update in 2023 includes 236 hoverfly species; the number of species can vary between years.
- Figure 10.5 (the line graph) shows the unsmoothed composite indicator trend with variation around the line (shaded) within which we can be 90% confident that the true value lies (credible interval).
- Figure 10.6 (the bar chart) shows the percentage of species within the indicator that have increased, decreased or shown little change in occupancy, based on set thresholds of change.
- Since the 2021 publication a new methodology has been applied to the whole time series.
- Source: Biological Records Centre (supported by UK Centre for Ecology & Hydrology and Joint Nature Conservation Committee); Hoverfly Recording Scheme.
Further information
Relevance
Nature is essential for human health and well-being. Pollination is an important ecosystem service that benefits agricultural and horticultural production and is essential for sustaining wild flowers. Bees and hoverflies are also popular insects and people enjoy seeing them in towns, cities and the wider countryside. Insect pollination depends on the abundance, distribution and diversity of pollinators. Knowledge of the population dynamics and distribution of those species that provide the service, the pollinators, helps us assess the risk to these values.
Many wild bees and other insect pollinators have become less widespread, particularly those species associated with semi-natural habitats. At the same time, a smaller number of pollinating insects have become more widespread. This may have implications for the pollination service they provide to crops and wild flowers and is an area of active research (Potts et al., 2010 and Garratt et al., 2014).
The UK and England Biodiversity Indicators are currently being assessed alongside the Environment Improvement Plan Targets, and the new Kunming-Montreal Global Biodiversity Framework Targets, when this work has been completed the references to Biodiversity 2020 and the Aichi Global Biodiversity Framework Targets will be updated.
Background
Occupancy of pollinators refers to the overall area where each species is found and does not refer directly to their abundance. The reduction in the index shows that overall pollinators are becoming more restricted in their distributions so that, on average, in any one place the diversity of pollinator species found is reduced.
The indicator is the average trend across all 394 species included in the analysis. Individual species within the indicator will have different time-series trends (that is, some may be increasing while others may show strong declines). The shaded region on Figures 10.1, 10.3 and 10.5 is the 90% credible interval of the annual occupancy estimates and represents the statistical uncertainty surrounding the annual occupancy estimates.
Credible intervals are similar to the confidence intervals used in parametric statistics but are the appropriate metric to use with Bayesian statistics. Estimates will be revised as new data become available.
The Bayesian occupancy approach is an established analytical method that enables an estimation of species occurrence even though the data utilised in this indicator were collected without a standardised survey design (Van Strien et al., 2013 and Isaac et al., 2014).
For each species, records were extracted at the 1km grid cell scale with day precision, and an annual time-series of the proportion of sites occupied was calculated. Each species-specific time-series was scaled so the first value in 1980 was set to 100. The annual index (the pollinator occupancy indicator) was estimated as the arithmetic mean of the scaled species-specific occupancy estimates.
Each species was given equal weighting within the indicator. Uncertainty in the species-specific annual occupancy estimates is represented by the 90% credible intervals. See the technical background document for further detail on the production of this indicator.
The composite indicator was produced using a novel hierarchical modelling method for calculating multi-species indicators developed by the UK Centre for Ecology & Hydrology (UKCEH) (Freeman et al. 2020). The new method offers several advantages over the simple geometric mean used previously (see the technical background document for more details.
Crucially, this method uses a smoothing process to reduce the impact of between-year fluctuations - such as those caused by variation in weather - making underlying trends easier to detect. This has resulted in a much smoother trend and smaller magnitude of decline since 1980 when compared to the indicator published in 2021.
In addition, the index values produced by the new method are more precise (narrower ribbon of uncertainty). This is one reason why the short-term assessment (last 5 years) has switched from ‘Little or no change’ in 2021 to ‘Deteriorating’ in 2022).
As species become more or less widespread, individual grid squares will have richer (more species) or poorer (fewer species) pollinator communities. Pollination services are generally likely to be higher where the pollinator community is richer (Vanbergen et al., 2013). The area occupied does not necessarily relate to pollinator abundance, as a species with one individual in each of 10 grid squares would receive the same occupancy score as a species with 100 individuals in each of the same grid squares. Although, generally, species with greater occupancy are likely to be more abundant. National level data on changes in abundance of pollinators is not currently available.
The short-term trends tend to have fewer species falling into the ‘stable’ category than the long-term trends. This is a result of the high level of short-term variation in invertebrate populations. The species-specific trends were calculated as the mean percentage change in occupancy per year. Therefore, across a 42-year period, the influence of short-term variation on the trend is reduced compared to its influence on a shorter 5-year period.
References
- Garratt, M. P. D., Truslove, C. L., Coston, D. J., Evans, R. L., Moss, E. D., Dodson, C., Jenner, N., Biesmeijer, J. C. and Potts, S. G. (2014). Pollination deficits in UK apple orchards. Journal of Pollination Ecology, 12, pp. 9 to 4.
- Isaac, N. J. B., van Strien, A. J., August, T. A., de Zeeuw, M. P. and Roy, D. B. (2014). Statistics for citizen science: extracting signals of change from noisy ecological data. Methods in Ecology and Evolution, 5, pp. 1052 to 1060.
- Potts, S. G., Biesmeijer, J. C., Kremen, C., Neumann, P., Schweiger, O. and Kunin, W. E. (2010). Global pollinator declines: trends, impacts and drivers. Trends in Ecology & Evolution, 25, pp. 345 to 353.
- Stanley, D. A. Garratt, M. P. D., Wickens, J. B., Wickens, V. J., Potts, S. G. and Raine, N. E. (2015). Neonicotinoid pesticide exposure impairs crop pollination services provided by bumblebees. Nature, online.
- Van Strien, A. J., van Swaay, C. A. M. and Termaat, T. (2013). Opportunistic citizen science data of animal species produce reliable estimates of distribution trends if analysed with occupancy models. Journal of Applied Ecology, 50, pp. 1450 to 1458.
- Vanbergen, A., Heard, M., Breeze, T., Potts, S. and Hanley, N. (2013). Status and Value of Pollinators and Pollination Services. Report to Defra.