Coroners statistics 2023: England and Wales
Updated 10 May 2024

© Crown copyright 2024
This publication is licensed under the terms of the Open Government Licence v3.0 except where otherwise stated. To view this licence, visit nationalarchives.gov.uk/doc/open-government-licence/version/3 or write to the Information Policy Team, The National Archives, Kew, London TW9 4DU, or email: psi@nationalarchives.gov.uk.
Where we have identified any third party copyright information you will need to obtain permission from the copyright holders concerned.
This publication is available at https://www.gov.uk/government/statistics/coroners-statistics-2023/coroners-statistics-2023-england-and-wales
1. Main Points
| Decrease in the number of deaths reported to coroners in 2023 | 195,000 deaths were reported to coroners in 2023, the lowest level since the start of the annual time series in 1995 – down 6% (13,400) compared to 2022. |
| 34% of all registered deaths were reported to coroners in 2023 | The proportion of registered deaths in England and Wales has decreased by three percentage points compared to 2022. |
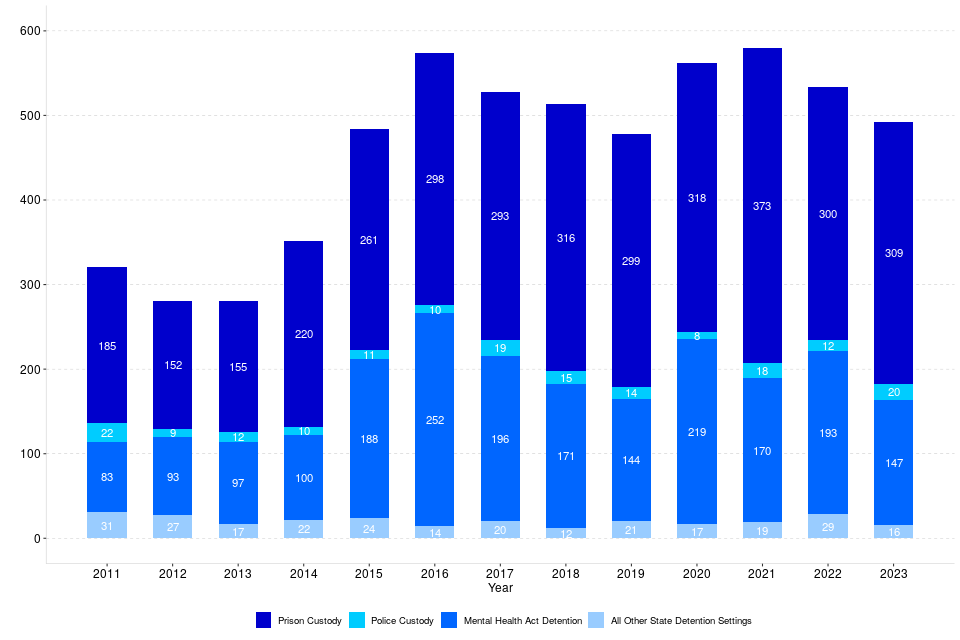
| Deaths in state detention, down 8% in the last year | 492 deaths in state detention were reported to coroners in 2023 (down from 534 in 2022), the decrease was driven by a 24% fall in deaths of those in Mental Health Act detention. |
| Post-mortem examinations were carried out on 44% of all deaths reported in 2023 | There were 86,000 post-mortem examinations ordered by coroners in 2023, a 5% fall compared to 2022. The proportion of reported deaths requiring a post-mortem increased by one percentage point over the same period. |
| 2% more inquests opened in 2023 | 36,900 inquests were opened in 2023, up 2% (582) compared to 2022. |
| Inquest conclusions up 11%, the largest rise seen in drugs/alcohol related, accident/misadventure and unclassified conclusions | In 2023, 39,500 inquest conclusions were recorded in total, up 11% on 2022. Drugs/alcohol related, accident/misadventure and unclassified conclusions had the largest increases, up 16%, 11% and 15% on 2022, to 4,600, 9,700 and 10,000 inquest conclusions in 2023 respectively. |
| Average time taken to complete an inquest rose by 1.3 weeks | The estimated average time taken to process an inquest increased from 30.2 weeks in 2022 to 31.5 weeks in 2023. |
| Prevention of Future Deaths reports up by 41% | 569 Prevention of Future Deaths reports were issued in 2023, an increase of 41% compared to 2022. |
This annual publication presents statistics of deaths reported to Coroners in England and Wales in 2023. Information is provided on the number of deaths reported to coroners, post-mortem examinations and inquests held, and conclusions recorded at inquests. A map reference of Coroner areas in England and Wales is available in the supporting document published alongside this bulletin. For previous editions of this report please see: www.gov.uk/government/collections/coroners-and-burials-statistics.
2. Statistician’s comment
In the 2023 calendar year, deaths reported to coroners were at their lowest volume in England and Wales since 1995, a decrease of 3 percentage points compared with the previous year.
In contrast, inquests opened as a proportion of deaths reported to coroners were at their highest in 2023 since the start of the annual time series in 1995, with a corresponding increase of 11% in inquest conclusions recorded since 2022 (2nd highest in the series). The average time taken to complete an inquest rose by 1.3 weeks to 31.5 weeks this year. The main drivers of the increase in the number of inquest conclusions were unclassified conclusions and death by misadventure which together account for half of all inquest conclusions.
Suicide conclusions were at their highest level since the start of the time series in 1995. An increase on 2022 was higher in females (11% compared with 2022) than males (which increased by 7%). It must be noted that conclusions are recorded after an inquest. This means the conclusions recorded in a certain year may relate to deaths from the same or earlier years.
In 2023, the second full year of data collection, there were 569 Prevention of Future Death reports issued. This represents 1% of all inquests concluded and an increase of 41% compared with 2022.
3. Deaths Reported to Coroners
6% decrease in the number of deaths reported to coroners in 2023
194,999 deaths were reported to coroners in 2023, the lowest level since the start of the annual time series in 1995. This is a decrease of 13,431 (6%) from 2022.
34% of all registered deaths were reported to coroners in 2023
The number of deaths reported to coroners as a percentage of all registered deaths has decreased by three percentage points when compared with 2022.
All deaths in England and Wales must be registered with the Registrar of Births and Deaths and statistics on all registered deaths are published by the Office for National Statistics (ONS). The ONS mortality statistics, based on death registrations, report the number of deaths registered in England and Wales in a particular year irrespective of whether a coroner has investigated the death.
The Ministry of Justice’s coroner statistics provide the number of deaths which are reported to coroners in England and Wales. The coroner has a duty to investigate when there is reason to believe that the cause of death is unknown or that the death was violent, unnatural, or occurred in custody or other state detention. Further background information is provided in Chapter 1 of the supporting guidance document.
The number of deaths reported to coroners in 2023 decreased by 13,431 (6%) to 194,999, the lowest level since the start of the annual time series in 1995. In comparison, ONS registered deaths rose 4,207 (1%)[footnote 1] from 2022 to 2023. The proportion of registered deaths in 2023 that were reported to coroners was 34%, down three percentage points from 2022.
The number of registered deaths in England and Wales had been broadly increasing, from a low of 484,367 in 2011 to 541,589 in 2018. 2019, however, saw a decrease to 530,857, before rising to 607,922 in 2020 – the highest level in absolute terms since reporting began, due to the Covid-19 pandemic. Following this, 2021 saw a fall to 586,334 and a further decrease to 577,160 in 2022. ONS provisional figures for 2023 shows an increase to 581,367.
The number of deaths reported to coroners initially followed a similar trend, from a low of 222,371 in 2011 and then rising to a high of 241,211 in 2016. However, deaths reported to coroners between 2017 to 2021 and 2023 fell (there was a decrease in both deaths registered and deaths reported in 2019 and 2021), as shown in figure 1. This shows a reversal to similar broadly stable levels seen prior to 2015. 2022 saw an increase in the number of deaths reported to coroners for the first time since 2016.
Figure 1: Registered deaths and deaths reported to coroners, England and Wales, 2013-2023 (Source: Table 2)

Out of England and Wales Orders
To take a body of a deceased person out of England and Wales, notice must be given to the coroner within whose area the body is lying. When the coroner gives permission for the removal of a body, an Out of England and Wales order is issued.
Out of England and Wales orders as a proportion of registered deaths has consistently remained around 1%. This year coroners issued 5,802 Out of England and Wales orders, compared with 5,332 issued in 2022.
Deaths abroad
Of the 194,999 deaths reported to coroners in 2023, around 1% (1,561) were reports of deaths that had occurred outside England and Wales, showing no significant year on year change over the past five years. The number of reported deaths which occurred abroad increased by 6% (87 cases) in 2023 compared with 2022 (1,474 cases).
4. Deaths in State Detention
Deaths in state detention, down 8% in the last year
Deaths in state detention reported to coroners decreased by 8% to 492 in 2023, driven by a fall in the number of deaths of those in Mental Health Act detention.
In 2023, a total of 492 deaths which occurred in state detention were reported to coroners[footnote 2], a decrease of 42 deaths (8%) on the previous year and representing less than 1% of all deaths reported to coroners.
There were 147 deaths of individuals subject to Mental Health Act Detention in 2023, a 24% decrease (46 cases) compared with 2022. The Care Quality Commission reported 264 deaths under the Mental Health Act 1983 (as amended)[footnote 3] in financial year 2022/23, down 2% on the number they reported in 2021/22 (270 deaths).
The number of deaths in prison custody reported to coroners increased by 3% (nine cases) compared with 2022, to 309 deaths in 2023. His Majesty’s Prison and Probation Service (HMPPS) reported 311 deaths in prison custody in 2023 (Safety in Custody Statistics[footnote 4]), up 3% on the number they reported in 2022 (301 deaths). These rises are consistent with the increasing trend in the prison population, which has risen by 7% in the last year[footnote 5]. The deaths in prison custody reported by coroners (309) have been cross-referenced to deaths in prison custody recorded on the HMPPS database (311) in order to ensure consistency between these two sources. The difference is due to timing. Deaths which occur close to the end of the calendar year may be reported to the coroner in the next year, causing minor discrepancies. Police custody cases increased by 8, to 20 deaths. For more detailed information on prison custody deaths please see the Safety in Custody Statistics publication.
Figure 2: Number of deaths in state detention (excluding DoLS), by type of detention, 2011-2023 (Source: Table 6)
5. Post-Mortem examinations held
Post-mortem examinations were carried out in 44% of all deaths reported to coroners in 2023
There were 86,014 post-mortem examinations ordered by coroners in 2023, representing 44% of all cases reported to them (an increase of one percentage point since 2022).
Post-mortem examinations were held in 86,014 deaths reported to coroners in 2023, down 4,177 (5%) from 2022. This represents 44% of all deaths reported to coroners in 2023, an increase in proportion by one percentage point on the 2022 volume.
Figure 1 of the supporting guidance document published alongside these statistics provides an overview of the possible outcomes when a death is reported to a coroner, including circumstances involving a post-mortem examination.
Figure 3: Post-Mortems as a percentage of deaths reported to coroners, England and Wales, 2017-2023 (Source: Tables 3-4)
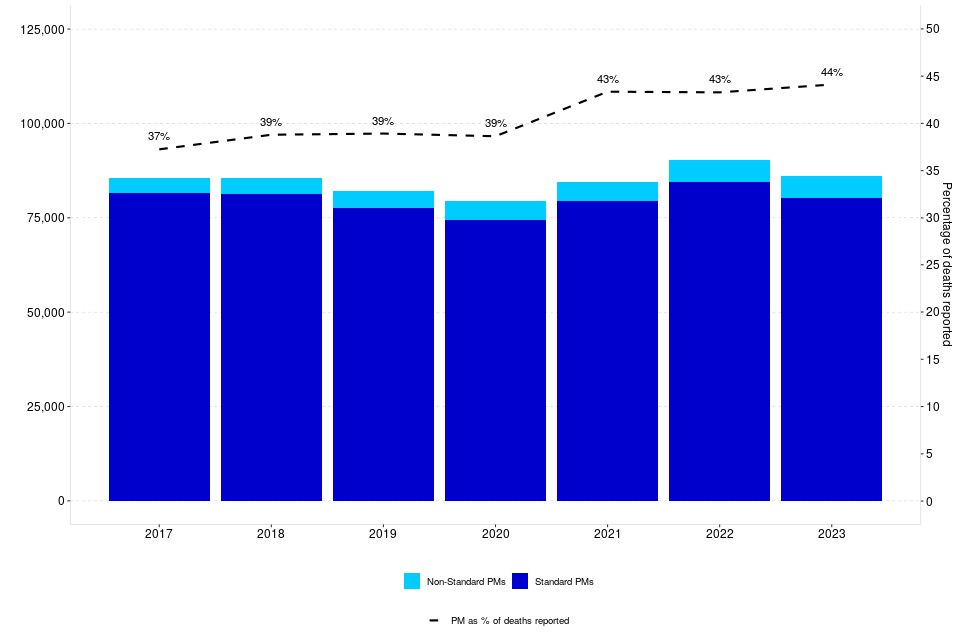
Post-mortem examinations may be classed as either standard or non-standard, depending on the nature of the examination. A non-standard post-mortem requires specialist skills – for example, a paediatric or other specialist pathologist. In 2023, almost all (93%) of post-mortem examinations were ordered at the standard rate – remaining stable compared with 2022.
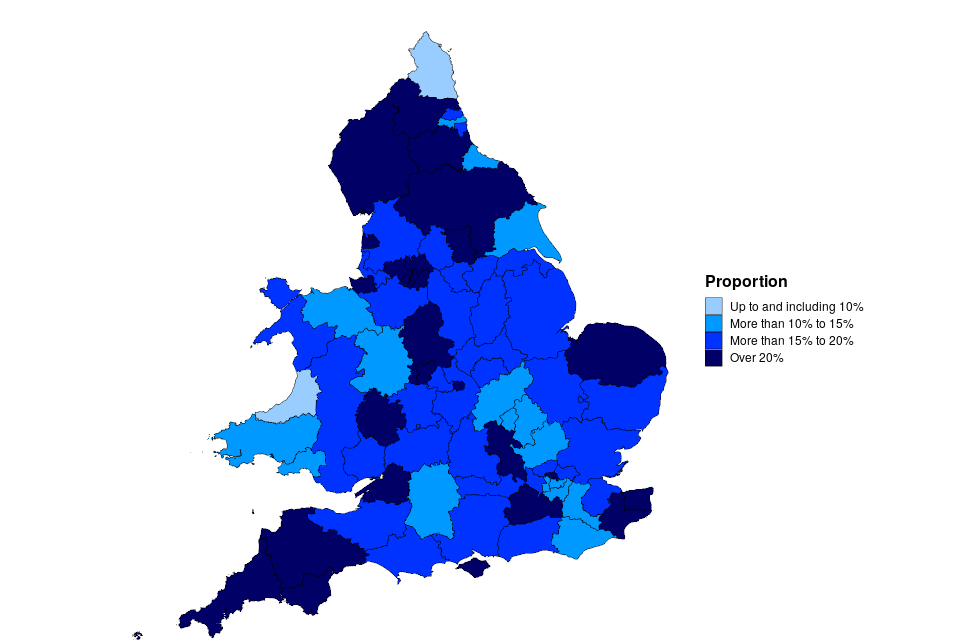
The proportion of post-mortem examinations carried out varies from 21% of deaths reported in City of London to 74% in Surrey, as shown by Map 1. Caution should be taken when making comparisons between regions in terms of any coronial activity – for example, the number of post-mortem examinations, the number of inquests opened, or timeliness - as differences in local authority set-up, resource, facilities and socio-economic make up mean this will not be comparing like with like.
Map 1: Post-Mortem Examinations held as a proportion of deaths reported to coroners, England and Wales, 2023

Post-mortem examinations in inquest cases
A post-mortem examination will often be held before the coroner decides whether to open an investigation or a subsequent inquest. In 2023, 50% (18,326) of deaths reported to coroners which eventually led to an inquest involved a post-mortem examination, down one percentage point on 2022.
Post-mortem examinations in non-inquest cases
In the majority (77%) of cases referred to coroners, there is no inquest. In 2023, there were 61,915 reported deaths where a post-mortem examination was carried out, but which did not lead to an inquest. The percentage of non-inquest cases that required a post-mortem examination has seen an increase from 40% in 2022 to 41% in 2023. The number of non-inquest investigations discontinued with a post-mortem was 15,842 in 2023, up from 12,149, an increase of 30%, in 2022 (the 2022 figure is a partial count due to this being the first year this data was collected).
Post-mortem examinations in potential inquest cases
Potential inquests are those cases where the coroner has opened an investigation into the death but has not yet decided whether it is necessary to hold an inquest. In 2023, there were 7,453 potential inquest cases being dealt with by coroners in England and Wales, with 77% requiring a post-mortem. The number of potential inquests in total has decreased by 10% in the past year.
Cases requiring neither a post-mortem nor inquest
There were 88,776 deaths reported to coroners where there was neither a post-mortem nor an inquest. This will be cases where a natural cause was established at some point after the report of death. This type of case has decreased by 10% in the current year and the number of cases reported is the lowest level since 1998. The proportion of all deaths reported to coroners where there was neither an inquest nor a post-mortem examination has decreased by two percentage points to 46% in 2023. Of the investigations without a post-mortem or inquest, a decision was made to discontinue 1,783 of them in 2023, up from 1,595, an increase of 12%, in 2022 (the 2022 figure was for June to December only. This was when a new provision was put in place to allow a coroner to discontinue an investigation where a natural cause of death has been revealed through other evidence without a post-mortem examination).
Histology, toxicology and less-invasive post-mortem examinations
In 2023, 20% (17,619) of all post-mortem examinations included histology, no change from 20% (18,465) in 2022. Post-mortem examinations including toxicology increased by 900 cases over the same period to 22,826 (up 4%), with 27% of all post-mortem examinations held in 2023 including toxicology - continuing the consistently rising trend.
There were 13,348 post-mortem examinations conducted using less-invasive techniques alongside an autopsy or other invasive intervention, and 8,798 using only less-invasive techniques (such as Computerised Tomography [CT] scans) in 2023. The number of post-mortem examinations carried out using only less-invasive techniques varied from zero in 17 areas to 1,427 in Lancashire and Blackburn with Darwen. South Yorkshire (Eastern), Black Country, Lancashire and Blackburn with Darwen, Rutland and North Leicestershire, Leicester City and South Leicestershire, and Staffordshire and Stoke on Trent (there was one aggregated return for Staffordshire South and Stoke-on-Trent and North Staffordshire although these were only merged in October 2023) conducted over a half (86%, 83%, 81%, 65%, 61% and 50% respectively) of all their post-mortem examinations using only less-invasive techniques. South Yorkshire (Western), Derby and Derbyshire, and West Yorkshire (Western) conducted over a quarter of all their post-mortem examinations using less-invasive techniques (40%, 39% and 31% respectively).
Additionally, 24 post-mortem examinations were conducted following a request from a defence lawyer (less than 1% of all post-mortems) and 3% (2,187) of post-mortem examinations were conducted by a Home Office (HO) forensic pathologist. These would usually be held in relation to a criminal investigation.
6. Inquests Opened
2% increase in inquests opened in 2023 (Source: Table 2)
The number of inquests opened in 2023 increased by 582 (up 2%) to 36,855.
There were 36,855 inquests opened in 2023, a 2% increase on 2022. This is the highest number of inquests opened since the start of the annual time series in 1995, excluding the years when DoLS investigations were required.
Reported deaths which led to inquests represented 19% of all the deaths reported to coroners in 2023, an increase from 17% in 2022. The number of inquests opened as a proportion of deaths reported in 2023 varied across coroner areas, from 4% in Ceredigion to 39% in Liverpool and the Wirral. However, most coroner areas held inquests for between 10% and 20% of all deaths reported (51 of the 80 coroner areas). Map 2 shows the inquests opened as a proportion of deaths reported in 2023 for all coroner areas in England and Wales.
Inquests with juries and suspended investigations (table source: Table 9)
A jury is required by law in certain inquests, including non-natural deaths in custody or other state custody or where police forces were involved. Coroners can exercise discretionary powers to hold a jury inquest where they deem it appropriate.
There were 474 inquests held with juries in 2023 (representing 1% of all inquests), a decrease of two (less than 1%) compared with 2022.
In 2023, 891 investigations were suspended (and not resumed) by the coroner under Schedule 1[footnote 6] to the Coroners and Justice Act 2009 because criminal proceedings took place. Of these, 828 had an inquest open at the time of suspension.
Map 2: Inquests opened as a proportion of deaths reported to coroners, England and Wales, 2023
7. Inquest Conclusions[footnote 7]
11% increase in inquest conclusions recorded, with the largest increase seen in drugs/alcohol related, accident/misadventure and unclassified conclusions.
In 2023, 39,469 inquest conclusions were recorded, up 11% on 2022. Inquest conclusions of drugs/alcohol related, accident/misadventure and unclassified were up 16%, 11% and 15% on 2022 to 4,603, 9,717 and 9,976 respectively.
There were 39,469 inquest conclusions recorded in 2023, up 3,826 (11%) from 2022, in part reflecting the increase in the number of inquests opened. This is the highest level since 2016. Of the inquests concluded 3,073 were inquests in writing. This is the first year this breakdown of the data has been collected and should be treated with caution as not all coroners were set up to provide this information from January 2023. Background information on inquest conclusions is provided in Chapter 1 of the supporting guidance document.
Conclusions are recorded after an inquest. This means that the conclusions recorded in a certain year may relate to deaths from the same year or earlier years.
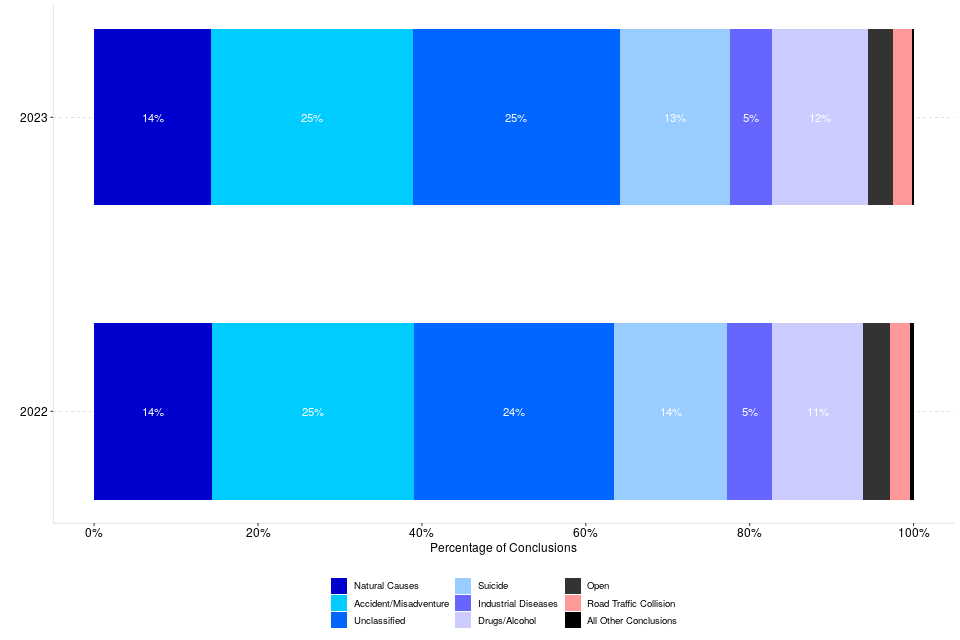
In 2023, the most common short form conclusions (by order of frequency) were death by misadventure (9,717 or 25% of all conclusions), death by natural causes (5,632 or 14%) and suicide (5,294 or 13%).
Unclassified conclusions made up 25% (9,976) of all inquest conclusions in 2023. An unclassified conclusion is where the coroner or jury do not rely on just one of the short-form conclusions, or where a narrative conclusion (which may or may not accompany a short-form conclusion) is returned by the coroner or jury.
The number of suicide conclusions increased by 8% compared with 2022, to the highest level since the start of the time series in 1995. The increase was higher in females (11% compared with 2022) than males (which increased by 7% compared with 2022).
Industrial disease conclusions rose by 4% in the last year (to 2,045 cases), the highest level since 2021.
Figure 4: Number of conclusions recorded at inquests, England and Wales, 2013-2023 (Source: Table 7)

*Includes Killed unlawfully; Killed lawfully; Lack of care or self-neglect; Stillborn; Open; Industrial Disease; Drugs/Alcohol related[footnote 8]; and Road traffic collision.
In 2023, natural causes conclusions increased by 10% to 5,632. This increase in natural cause conclusions may suggest that cases of natural cause were not able to be dealt with by a doctor signing a medical certificate of cause of death in the normal way.
In 2023, the number of unclassified conclusions increased by 1,265 cases (up 15%) to 9,976. Unclassified conclusions made up 25% of all inquest conclusions in 2023, an increase in proportion by one percentage point compared with the 2022 amount. The rise in unclassified conclusions seen until 2014 and again from 2016 is partly due to the increasing use of what are known as ‘narrative conclusions’ by some coroners. In these cases, the conclusion is recorded as unclassified. As well as narrative conclusions, this category includes short non-standard conclusions which a coroner or jury might return when the circumstances do not easily fit any of the standard conclusions[footnote 9].
The proportion of conclusions recorded as suicide has remained broadly constant over the past five years, seeing a decrease from 14% of all conclusions in 2022 to 13% in 2023.
For the remaining conclusion types, alcohol/drugs related deaths continued to increase. This year it increased by 630 cases (up 16%) to 4,603, the highest it has been since 2014. Road traffic collisions increased by one case (up less than 1%) to 881.
The share of open conclusions has decreased over the last decade - they accounted for 3% of all inquests concluded in 2023 compared with 6% in 2013. Year on year, open conclusions increased by 5% compared with 2022.
Figure 5 shows the proportion changes in inquest conclusions between 2022 and 2023.
Figure 5: Conclusions recorded at inquest, by category and as a proportion of all conclusions, England and Wales, 2022 and 2023 (Source: Table 7)[footnote 10] [footnote 11]
8. Inquest Conclusions by Sex
Conclusions recorded at inquests by sex[footnote 12]
Male deaths accounted for 63% of all conclusions recorded in 2023 while female deaths accounted for 37%. In 2022, the percentages were 64% and 36% respectively.
The pattern of conclusions recorded differs between males and females. Males accounted for 58% of deaths reported but 63% of all conclusions recorded in 2023.
Correspondingly, female deaths accounted for 37% of all conclusions recorded in 2023 (and 42% of all deaths reported). Figure 6 shows the variation in the sex proportions, depending on the type of inquest conclusion. Industrial disease had the highest proportion of inquests relating to males, at 92%; natural causes had the highest proportion of inquests relating to females[footnote 13], at 46%.
Figure 6: Conclusions recorded at inquests by sex, England and Wales, 2023 (Source: Table 7)

9. Inquest Conclusions by Age
The majority of inquests completed were for those aged 65 years and over
Of the inquests completed in 2023, 57% related to persons who were aged 65 years or over at time of death compared with 5% relating to persons under 25 years of age.
The profile of the age of deceased in inquests has remained stable from 2022 to 2023. The percentage of inquests completed relating to persons aged 65 or over was unchanged at 57%. By contrast, 5% of inquests concluded related to persons under 25 years of age, unchanged compared with 2022, while the percentage of those between 25 and 65 years remained stable at 39% over the same period (see Table 8).
When compared with 2013, the percentage of inquests completed relating to persons aged 65 or over rose from 49% to 57%. Inquests concluded relating to persons under 25 years of age fell from 7% to 5% compared to 2013. The percentage of those between 25 and 65 years also fell, from 44% to 39% over the same period.
Although an age breakdown of registered deaths in England and Wales in 2023 is not yet available, ONS figures for 2022[footnote 14] show that 85% of registered deaths in England and Wales were persons aged 65 or over, with only 1% aged under 25 years old.
Figure 7: Proportion of inquest conclusions by age of deceased, England and Wales, 2022 and 2023 (Source: Table 8)[footnote 15]

10. Time taken to process an inquest
Overall an increase of 1.3 weeks in the average time taken to process an inquest
The estimated average time taken to process an inquest is up from 30.2 weeks in 2022 to 31.5 weeks in 2023.
The estimated[footnote 16] average time taken to process an inquest in 2023 (defined as being from the date the death was reported until the conclusion of the inquest) was 31.5 weeks (see Table 13)[footnote 17], an increase of 1.3 weeks compared with 2022.
The average time taken to process an inquest varies by coroner area - the maximum average time taken to process an inquest in 2023 was 73 weeks in North Lincolnshire and Grimsby, and the minimum average time was eight weeks in Black Country. This disparity between regions is mainly due to differences that exist from one coroner area to another. Some of these differences are:
-
Availability of resource, staff and judicial resources
-
The presence of facilities like hospitals and prisons
-
Socio-economic make up of regions
Therefore, a direct comparison between coroner areas is not advised.
Map 3 provides an overview of average time taken across coroner areas in England and Wales.
More information about how the average time taken has been estimated can be found in the Guide to coroner statistics published alongside this report.
Figure 8: Average time taken to process an inquest (in weeks), 2009-2023 (Source: Table 9)

The decreases in time taken that occurred in 2015 and 2016 can largely be attributed to DoLS deaths where, in accordance with the Chief Coroner’s guidance, in uncontroversial cases, there could be a ‘paper inquest’, i.e. the Coroner in open court considered the evidence on the papers, which had been discussed in advance with the family (and interested persons) – this agreed process, which usually did not require a post-mortem examination report, took much less time to process and conclude, thus reducing the average time.
In 2023, 29% of inquests were completed in less than 3 months, 54% in less than 6 months, 82% took up to a year and 18% took over a year.
Map 3: Estimated average time taken to process inquests, England and Wales, 2023

11. Prevention of Future Death reports
There were 569 PFD reports issued by coroners in 2023, up 41% compared with 2022.
A Prevention of Future Deaths (PFD) report is issued by a coroner if there is a concern (arising from the investigation) that action should be taken to reduce or prevent the risk of other deaths occurring in the future. A PFD report is issued to people or organisations whom the coroner believes are in a position to take action.
Collection of data on PFD reports for these statistics started in 2021 (partial year collection). In 2023, the second full year of data collection, there were 569 PFD reports issued - this represents 1% of all inquests concluded and an increase of 41% compared with 2022.
All the coroner regions issued PFDs in 2023. The London region issued 93, the highest number as a proportion of inquests concluded (3%). London also issued the highest proportion in 2022 (2%). The West Midlands region issued the lowest number of reports (50) as a proportion of inquests concluded (1%). The North East region issued the lowest proportion in 2022 (less than 1%). 8 coroner areas issued no PFDs in 2023. PFD reports and the responses to them must be copied to the Chief Coroner, who may publish them on the Judiciary website. Individual PFD reports and their responses can be found here.
12. Treasure and Treasure Trove
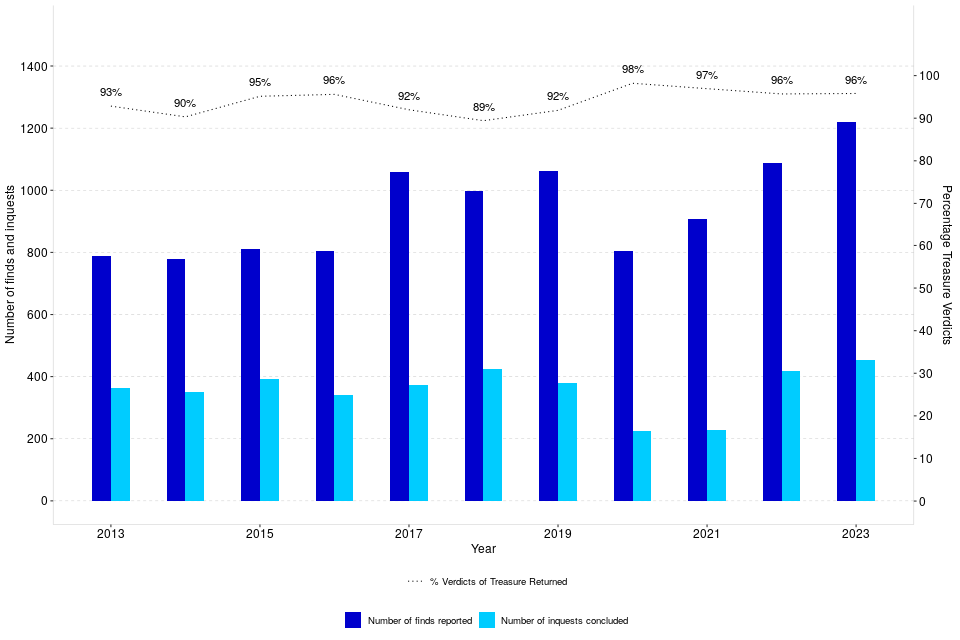
There was a 12% increase in Treasure finds[footnote 18] reported in 2023 and an 8% increase in inquest conclusions on finds
1,219 finds were reported to coroners in 2023, an increase of 132 on 2022. 454 inquests were concluded into finds. Of these, 96% (435) returned a conclusion of treasure, the same proportion when compared with 2022.
The Government has introduced a new definition of treasure which was implemented from July 2023.[footnote 19]
In 2023, 1,219 finds were reported and 454 inquests were concluded. There were no inquests held into Treasure Trove in 2023 (relating to finds made before the Treasure Act 1996 came into force), although it is likely that a few such inquests will continue to be held from time to time.
The number of finds reported has been steadily increasing since the commencement of the 1996 Act in September 1997, from 54 finds in 1997 to 1,059 in 2017. Between 2018 and 2020, however, the number has been more volatile. There has been a big surge in metal detecting activity during (and also since) the pandemic. Since 2021, the number has been rising again. In 2023, the number of finds rose to 1,219 from 1,087 in 2022 (up 12%). The number of treasure inquest conclusions increased by 8% (from 419 in 2022 to 454 in 2023).
Of those 454 inquests concluded in 2023, 96% (435) returned a conclusion of treasure, the same proportion compared to 2022.
Figure 9: Finds reported to coroners, treasure inquests held under the Treasure Act, and proportion of Treasure conclusions returned, 2013-2023 (Source: Table 10)[footnote 20]
The number of finds and inquests held varies greatly across the country, most likely due to geographical and historical differences between areas. In 2023, 20 coroner areas had no treasure finds reported to them, whilst Norfolk had the highest number of treasure finds at 95. Map 4 shows treasure finds across England and Wales in 2023. More information about the duties of coroners to investigate treasure found within their jurisdiction and the provisions of the Treasure Act 1996 (and the previous Treasure Trove provisions) can be found in the supporting guidance.
Map 4: Number of treasure finds reported to coroners, England and Wales, 2023

13. Annex A: Details of recent Coroner Area amalgamations
The following table summarises the coroner area amalgamations that have occurred during 2022 and 2023. For a list of all historical amalgamations and changes to coroner areas, please refer to the supporting guidance document.
| Date effective | Previous Coroner Area | New Coroner Area | Nature of merge |
|---|---|---|---|
| 01-Apr-22 | York City; North Yorkshire (Eastern); North Yorkshire (Western) | North Yorkshire and York | 3 into 1 |
| 01-Apr-23 | Newcastle upon Tyne; North Tyneside | Newcastle and North Tyneside | 2 into 1 |
| 01-Apr-23 | Brighton and Hove; West Sussex | West Sussex, Brighton and Hove | 2 into 1 |
| 01-Oct-23 | Staffordshire South; Stoke-on-Trent and North Staffordshire | Staffordshire and Stoke on Trent | 2 into 1 |
14. Annex B: Further analysis of deaths reported to coroners
In 2023 the number of deaths reported to coroners as a proportion of registered deaths varied widely across coroner areas, from 20% in Exeter and Greater Devon to 60% in Manchester City
The number of deaths reported to coroners in 2023 varied markedly by coroner area – from 265 in City of London to 6,107 in Hampshire, Portsmouth and Southampton. The number of deaths reported in each area will be affected by its size, resident population, demographic breakdown and profile, so comparisons of the number of deaths reported to coroners across coroner areas should be treated with caution.
When looking at the number of deaths reported to coroners in 2023 as a proportion of registered deaths[footnote 21], which allow for some differences in population characteristics, there is still a wide variation across coroner areas, with a minimum of 20% in Exeter and Greater Devon compared with the maximum of 60% in Manchester City. However, caution should be taken when using these figures as local area factors can influence these proportions. For example, large hospitals can impact the proportion, due to the difference between the coroners’ figures being based on the place of death and the ONS figures being based on the place of residence.
The rollout since April 2019 of the non-statutory medical examiner function may explain a reduction in the number of deaths reported to coroners in some areas.
Figure 10: Coroner areas split by the number of deaths reported to coroners in 2023 as a proportion of registered deaths (Source: Table 11)[footnote 22] [footnote 23]

15. Further Information
Revisions to statistics for previous years
The estimated figure for the number of registered deaths in 2022 which was derived from monthly data for the purposes of Table 2 in last year’s edition of this bulletin has now been replaced by the annual figure published by the Office for National Statistics.
Symbols and rounding convention
Within the ‘Key Findings’ sections, figures greater than 1,000 are rounded to the nearest 100. The following symbols have been used throughout the tables in this bulletin:
| n/a | = | Not applicable |
| - | = | Zero |
| .. | = | No data available |
| (p) | = | Provisional Data |
| (r) | = | Revised Data |
Accompanying files
-
This bulletin should be read alongside the statistical tables which accompany it. These tables are also available in an accessible format.
-
There is also a supporting comma-separated values file (CSV) to allow users to carry out their own analysis.
-
In addition to the bulletin and tables, we have published a coroners’ statistical tool. The tool provides easier access to local level data and allows the user to compare up to four areas of interest, for example, it is possible to compare a coroner area with a geographical region, England and/or Wales.
-
The accompanying guide to coroner statistics provides a more detailed overview of coroners; including the functions of coroners and the chief coroner, policy background and changes, statistical revision policies, and data sources and quality. It also includes a glossary with brief definitions for some commonly used terms.
-
The quality statement published with this guide sets out our policies for producing quality statistical outputs for the information we provide to maintain our users’ understanding and trust.
National Statistics Status
National Statistics status are accredited official statistics that meet the highest standards of trustworthiness, quality and public value.
Accredited official statistics are called National Statistics in the Statistics and Registration Service Act 2007. These accredited official statistics were independently reviewed by the Office for Statistics Regulation in January 2019. They comply with the standards of trustworthiness, quality and value in the Code of Practice for Statistics and should be labelled ‘accredited official statistics’.
It is the Ministry of Justice’s responsibility to maintain compliance with the standards expected for National Statistics. If we become concerned about whether these statistics are still meeting the appropriate standards, we will discuss any concerns with the Authority promptly. National Statistics status can be removed at any point when the highest standards are not maintained, and reinstated when standards are restored.
Contact
Press enquiries should be directed to the Ministry of Justice or HMCTS press office:
David Gazet (MoJ) - email: david.gazet@justice.gov.uk
Other enquiries about these statistics should be directed to the Courts and People division of the Ministry of Justice:
Rita Kumi-Ampofo or Matteo Chiesa - email: CAJS@justice.gov.uk
Next update: Thursday 8th May 2025
URL: www.gov.uk/government/collections/coroners-and-burials-statistics
© Crown copyright
Produced by the Ministry of Justice
For any feedback on the layout or content of this publication or requests for alternative formats, please contact cajs@justice.gov.uk
-
Provisional figure based on ONS monthly death registration figures for 2023: https://www.ons.gov.uk/peoplepopulationandcommunity/birthsdeathsandmarriages/deaths/datasets/monthlyfiguresondeathsregisteredbyareaofusualresidence ↩
-
These data only represent deaths in custody which were referred to a coroner and subsequently reported to the Ministry of Justice in the coroner’s annual return. ↩
-
For further detail please see Figure 11 of ‘Monitoring the Mental Health Act in 2022/23’, available at the following link: https://www.cqc.org.uk/publications/monitoring-mental-health-act/2022-2023/our-activity ↩
-
Safety in custody: quarterly update to December 2023 - GOV.UK (www.gov.uk) ↩
-
https://www.gov.uk/government/statistics/offender-management-statistics-quarterly-july-to-september-2023 ↩
-
Schedule 1 to the Coroners and Justice Act 2009 states that the coroner should suspended an investigation in the event that criminal proceedings may or will take place. ↩
-
Conclusions are recorded after an inquest. Which means the conclusions recorded in a certain year may relate to deaths from the same year or earlier years. ↩
-
For years 2007-2013 this includes the previously used conclusions “Dependence on drugs” and “Non-dependent abuse on drugs” ↩
-
An analysis on unclassified conclusions can be found in the Coroners Statistics 2012 publication (Annex A), available at: www.gov.uk/government/statistics/coroners-statistics ↩
-
Total percentages may not equal 100% due to rounding ↩
-
‘All other conclusions’ includes: Killed lawfully; Killed unlawfully; Lack of care or self-neglect; Stillborn and represent together less than 1% of the short-form conclusions recorded. ↩
-
The sex of the deceased is based on the ‘registrable particulars’ which coroners have a duty to record. Death certificates only give two options, ‘male’ and ‘female’, and these will normally be completed by the registrar based on the information given to them by the informant. Under normal circumstances there would not be an investigation to ascertain whether what the informant says corresponds to biological sex or DNA of the deceased. ↩
-
Stillborn was excluded from above, as there was only 2 such inquest conclusions in 2023. ↩
-
ONS data is available online at: www.ons.gov.uk/peoplepopulationandcommunity/birthsdeathsandmarriages/deaths/datasets/deathsregisteredinenglandandwalesseriesdrreferencetables ↩
-
The ‘age not known’ category has been excluded from the chart due to small numbers (less than 0.5%). Totals may not add up to 100% due to rounding. ↩
-
A direct average of the time taken to process an inquest cannot be calculated from the summary data collected; an estimate has therefore been made instead. Please see the Guide to the Coroners statistics published alongside this report for the methodology used. ↩
-
Only deaths occurring within England and Wales are included in this estimation. ↩
-
The latest Department for Digital, Culture, Media & Sport (DCMS) figures are for 2022 and showed there were 1,368 finds reported in England and Wales, in line with the 1,087 treasure finds reported to Coroner Areas in 2022. These figures can be found at: https://www.gov.uk/government/statistics/statistical-release-for-reported-treasure-finds-2021-and-2022 ↩
-
Thousands more treasures to be saved for the nation as rules about discoveries are changed - GOV.UK (www.gov.uk) ↩
-
This chart does not include reported findings under “Treasure Trove” ↩
-
As the ONS death registration figures are based on the area of usual residence whereas the coroners’ figures are based on the area where a person died, these figures should be used with caution. For example, the coroner office for the City of London shows a distorted figure above 100% due to the low level of residence and high level of commuters. ↩
-
Provisional figure based on ONS monthly death registration figures for 2023 ↩
-
City of London has been excluded from this analysis due to the percentage of deaths being greater than 100% - please see footnote 21 above for further information. So only 79 coroner areas have been included in this analysis. ↩