Community Life Survey 2021/22: Civic engagement and social action
Updated 3 May 2023
Applies to England

© Crown copyright 2023
This publication is licensed under the terms of the Open Government Licence v3.0 except where otherwise stated. To view this licence, visit nationalarchives.gov.uk/doc/open-government-licence/version/3 or write to the Information Policy Team, The National Archives, Kew, London TW9 4DU, or email: psi@nationalarchives.gov.uk.
Where we have identified any third party copyright information you will need to obtain permission from the copyright holders concerned.
This publication is available at https://www.gov.uk/government/statistics/community-life-survey-202122/community-life-survey-202122-civic-engagement-and-social-action
The Community Life Survey is a household self-completion survey (online survey, with paper survey for adults not digitally engaged) of adults aged 16+ in England. This chapter summarises results related to civic engagement and social action from the 2021/22 survey, which ran from October 2021 to September 2022.
Differences between groups are only reported on in this publication where they are statistically significant i.e. where we can be confident that the differences seen in our sampled respondents reflect the population.[footnote 1]
1. Civic participation
Civic participation is defined in the survey as engagement in democratic processes, both in person and online, including contacting a local official (such as a local councillor or MP), signing a petition, or attending a public rally (excludes voting).
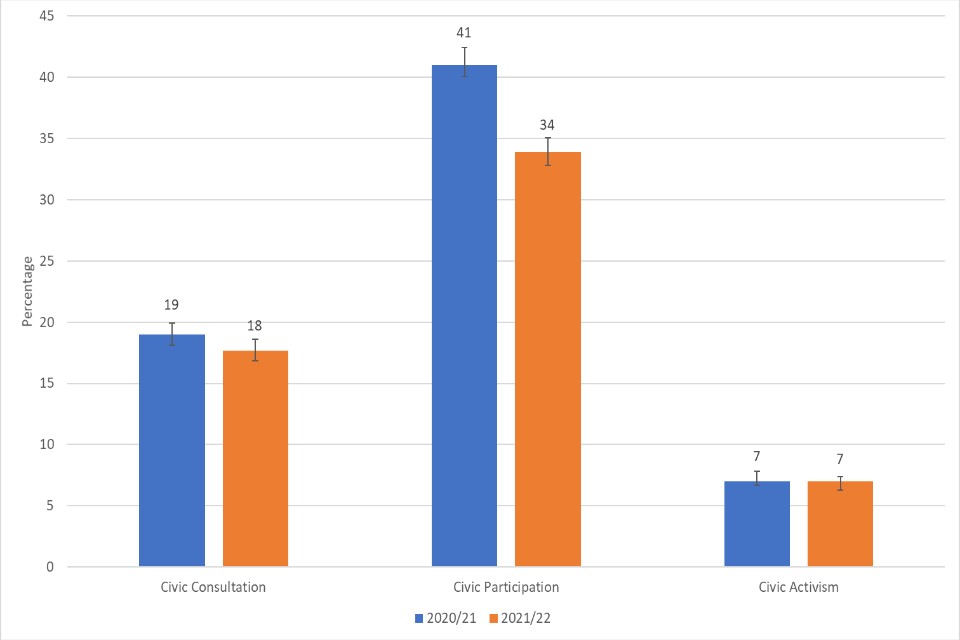
In 2021/22, 34% of respondents said they had engaged in some form of civic participation at least once in the last 12 months. This is a decrease in reported participation in 2020/21 (41%).
When looking across demographics:
Respondents who identified as female were more likely to engage in civic participation than those who identified as male (36% vs 32% respectively). Engagement was lower in 2021/22 than 2020/21 for both males and females (39% and 44% respectively).[footnote 2]
Those aged 75+ were less likely to have engaged in civic participation (22%) than all other age groups (32 - 38%). Respondents in all age groups aside from those aged 65-74 and 75+ were less likely to engage in 2021/22 than in 2020/21 (32% - 38% compared with 41% - 48%).
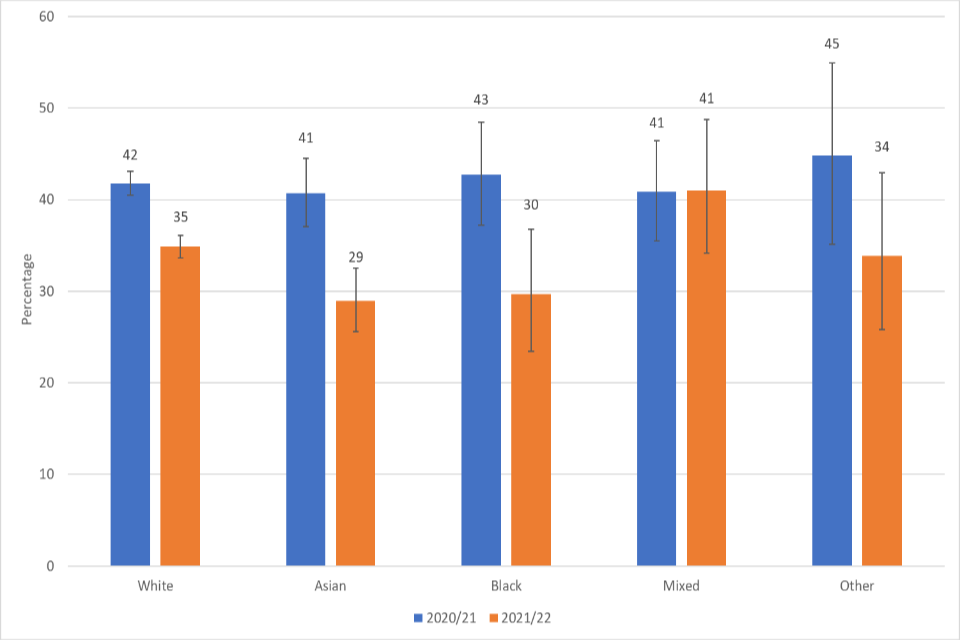
Respondents identifying as being from an Asian ethnic group were less likely to have engaged in civic participation (29%) than those identifying from a white (35%) or mixed (41%) ethnic group. Rates of engagement in 2021/22 for those identifying as from an Asian and a white ethnic group were lower than in 2020/21 (41% and 42% respectively).
Some regional variability was seen whereby respondents in London were more likely to engage in civic participation (42%) than in all other regions (26-36%). All regions, with the exception of the East of England and East Midlands, showed lower engagement than in 2020/21 (26% to 42% in 2021/22 compared with 37% to 47% in 2020/21).
Those living in the least deprived areas showed higher engagement (4th and 5th most deprived quintiles, both 37%) than those in the most deprived areas (27%).
No significant variability was seen between those with or without a disability or long term limiting illness or between respondents from a rural or urban area.
Figure 4.1: Percentage of respondents taking part in civic participation at least once in the 12 months prior to completing the survey by ethnic group, 2020/21 – 2021/22
2. Civic consultation
Civic consultation is defined in the survey as taking part in a consultation about local services or problems in the local area through completing a questionnaire, attending a public meeting or being involved in a face-to-face or online group.
In 2021/22, 18% of respondents took part in civic consultation at least once in the last 12 months, a similar level to 2020/21 (19%).
Those in the 35-49 and 65-74 age groups were more likely to have engaged in civic consultation in the past 12 months than respondents from 16-24, 25-34 and 75 and over (20% vs 14 to 15%).
Respondents identifying as being from a black ethnic group were more likely to engage in civic consultation than respondents identifying as from a white ethnic group (25% vs 17% respectively) .
Respondents from London were more likely to engage in civic consultation (24%) than all other regions (13% - 18%), with the exception of the South West (19%).
Those from the most deprived areas showed lower levels of civic consultation (15%) than those from the 4th most deprived quintile area (21%). There was no significant difference when comparing to the least deprived areas (quintile 5, 19%).
No variability was seen between the different gender or disability categories, or between respondents from rural and urban areas.
3. Civic activism
Civic activism is defined in the survey as involvement in activities in the local community such as being a local councillor, school governor, volunteer special constable or magistrate (for those aged 18 or over). Civic action also includes involvement (in person or online) in decision making groups in the local area, for example, a group making decisions about local health or education services, a tenants’ decision making group or a group set up to tackle local crime problems or to regenerate the local area.
In 2021/22, 7% of respondents had engaged in civic activism at least once in the last 12 months, in line with 2020/21 (7%).
Those aged 16-24 showed lower engagement with civic activism (4%) than 50-64 year olds (8%) and 65-74 year olds (8%).
Respondents identifying as being from a black ethnic group reported higher engagement in civic activism in 2021/22 (14%), compared to 6% for those identifying as from a white ethnic group and 7% from an Asian ethnic group.
Respondents from London were more likely to engage in civic activism (11%) than all other regions (4% to 7%), with the exception of the South West (9%).
No variability was seen between different demographic splits of gender or disability, by deprivation or between respondents living in a rural versus urban area.
Figure 4.2: Percentage of respondents taking part in civic participation, consultation or activism at least once in the 12 months prior to completing the survey, 2020/21 - 2021/22
4. Influencing local decisions
In 2021/22, 27% of respondents either definitely or tended to agree that they personally can influence decisions affecting their local area. This is similar to 2020/21. This figure has not varied much over the last 8 years since data collection began.
When looking across demographics:
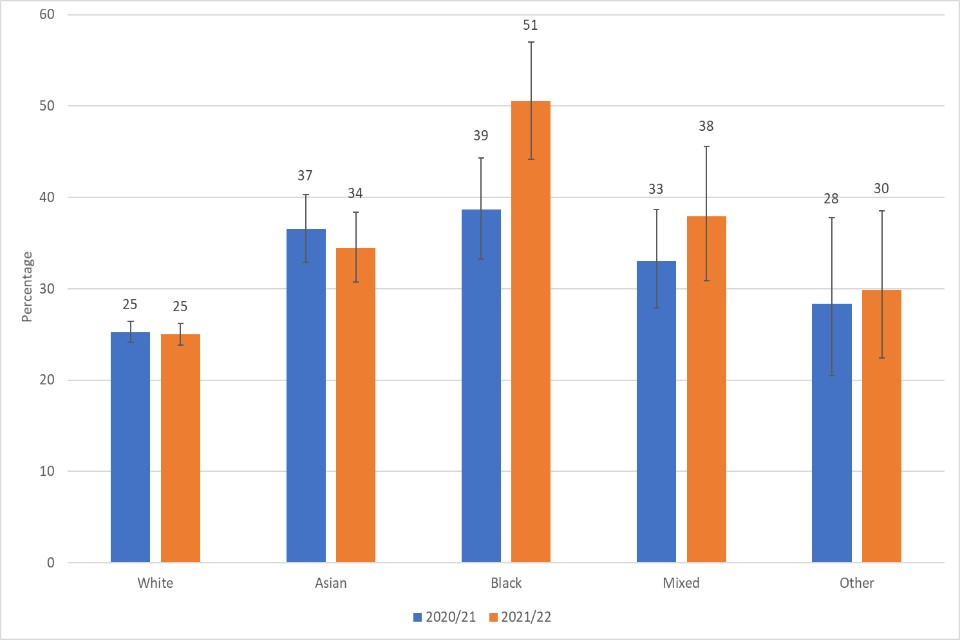
Respondents identifying as being from a black ethnic group (51%) felt more able to influence decisions than respondents identifying as from an Asian ethnic group, white ethnic group or other ethnic group (25% to 34%). This represents a large increase from the previous year, where 39% of respondents identifying as from a black ethnic group agreed that they personally can influence decisions in their local area.
Figure 4.3: Percentage who feel agree they personally can influence decisions affecting their local area by ethnic group, 2021/22
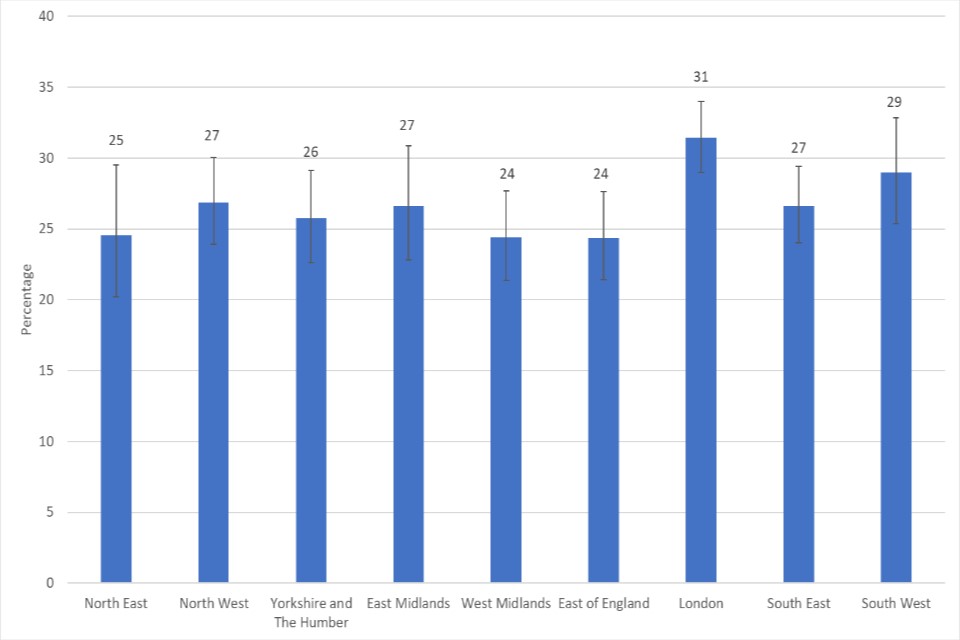
Some regional variability was seen, with those in London (31%) feeling more able to influence decisions than those in the East of England and the West Midlands (24% for both regions).
Figure 4.4: Percentage who feel agree they personally can influence decisions affecting their local area by region, 2021/22
No variability was seen between gender, age, disability, urban/rural status or deprivation categories.
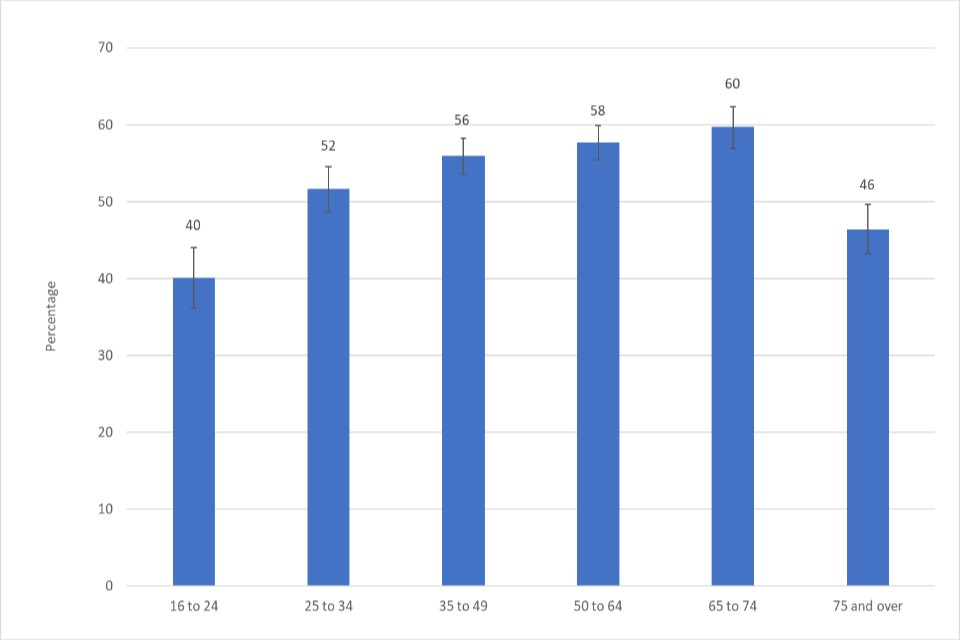
Respondents were asked how important it was for them personally to be able to influence local decisions. In 2021/22, 53% said it was important, in line with levels in 2020/21 (54%).
Respondents from the age groups 65-74 years old were more likely to report that it was important (60%) to have the ability to influence decisions in the local area than those aged 16-24 (40%), 25-34 (52%) or 75 and over (46%).
Figure 4.5: Percentage agreeing it is important to be able to influence decisions in their local area by age, 2021/22
Respondents identifying as being from a black ethnic group were more likely to respond that it was important to influence decisions in their local area (67%) than those identifying as from a white ethnic group or other ethnic group (52% and 51% respectively).
Some regional variability was seen with London showing higher incidence (60%) of responding that it was important to influence decisions in their local area than the North East, the North West, the East Midlands, the West Midlands, the South East and Yorkshire and Humberside (44% to 54%).
The respondents in the least deprived areas (4th quintile, 57%, 5th quintile, 55%) were more likely to say it was important than those from the most deprived areas (49%).
No variability was seen between the gender or disability categories, or between respondents living in rural vs urban areas.
Respondents were asked if generally speaking, they would like to be more involved in the decisions their local council makes which affect their local area. In 2021/22 28% said yes, 20% said no, and 52% said it depends on the issue. This is compared with 50% yes, 48% no, and 2% depends on the issue in 2020/21.[footnote 3]
5. Enabling decision making
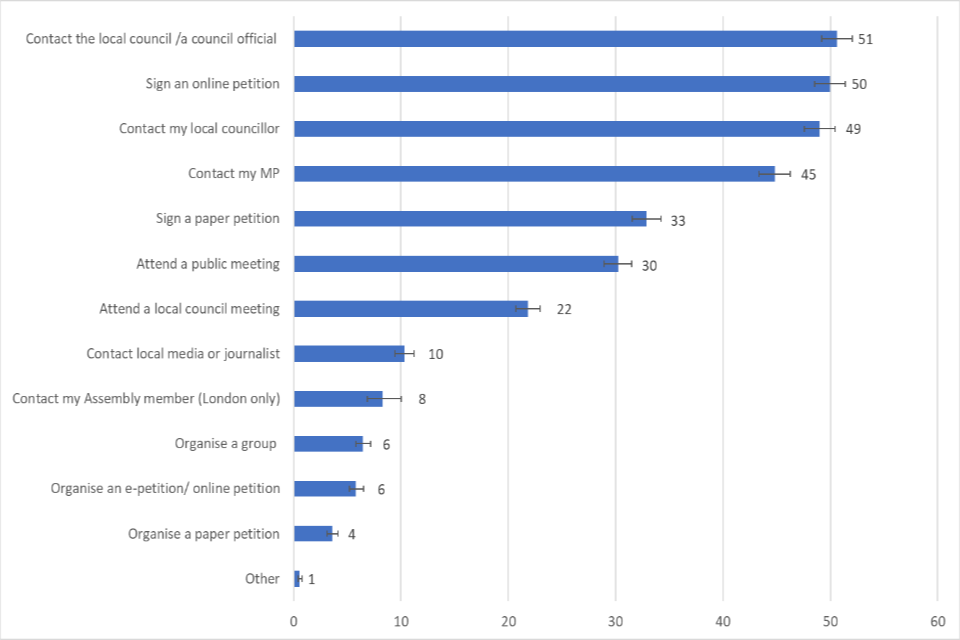
Respondents were asked: ‘If you wanted to influence decisions in your local area how would you go about it?’ and were presented with a list of options, of which they could select all that applied. The three most common responses were ‘sign an online petition’, ‘contact the council/ a council official’, and ‘contact my councillor’, the same as in 2020/21.
Figure 4.6: If you wanted to influence decisions in your local area how would you go about it? - 2021/22
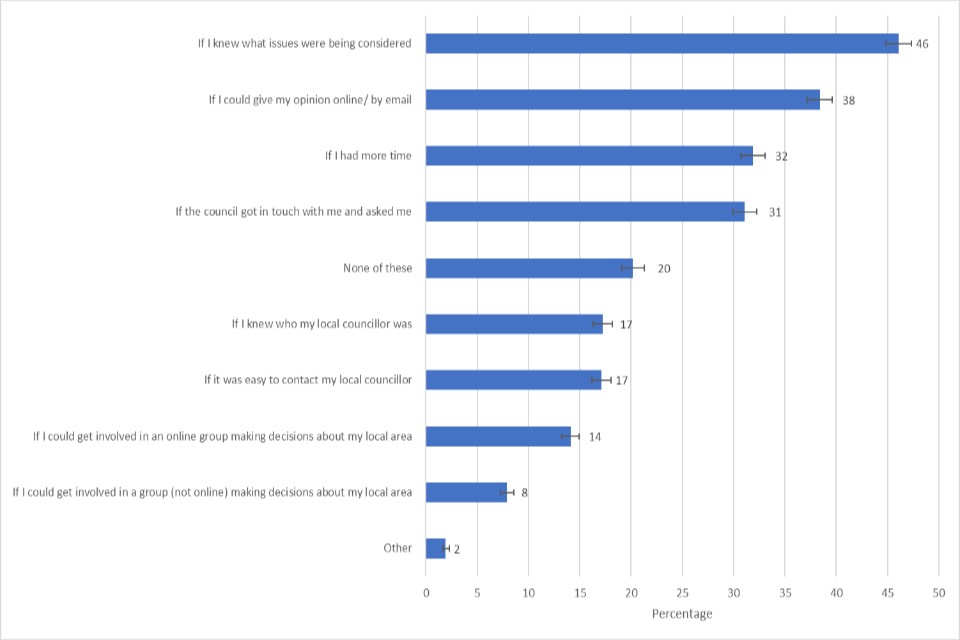
Respondents were then asked, what would make it easier to influence decisions in their local area and asked to select all options that applied. The most common response was ‘If I knew what issues were being considered’, followed by ‘If I could give my opinion online/ by email’ and ‘If I had more time’. These were similar proportions to 2020/21.
Figure 4.7: What would make it easier to influence decisions in the local area? - 2021/22
6. Social action
In the Community Life Survey, social action refers to involvement with issues affecting the local area by doing things like:
- setting up a new service/amenity
- stopping the closure of a service/amenity
- stopping something happening in the local area
- running a local service on a voluntary basis
- helping to organise a street party or community event
This definition of social action has been preserved here for legacy reasons, but the UK government currently defines Social Action as also including all volunteering, civic engagement, and charitable giving.
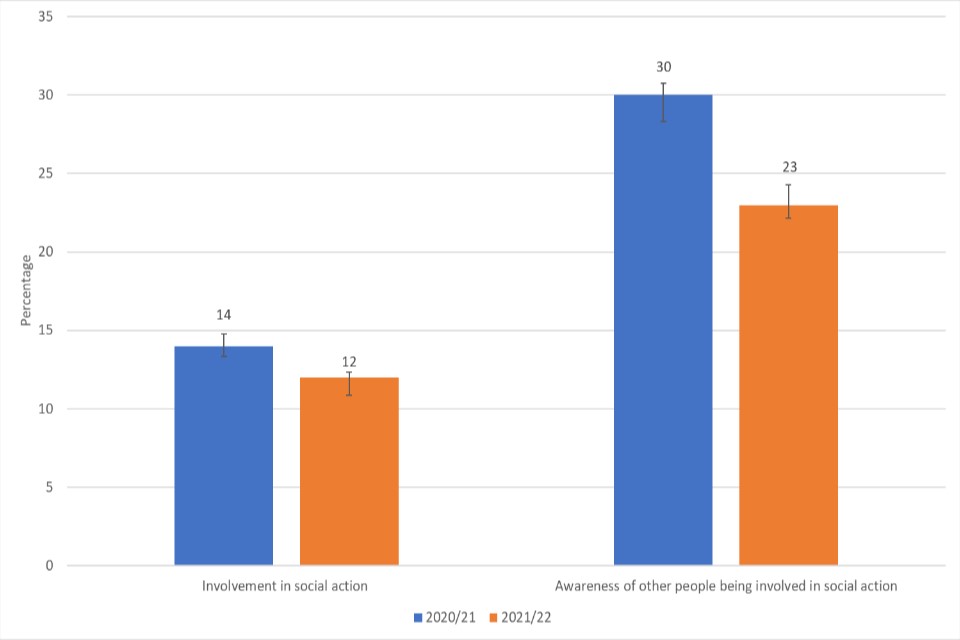
In 2021/22, 12% of respondents had been involved in social action at least once in the last 12 months, lower than in 2020/21 (14%) and the lowest level recorded by the CLS. Awareness of other people being involved in social action was reported by 23% of respondents, lower than 2020/21 (30%) and in 2019/20 (32%).
Figure 4.8: Percentage of respondents who had been involved in social action and who were aware of others being involved, 2020/21 – 2021/22
For being personally involved with social action:
The 65-74 year old age groups showed a higher incidence of social action (15%) than those ages 16-24 (8%) and 25-34 (9%). Those in the 16-24 age group showed a lower involvement in social action than in 2020/21 (13%). No variability from 2020/21 to 2021/22 was seen in other age groups.
Respondents identifying as being from a mixed ethnic group were more likely to have participated in social action (18%) than those identifying as from a white ethnic background (12%) or Asian ethnic background (10%).
Those living in London were more likely to have participated in social action (15%) than those in the North East (8%), North West (10%) or Yorkshire and The Humber (6%).
Those living in rural areas were more likely to have participated in social action (16%) than those living in urban areas (11%).
A higher proportion of respondents in the least deprived areas (quintiles 4 and 5, both 14%) had participated in social action than those from the most deprived areas (8%).
No variability was seen between gender or disability categories.
-
The 95% confidence intervals are indicated by error bars on the charts. They show the range that we are 95% confident the true value for the population falls between. When there is no overlap between the error bars for two or more groups, we can be more confident that the differences between groups represent true differences between these groups in the population. ↩
-
Respondents who reported their gender as ‘other’ have not been included in this chart due to the number of respondents being small and therefore potentially disclosive. ↩
-
In 2021/22, the option ‘depends on the issue’ was presented alongside the options ‘Yes’ and ‘No’, whereas in 2020/21 the options ‘Yes and ‘No’ were presented, and then the respondent could click onto the next page for more answer options. This change is likely to have increased the number of respondents selecting ‘depends on the issue’ in 2021/22, however it is less clear how this would have impacted the other two response options. ↩