Yorkshire Water EPA data report 2019
Published 2 October 2020
Applies to England

© Crown copyright 2020
This publication is licensed under the terms of the Open Government Licence v3.0 except where otherwise stated. To view this licence, visit nationalarchives.gov.uk/doc/open-government-licence/version/3 or write to the Information Policy Team, The National Archives, Kew, London TW9 4DU, or email: psi@nationalarchives.gov.uk.
Where we have identified any third party copyright information you will need to obtain permission from the copyright holders concerned.
This publication is available at https://www.gov.uk/government/publications/water-and-sewerage-companies-in-england-environmental-performance-report-2019/yorkshire-water-epa-data-report-2019
This report provides company specific data and information on the Environmental Performance Assessment (EPA) metrics. It contains current year and historic performance data. For further information on what each EPA metric means see our EPA metric guide.
In addition to the EPA metrics this report contains a section on event duration monitoring (EDM) delivery. For a comparison between water companies and wider regulatory information see the Environmental performance of the water and sewerage companies in 2019 report.
We set targets for each EPA metric. Company performance is then given a red, amber or green (RAG) status:
- red - performance significantly below target
- amber - performance close to or slightly below target
- green - performance better than target
The thresholds are reviewed every 5 years.
1. EPA performance star rating
Annual performance star rating after assessment of Yorkshire Water’s performance across all EPA metrics
| Year | Overall EPA star rating (out of 4) | Star rating description |
|---|---|---|
| 2019 | ★★★☆ | Good company |
| 2018 | ★★☆☆ | Company requires improvement |
| 2017 | ★★★☆ | Good company |
| 2016 | ★★★☆ | Good company |
| 2015 | ★★★☆ | Above average company |
| 2014 | ★★★★ | Industry leading company |
| 2013 | ★★★☆ | Above average company |
| 2012 | ★★☆☆ | Below average company |
| 2011 | ★★☆☆ | Below average company |
2. Total pollution incidents (sewerage) metric (category 1 to 3)
Main facts
For 2019:
- 181 actual incidents
- 63% fewer incidents per 10,000km sewer than in 2011
- 52,045km sewer length
Annual number of pollution incidents (category 1 to 3) from Yorkshire Water sewerage assets, with EPA rating
2011 to 2015 data
| Year | 2011 | 2012 | 2013 | 2014 | 2015 |
|---|---|---|---|---|---|
| EPA status | amber | amber | amber | amber | amber |
| Incidents per 10,000km sewer | 94 | 83 | 78 | 59 | 72 |
| Actual incident numbers | 289 | 253 | 239 | 180 | 219 |
2016 to 2020 data
| Year | 2016 | 2017 | 2018 | 2019 | 2020 |
|---|---|---|---|---|---|
| EPA status | amber | amber | amber | amber | N/A |
| Incidents per 10,000km sewer | 46 | 43 | 44 | 35 | N/A |
| Actual incident numbers | 240 | 225 | 229 | 181 | N/A |
Annual number of pollution incidents (category 1 to 3) from Yorkshire Water sewerage assets, also showing EPA status and thresholds
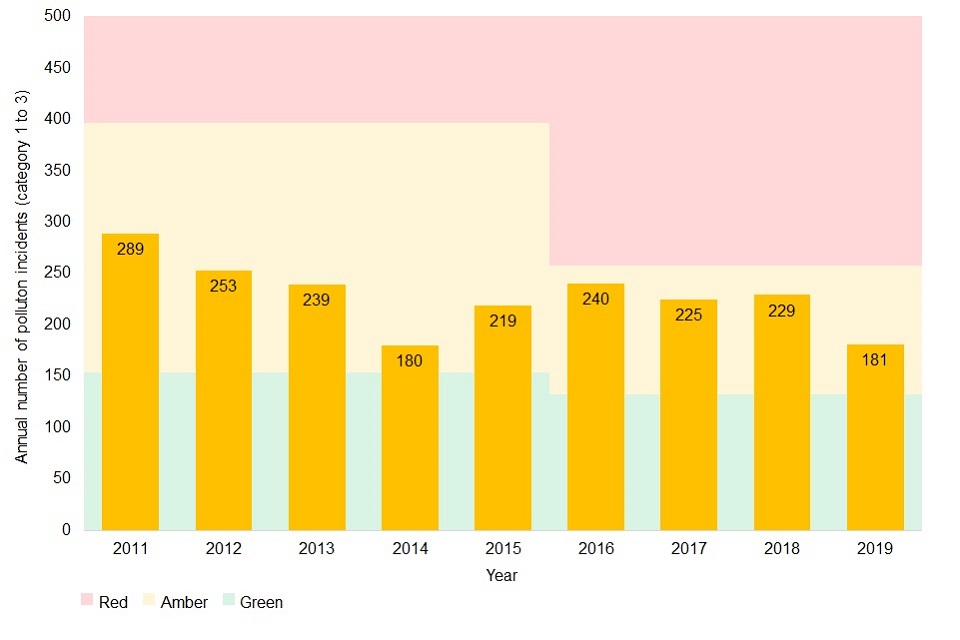
Graph note: the thresholds for a RAG status are shown in the graph background. EPA thresholds for normalised incidents (per 10,000km sewer) are shown in the EPA metric guide. They are revised every 5 years. Sewer length data was collected in 2011, then reviewed and adjusted where necessary in following years. Sewer length affects the actual number of incidents required to fall within a particular RAG status:
- green status for Yorkshire Water was equivalent to ≤154 actual incidents in 2011 to 2015 and ≤132 in 2016 to 2019
- red status for Yorkshire Water was equivalent to ≥397 actual incidents in 2011 to 2015 and ≥258 in 2016 to 2019
Number of pollution incidents (category 1 to 3) from Yorkshire Water sewerage and clean water supply assets in 2019
| Asset type | Number of pollution incidents (category 1 to 3) |
|---|---|
| Combined sewer overflow | 14 |
| Foul sewer | 101 |
| Other water industry premises | 2 |
| Pumping station | 19 |
| Rising main | 8 |
| Sewage treatment works | 34 |
| Storm tank | 0 |
| Surface water outfall | 3 |
| Water distribution system (clean)* | 27 |
| Water treatment works (clean)* | 0 |
*Water distribution system (clean water supply) and water treatment works (clean water supply) are not part of the EPA total pollution incident (sewerage) metric.
For sewerage pollution incidents (category 1 to 3) we expect all water companies to achieve green EPA status (≤25 incidents per 10,000km sewer) by 2020.
For 2019:
- 35 sewerage pollution incidents (category 1 to 3) per 10,000km of sewer - this is rated as amber
- performance was better than the sector average (37) for sewerage pollution incidents (category 1 to 3) per 10,000km of sewer
- needed ≤132 actual sewerage pollution incidents (category 1 to 3) to be rated as green
3. Serious pollution incidents (sewerage) metric (category 1 and 2)
Main facts
For 2019:
- 7 actual serious incidents
- 69% fewer serious incidents per 10,000km sewer than in 2011
Annual number of serious pollution incidents (category 1 and 2) from Yorkshire Water sewerage assets, with EPA rating
2011 to 2015 data
| Year | 2011 | 2012 | 2013 | 2014 | 2015 |
|---|---|---|---|---|---|
| EPA status | red | amber | amber | green | amber |
| Serious incidents per 10,000km sewer | 4.2 | 1.6 | 3.3 | 1.3 | 1.6 |
| Actual serious incident numbers | 13 | 5 | 10 | 4 | 5 |
2016 to 2020 data
| Year | 2016 | 2017 | 2018 | 2019 | 2020 |
|---|---|---|---|---|---|
| EPA status | amber | amber | red | amber | N/A |
| Serious incidents per 10,000km sewer | 1.2 | 0.8 | 2.3 | 1.3 | N/A |
| Actual serious incident numbers | 6 | 4 | 12 | 7 | N/A |
Annual number of serious pollution incidents (category 1 and 2) from Yorkshire Water sewerage assets, also showing EPA status and thresholds
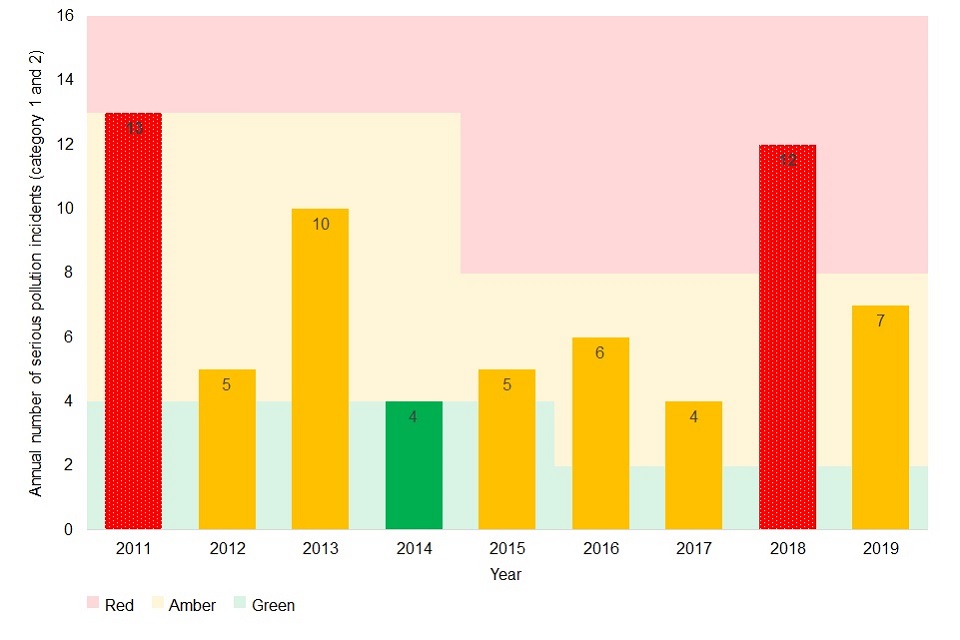
Graph note: the thresholds for a RAG status are shown in the graph background. EPA thresholds for normalised incidents (per 10,000km sewer) are shown in the EPA metric guide. They are revised every 5 years. Sewer length data was collected in 2011, then reviewed and adjusted where necessary in following years. Sewer length affects the actual number of serious incidents required to fall within a particular RAG status:
- green status for Yorkshire Water was equivalent to ≤4 actual serious incidents in 2011 to 2015 and ≤2 in 2016 to 2019
- red status for Yorkshire Water was equivalent to ≥13 actual serious incidents in 2011 to 2015 and ≥8 in 2016 to 2019
Number of serious pollution incidents (category 1 and 2) from Yorkshire Water sewerage and clean water supply assets in 2019
| Asset type | Number of serious pollution incidents (category 1 and 2) |
|---|---|
| Combined sewer overflow | 1 |
| Foul sewer | 5 |
| Other water industry premises | 0 |
| Pumping station | 1 |
| Rising main | 0 |
| Sewage treatment works | 0 |
| Storm tank | 0 |
| Surface water outfall | 0 |
| Water distribution system (clean)* | 0 |
| Water treatment works (clean)* | 0 |
*Water distribution system (clean) and water treatment works (clean) are not part of the EPA serious pollution incident (sewerage) metric.
For serious sewerage pollution incidents (category 1 and 2) we expect all water companies to achieve green EPA status (≤0.5 incidents per 10,000km sewer) by 2020.
For 2019:
- 1.3 serious sewerage pollution incidents (category 1 and 2) per 10,000km of sewer - this is rated as amber
- performance was worse than the sector average (0.9) for serious sewerage pollution incidents (category 1 and 2) per 10,000km of sewer
- needed ≤2 serious sewerage pollution incidents (category 1 and 2) to be rated as green
4. Discharge permit compliance metric
Main facts
For 2019:
- 294 permitted sewage treatment works (STW)
- 22 permitted water treatment works (WTW)
Annual discharge permit compliance (STW and from 2016 includes WTW) for Yorkshire Water, with EPA rating
2011 to 2015 data
| Year | 2011 | 2012 | 2013 | 2014 | 2015 |
|---|---|---|---|---|---|
| EPA status | amber | red | amber | green | green |
| Percentage permit compliance | 97.3 | 95.2 | 98.0 | 99.3 | 99.3 |
| Number of permitted STW discharges | 295 | 294 | 297 | 299 | 295 |
| Number of non-compliant STW | 8 | 14 | 6 | 2 | 2 |
2016 to 2020 data
| Year | 2016 | 2017 | 2018 | 2019 | 2020 |
|---|---|---|---|---|---|
| EPA status | amber | amber | amber | amber | N/A |
| Percentage permit compliance | 97.2 | 97.8 | 97.5 | 97.5 | N/A |
| Number of permitted STW discharges | 298 | 293 | 293 | 294 | N/A |
| Number of permitted WTW discharges | 20 | 21 | 21 | 22 | N/A |
| Number of non-compliant STW | 7 | 7 | 7 | 5 | N/A |
| Number of non-compliant WTW | 2 | 0 | 1 | 3 | N/A |
Annual discharge permit compliance (STW and from 2016 includes WTW) for Yorkshire Water, also showing EPA status and thresholds
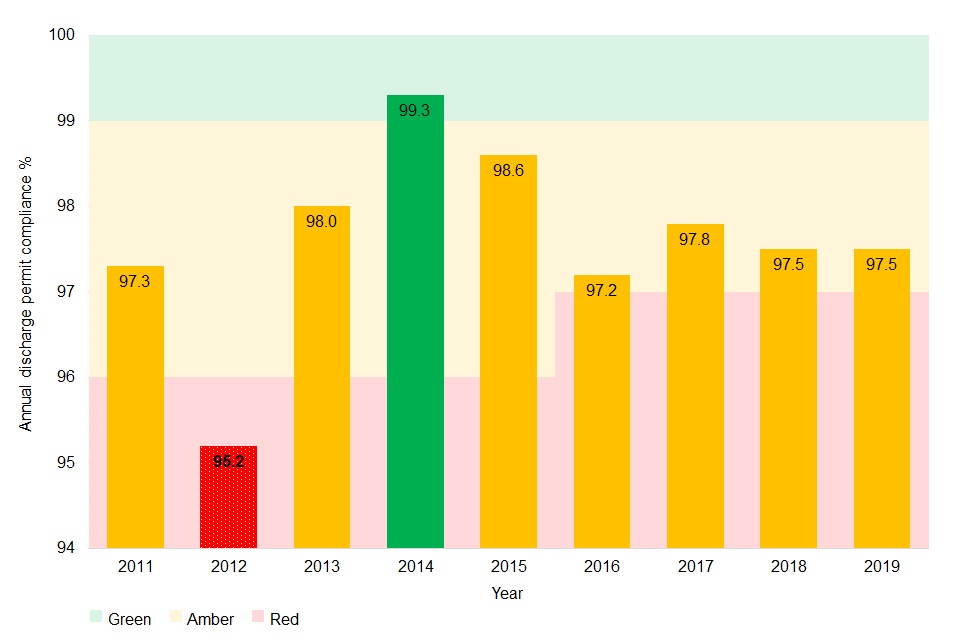
Graph note: the thresholds for a RAG status are shown in the graph background and in the EPA metric guide. They are revised every 5 years.
For discharge permit compliance we expect all water companies to achieve green EPA status (99%) by 2020.
For 2019:
- 97.5% discharge permit compliance - this is rated as amber
- 98.3% discharge permit compliance at STW and 86.4% discharge permit compliance at WTW
- performance was worse than the sector average (98.7%) for discharge permit compliance
- needed ≤3 failing sites to be rated as green
5. Self-reporting of pollution incidents metric
Main facts
For 2019:
- 73% incidents self-reported
- 152 incidents self-reported
- 56 incidents reported by others
Annual self-reporting of pollution incidents (category 1 to 3) from Yorkshire Water sewerage and clean water supply assets, with EPA rating
2011 to 2015 data
| Year | 2011 | 2012 | 2013 | 2014 | 2015 |
|---|---|---|---|---|---|
| EPA status | green | green | green | green | green |
| Percentage of incidents self-reported | 75 | 78 | 80 | 77 | 76 |
| Number of incidents self-reported | 233 | 205 | 204 | 151 | 181 |
2016 to 2020 data
| Year | 2016 | 2017 | 2018 | 2019 | 2020 |
|---|---|---|---|---|---|
| EPA status | green | green | amber | amber | N/A |
| Percentage of incidents self-reported | 79 | 83 | 73 | 73 | N/A |
| Number of incidents self-reported | 208 | 213 | 191 | 152 | N/A |
Annual self-reporting of pollution incidents (category 1 to 3) from Yorkshire Water sewerage and clean water supply assets, also showing EPA status and thresholds
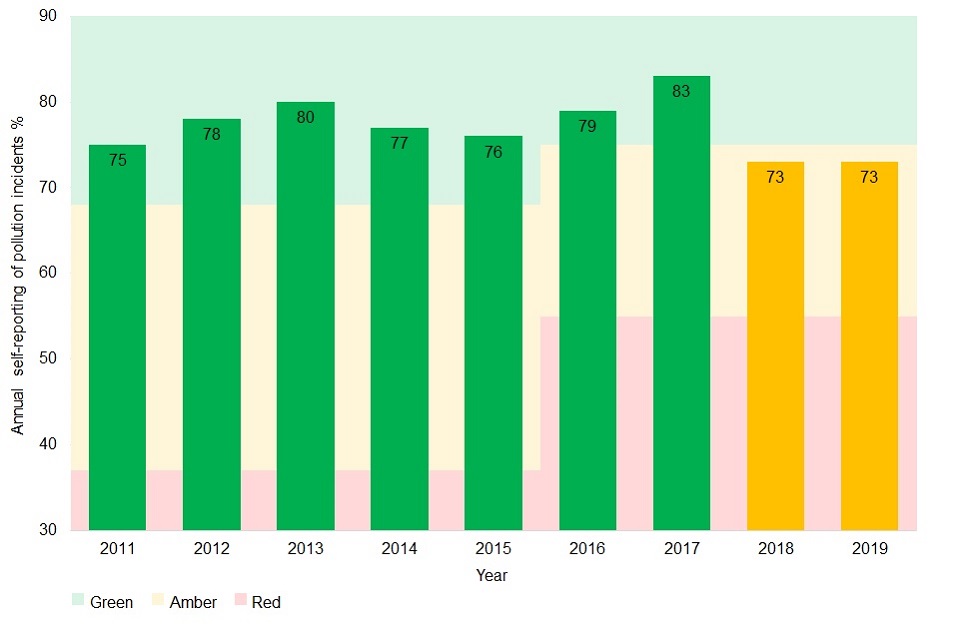
Graph note: the thresholds for a RAG status are shown in the graph background and in the EPA metric guide. They are revised every 5 years.
Self-reporting of pollution incidents (category 1 to 3) from Yorkshire Water sewerage and clean water supply assets in 2019
| Asset type | Number of pollution incidents self-reported (category 1 to 3) | Number of pollution incidents not self-reported (category 1 to 3) |
|---|---|---|
| Combined sewer overflow | 9 | 5 |
| Foul sewer | 68 | 33 |
| Other water industry premises | 2 | 0 |
| Pumping station | 15 | 4 |
| Rising main | 5 | 3 |
| Sewage treatment works | 27 | 7 |
| Storm tank | 0 | 0 |
| Surface water outfall | 2 | 1 |
| Water distribution system (clean) | 24 | 3 |
| Water treatment works (clean) | 0 | 0 |
Self-reporting of serious pollution incidents (category 1 and 2) from Yorkshire Water sewerage and clean water supply assets in 2019
| Asset type | Number of pollution incidents self-reported (category 1 and 2) | Number of pollution incidents not self-reported (category 1 and 2) |
|---|---|---|
| Combined sewer overflow | 0 | 1 |
| Foul sewer | 3 | 2 |
| Other water industry premises | 0 | 0 |
| Pumping station | 0 | 1 |
| Rising main | 0 | 0 |
| Sewage treatment works | 0 | 0 |
| Storm tank | 0 | 0 |
| Surface water outfall | 0 | 0 |
| Water distribution system (clean) | 0 | 0 |
| Water treatment works (clean) | 0 | 0 |
For self-reporting of pollution incidents we expect all water companies to achieve green EPA status (≥75%) by 2020.
For 2019:
- 73% self-reporting of pollution incidents - this is rated as amber
- performance was worse than the sector average (80%) for self-reporting of pollution incidents
6. National Environment Programme (NEP) delivery metric
Main facts
For the financial year ending 2020:
- 98 schemes were completed to the planned deadline
- 2 schemes were not completed to the planned deadline
Annual delivery of the NEP by Yorkshire Water, with EPA rating
Data for financial years ending 2012 to 2016
| Financial year ending | 2012 | 2013 | 2014 | 2015 | 2016 |
|---|---|---|---|---|---|
| Asset Management Plan (AMP) | AMP5 | AMP5 | AMP5 | AMP5 | AMP6 |
| EPA status | green | green | green | green | green |
| Percentage of NEP complete to date (cumulative) | 100 | 130 | 132 | 100 | 100 |
| Cumulative number of schemes completed during AMP period | 46 | 83 | 98 | 109 | 1 |
Data for financial years ending 2017 to 2021
| Financial year ending | 2017 | 2018 | 2019 | 2020 | 2021 |
|---|---|---|---|---|---|
| Asset Management Plan (AMP) | AMP6 | AMP6 | AMP6 | AMP6 | AMP7 |
| EPA status | green | green | green | green | N/A |
| Percentage of NEP complete to date (cumulative) | 100 | 100 | 100 | 99.2 | N/A |
| Cumulative number of schemes completed during AMP period | 34 | 99 | 144 | 242 | N/A |
Table note: AMP5 schemes that were completed early before their planned year were included in the cumulative delivery percentage (in some cases resulting in percentages over 100%). AMP6 schemes that were completed early before their planned year were not included in the cumulative delivery percentage until their planned year (cannot report over 100%). The thresholds for each RAG status are in the EPA metric guide. They are revised every 5 years.
For NEP delivery we expect all water companies to achieve green EPA status (≥99%) in any year.
For the financial year ending 2020:
- 99.2% NEP delivery - this is rated as green
7. Sludge disposal and use metric
Main facts
For 2019:
- 75,797t (tonnes) total volume produced (dry matter)
- 17,370ha (hectares) land used for spreading
- 95% of sludge produced was used in agriculture
Annual compliance with sludge disposal and use metric by Yorkshire Water, with EPA ratings
2011 to 2015 data
| Year | 2011 | 2012 | 2013 | 2014 | 2015 |
|---|---|---|---|---|---|
| EPA status | green | amber | green | green | green |
| Percentage of sludge compliant | 100 | 99.7 | 100 | 100 | 100 |
2016 to 2020 data
| Year | 2016 | 2017 | 2018 | 2019 | 2020 |
|---|---|---|---|---|---|
| EPA status | green | green | N/A | N/A | N/A |
| Percentage of sludge compliant | 100 | 100 | N/A | N/A | N/A |
Table note: from the 2018 calendar year, we suspended the metric from the EPA whilst we reviewed our regulatory regime for sludge. The thresholds for each RAG status are in the EPA metric guide. They are revised every 5 years.
Annual summary of sewage sludge disposal and use (dry matter) by Yorkshire Water
| Year | Sewage sludge used in agriculture (tonnes thousands) | Sewage sludge recovered non-agriculture (tonnes thousands) | Sewage sludge disposed (tonnes thousands) | Actual quantity produced (tonnes thousands) |
|---|---|---|---|---|
| 2011 | 93.5 | 16.1 | 59.5 | 169.1 |
| 2012 | 65.6 | 6.3 | 43.0 | 114.9 |
| 2013 | 8.7 | 114.5 | 42.8 | 166.0 |
| 2014 | 34.8 | 59.6 | 25.9 | 120.3 |
| 2015 | 37.6 | 67.1 | 22.5 | 127.3 |
| 2016 | 68.0 | 64.3 | 0.0 | 132.3 |
| 2017 | 62.7 | 38.5 | 2.8 | 103.9 |
| 2018 | 65.6 | 36.9 | 4.4 | 106.9 |
| 2019 | 71.8 | 4.0 | 0.0 | 75.8 |
8. Security of Supply Index (SoSI) metric
Main facts
For the financial year ending 2020:
- 2 water resource zones
- 1,250 Ml/d water distributed to the network (megalitres)
Annual compliance with SoSI by Yorkshire Water, with EPA ratings
| Financial year ending | 2017 | 2018 | 2019 | 2020 | 2021 |
|---|---|---|---|---|---|
| EPA status | green | green | green | green | N/A |
| SoSI score | 100 | 100 | 100 | 100 | N/A |
Table note: the thresholds for each RAG status are in the EPA metric guide.
For SoSI we expect all water companies to achieve green EPA status by 2020.
For the financial year ending 2020:
- score 100 - this is rated as green
9. Event Duration Monitoring (EDM) delivery
All water companies have investment in place to monitor the vast majority of storm overflows.
Installation of EDM monitors is mostly funded through the NEP however does not form part of the EPA NEP delivery metric.
Number of Yorkshire Water storm overflows with EDM
| Year | 2019 |
|---|---|
| Total number of storm overflows | 2,246 |
| Number of storm overflows with annual data reported | 734 |
| Percentage company coverage | 33 |