The stability of the early years workforce in England
Published 5 August 2020
Applies to England

© Crown copyright 2020
This publication is licensed under the terms of the Open Government Licence v3.0 except where otherwise stated. To view this licence, visit nationalarchives.gov.uk/doc/open-government-licence/version/3 or write to the Information Policy Team, The National Archives, Kew, London TW9 4DU, or email: psi@nationalarchives.gov.uk.
Where we have identified any third party copyright information you will need to obtain permission from the copyright holders concerned.
This publication is available at https://www.gov.uk/government/publications/the-stability-of-the-early-years-workforce-in-england/the-stability-of-the-early-years-workforce-in-england
The stability of the early years workforce in England
An examination of national, regional and organisational barriers
Research report, August 2020
1. Foreword
The first five years of a child’s life are critical to their future development. This is not disputed. During this period, stark development gaps often appear between children from poorer and more affluent backgrounds. Key to closing these gaps – which influence life chances – are nursery workers and child minders. But what do we know about the early years workforce and do we value them enough? Are the 280,000 people who look after and educate our children becoming our forgotten key workers?
The system for educating, developing and supporting the under-fives is fragmented and does not lend itself to an easily implementable strategy, as the Children’s Commissioner has recently highlighted. New initiatives are hard to make work. Funding is tight and providers are stretched, while geography makes life difficult. The mix of provision in the private, voluntary and public sectors compounds this further.
The Social Mobility Commission has focused its research on why the early years workforce is so unstable – why recruitment is so difficult and why so many leave shortly after they join. The report also includes several profiles of those working in early years, giving a vital insight into the difficulties some face.
The research findings are startling. The average wage in the early years workforce is £7.42 an hour – well below the minimum wage and the average pay of £11.37 an hour across the female workforce. A substantial proportion are paid under £5.00 an hour. Work demands, including considerable amounts of paperwork, are high, often leading to burnout and an early exit. There are also significant regional differences in the data, suggesting some levelling up is needed across the country.
The research does show that many of the workers are passionate about the job they do and report higher levels of happiness than the total working population. But more than one in six leave within a year, according to one recent study.
Women and young people dominate the workforce, which can also contribute to higher turnover. Over 95% of the workforce are women and 40% are younger than 30, with many taking time off for career breaks. Crucially, there is not enough training or professional development. So relations between managers and staff break down following unrealistic expectations.
The inevitable conclusion is that each of these findings are both reasons for and consequences of a society that does not value the early years workforce as it should. The intellectual challenge is significant, yet wages are low and not enough support exists to support staff to meet that challenge.
There are excellent workers employed in the sector, but to ensure a consistent high-quality early years workforce, it will take a monumental effort to change the perception of an entire sector. And it also does not happen overnight. But as we try to build back better and learn the lessons of the pandemic, there is no better time. We should not see this as too ambitious – it matters too much.
The Commission recommends a first step: a comprehensive strategy that includes a clear training pathway from apprentice to primary school head. We also propose a workforce registry that would enable a sense of belonging and a community for meaningful professional development at each stage. In addition, we urge the government to ensure that resources for early years match the operational costs of funded places.
We are all too aware that strategies have come and gone before. The government’s big majority and four remaining years give it enough time to commit to this. If it commits, if it takes the sector with it, there may be a fighting chance. We can no longer afford to ignore this group of key workers so critical to social mobility.
Sandra Wallace and Steven Cooper
Interim Co-Chairs, Social Mobility Commission
2. Executive summary
By the time children are five, those from disadvantaged families are already significantly behind their wealthier peers in a variety of development measures. Key to reducing this gap is high- quality early years (EY) provision, delivered by a qualified and skilled workforce. However, in recent years, there have been signs that the early years workforce is increasingly unstable, with too few new entrants to replace those who are leaving the sector. In this report, we examine key factors that appear to be associated with instability in the early years workforce and provide recommendations on how to address the most pressing issues.
We conducted a review of the relevant literature; an analysis of quantitative data covering a large representative sample of workers in England; and 40 interviews with early years practitioners, setting managers and local policy-makers. The most common barriers identified in all three strands of research were pay, work demands, certain demographic characteristics, training and the organisational climate of the early years provider.
We found that:
2.1 Pay
Evidence from several studies suggests that pay is associated with practitioners’ propensity to leave their employer and/or the sector altogether. In England, the average wage across the EY workforce is £7.42 per hour – slightly higher than the average wage in the retail sector (£7.09) and much lower than pay across the female workforce (£11.37). The EY practitioners we spoke to struggled to meet their living costs and moved to other employers for even a small increase, or left the EY sector for other low-skilled work where wages were higher.
2.2 Work demands
High work demands contribute to turnover among EY practitioners primarily because they can lead to burnout. The literature highlighted several sources of excessive work demands in the EY sector, including long hours and unpaid work, having to care for too many children at once, and having too much paperwork to complete. In England, EY professionals work longer hours than people in comparable occupations: 11% of full-time EY workers reported working more than 42 hours per week, compared with 3% of retail workers, 6% of female workers and 13% of the total working population. Interview participants described long hours, inadequate working conditions and considerable amounts of paperwork as causes of exhaustion and low morale, feeding a desire to leave EY for less-demanding work.
2.3 Demographic characteristics
Age and gender were frequently discussed in the literature. Younger workers, with less experience, responsibility and commitment to the sector, may be more likely to leave the workforce than older workers, except for those approaching retirement. Meanwhile, some short- term instability can be determined by women taking time off for career breaks such as maternity leave. The English EY workforce is predominantly composed of young, female workers: 40% are younger than 30, and 96% are female.
2.4 Training and continuing professional development
There is some evidence to suggest that EY workers whose employer offers high-quality and relevant training, advice and professional support, and who are compensated for the time they take to train, are more likely to remain with their employer. Yet existing studies suggest that practitioners do not receive the amount of training and continuous professional development (CPD) they consider adequate.
Interview participants told us they felt that the entry-level qualifications held by junior staff entering the sector were often inadequate preparation for the job. For those looking to upskill after entering the workforce, participants told us that there was rarely anything more advanced than a basic course offered by the council, while higher-level qualifications were costly to attain.
2.5 Organisational climate and culture
The literature suggests that certain aspects of organisational climate and culture in EY settings – such as pre-existing staff stability and positive management practices – are associated with staff retention. Interview participants said they were more likely to work long term in an EY setting where management supported staff, involved them in decision-making and fostered mutually supportive relationships between them.
2.6 Context
The DfE’s Early Years Workforce Strategy (2017) aimed to support the development of a well-qualified workforce with the appropriate knowledge, skills and experience to deliver high-quality early education and childcare for young children. Some positive steps have been taken: for example, the revision of Level 2 and Special Educational Needs Co-ordinator (SENCO) qualifications. These developments were underpinned by the publication in June 2018 of an occupational map, outlining to employers and practitioners the career pathways the sector offers.
However, less progress has been made on the more strategic commitments. In 2018, the government abandoned proposals to grow the early years graduate workforce in poorer areas and to change the rules to allow those with Early Years Teacher Status or Early Years Professional Status to lead nursery classes in maintained settings. Similarly, recruitment and retention challenges have not eased. This may reflect a lack of policy focus, which has also materialised in the frequent change of the minister responsible for early years policy.
2.7 Effects of COVID-19 on early years sector
While this research was conducted before the outbreak of COVID-19, the drivers of workforce instability are likely to persist and even worsen as a result of the pandemic.
Many EY workers have been furloughed via the Coronavirus Job Retention Scheme, receiving up to 80% of their regular income and finding it even harder to get by without other support. We know that before the recent crisis, around 45% of childcare workers claimed state benefits or tax credits – well above the average among the wider female workforce. It is likely that this proportion has increased or will increase throughout the second half of 2020 and beyond.
With furlough regulations changing and the furlough scheme ending in the next few months, there will also be a need to monitor both the size and the composition, in terms of qualification levels, of the EY workforce. A changing workforce will have implications for CPD needs. This study suggests that high-quality CPD is valued by EY professionals, but it is difficult to know what CPD will be available in the future, whether it will match the needs of a changing workforce and whether EY settings will be able to afford it.
For many working in early years, the crisis has further destabilised an already precarious situation. When and how the sector will recover depends on a new understanding of its crucial work for society and a funding system that reflects this.
2.8 Policy recommendations
The government should convene an expert group to devise a career strategy for early years professionals working with children aged zero to eight.
The strategy should include:
- a new training pathway that allows people to start as apprentices and upskill along a clear path all the way through to primary school headship, with opportunities to enter the sector at any point along this development continuum, depending on qualifications and experience
- a reform of careers advice services to make sure clear expectations are communicated about what a job in EY entails, while portraying careers as a real professional choice rather than a fall-back option for low achievers
- a pilot of a workforce registry that would allow EY practitioners to create a community, develop a sense of belonging, craft their professional profile and access CPD opportunities
- a clear plan for attracting those further or later on in their careers to join the workforce as EY educators
The government should address the shortfall between the costs to providers of funded places in early years settings and the actual money allocated for those places:
- in the short term, funding rates should increase to match rising operational costs due to inflation and National Minimum Wage increases
- in the long term, the government should launch a review of funding by education phase, looking into alternative systems to allocate public funding
3. Introduction
3.1 Background
By the age of five there is already a gap in attainment based on socio-economic background, and this gap persists throughout school. Key to reducing this gap is high-quality EY provision delivered by a qualified and skilled workforce.[footnote 1] And yet the EY sector faces significant challenges in demonstrating its value to both early education and wider social mobility aspirations. For instance, it is sometimes seen as ‘just childcare’ and there is an under- appreciation of the crucial roles it plays in children’s development. This in turn leads to issues of recruitment and retention of a qualified and skilled workforce.[footnote 2]
A crude but useful measure of workforce instability is the turnover rate – the percentage of employees who leave a company within a certain period of time. Recent studies estimate the turnover rates for the EY workforce to be between 11% and 15%, depending on the source (see Annex 1 for an overview of different estimates).[footnote 3]
The stability of the EY workforce matters because, without it, quality provision is harder to achieve. Having stable EY education is even more important in disadvantaged communities, as research suggests that children from disadvantaged backgrounds are less likely to be in resource-rich home environments.[footnote 4] A variety of factors are likely to affect stability, such as there being different types of providers in the sector – maintained nurseries, private, voluntary and independent (PVI) settings, and childminders. In addition, some providers are single-site settings while others are larger nursery chains. We might also expect EY providers in urban and rural settings to face different types of barriers to recruitment and retention. In some geographies, the workforce is local and likely to remain local. There are limited incentives for workers to move into more isolated areas or to travel significant distances to work. Meanwhile, a limited and localised labour market also means fewer job alternatives for those wanting to leave the EY sector.
The Social Mobility Commission’s State of the Nation 2018–19 report highlighted some significant regional disparities in social mobility and across the proxy indicators at each stage of the life course, including the EY indicators.[footnote 5] Other studies have also found some regional disparities in children’s access to qualified EY staff.[footnote 6] This is an opportunity to shed light on some of these disparities for the EY workforce.
3.2 Research questions
The study addresses the following research questions:
- how stable is the EY workforce in England?
- what are the main barriers to stability?
- how do these barriers vary by region?
- how do these barriers vary by provider type?
3.3 Definitions
Workforce stability can be analysed in three different ways:
- as retention within the sector – to what extent are people leaving the EY workforce altogether?
- as movement between settings – to what extent are workers moving between different providers and why?
- as movement within the setting itself – to what extent are EY workers moving to different roles within the same institution?
All three levels of stability have an impact on the quality of provision and children’s outcomes.
3.4 Who are the EY workers?
EY workers provide education and care to children aged zero to five, performing a variety of tasks from setting up age-appropriate activities for children to supervising other staff.
EY workers can be self-employed, such as childminders, or work in a formal nursery.
Nurseries may be part of a school or children’s centre or be independent of either. The majority are run by organisations in the private, voluntary and independent sectors.
Childminders must have completed some training on how to implement the EY curriculum. Staff at nurseries may in principle hold no relevant qualification, but in practice most staff hold at least a full and relevant Level 2 qualification.
3.5 Overview of the report
The next chapter provides an overview of the key findings of the report and the relative strength of each of the barriers to workforce stability. The Evidence review section describes the findings from the literature review. This in turn formed the basis for the What we found section, which describes in detail the findings from the quantitative and qualitative strands of research. The Conclusions section rounds up the implications of our research, offering evidence-based policy recommendations. A full description of the methodology employed in this study can be found in Annex 2.
4. Key findings and strength of the evidence
In this chapter, we summarise our findings and assess the different barriers to the stability of the EY workforce identified in the three strands of our analysis: the literature review, the quantitative analysis of Annual Population Survey (APS) data and the qualitative interviews.[footnote 7]
4.1 Stability of the English workforce
As mentioned in the introduction, there are several ways to look at workforce stability. The most common approach to assessing this is the turnover rate – the proportion of staff at a setting who are replaced within a given time period. Recent estimates of turnover rates for the EY workforce in England, based on broadly representative samples of EY settings, vary from 11% to 15% (Annex 1).[footnote 8] By comparison, a recent estimate for the turnover rate of teachers in primary schools is 19%, but the methods used to calculate these figures are different, so caution should be taken when making comparisons.[footnote 9]
Moving beyond turnover rates, the APS data used for the quantitative analysis looks at how long individuals have been with their current employer. The data shows that EY workers stay with the same employer for shorter periods of time than other occupational groups. There is also greater instability in urban areas than in rural areas and in the private sector than in the public sector, while there are no significant differences between deprived and affluent areas.
4.2 Income
There is strong evidence that the instability of the EY workforce is related to the low income of its members. The evidence is clear that a high proportion of the EY workforce is on low pay, both in absolute terms (high proportion of practitioners earning the minimum wage) and in relative terms (high proportion of practitioners earning less than workers in other sectors that require comparable qualifications). This problem is particularly salient for EY practitioners with children or other dependents.
The situation is compounded by:
- the unintended effects of government policies, such as the minimum wage and the 15 and 30 hours of funded childcare
- the relatively high living and transport costs in some areas
Differences by region
There is weak evidence that the barrier of low income varies by population density or level of deprivation. Our analysis of APS data shows that EY practitioners in deprived areas are paid marginally less, but this could also reflect lower costs of living. Interviewees were also divided: the way government funding is distributed is perceived to favour deprived areas, but settings in affluent areas can charge parents extra for additional services.
Differences by provider
There is strong evidence that the barrier of low income varies by provider type. Our analysis of APS data shows that EY practitioners are better paid in the public sector than in the private sector. This is in line with the perceptions of the practitioners we interviewed. This increases the risk of mobility within the sector, because workers with higher education levels have strong incentives to leave the private sector and seek employment in the public sector.
4.3 Demographic imbalance
There is strong evidence that the instability of the EY workforce is related to its demographic composition, and in particular to its over-reliance on female practitioners. The APS data shows that 96% of practitioners are women and 40% are under 30. Both the data and the interviews show that this makes the EY sector particularly vulnerable to gender-specific causes of instability such as parental leave and career breaks among young, low-income parents.
Differences by region
There are no differences across geographies in terms of gender participation in the EY sector.
Differences by provider
There is weak evidence that the barrier to stability determined by demographic characteristics varies by provider type, and we found similar distributions across the public and private sectors.
4.4 Workload and responsibilities
There is strong evidence that the instability of the EY workforce is related to the high workload and the demanding nature of the job (compared with retail, for example). Our analysis of the APS shows that although a high proportion of EY practitioners work part-time, they work significantly longer hours than retail practitioners. Interview participants confirmed that they work long hours and spoke about the amount of paperwork to be done during or outside of working hours, and the perceived demands of Ofsted inspections.
Differences by region
There is no evidence that workload and responsibilities vary by levels of deprivation. The APS shows that a smaller proportion of EY practitioners work long hours in deprived areas than in affluent areas. Some interview participants had a similar perception. They suggested that parents’ longer working hours in affluent areas often result in overwork for them. Other practitioners felt that the opposite was true. They indicated that settings in deprived areas often have to deal with higher numbers of children with additional or complex needs, such as special educational needs (SEND), poor mental health and poverty. This creates more work, which contributes to the instability of their workforce.
There is also no evidence that the barrier of workload varies by population density.
Differences by provider
There is strong evidence that EY practitioners in public settings are less likely to work long hours than colleagues in the private sector. We found a significant difference between the two groups in the APS. This was also the perception among interviewees. Practitioners working in PVIs, for example, felt that working conditions were better in school nurseries due to shorter opening hours and term-time-only schedules.
Our qualitative research highlighted an interesting variation that did not emerge from the literature review or the APS, namely the variation between larger and smaller settings. Overall, participants felt that larger settings provide more support and better working conditions. This was felt most acutely by childminders, who are self-employed and tend to work on their own.
These results are broadly in line with the literature reviewed as part of this project.
4.5 Training and continuous professional development
There is strong evidence that the instability of the EY workforce is related to low entry and exit barriers and to limited opportunities for career progression. The APS shows that EY practitioners are less qualified than the working population as a whole. The managers, policy- makers and more experienced practitioners we interviewed reported a trend of junior staff coming into the sector with entry-level qualifications who are underprepared for the job. This observation is in line with the literature.
Despite these low qualifications and a perceived high level of responsibilities, according to APS data only one EY practitioner in six had received job-related training in the last month. The interviewees did not consider current access to CPD opportunities to be adequate, with the key reasons identified as a lack of training budgets and limited time, especially among childminders. The literature also indicates that some managers are reluctant to train their staff because they fear that they will become more competitive and leave their setting for a better job.
Differences by region
There is no evidence that opportunities for progression vary by region. Although the APS shows that EY practitioners in deprived areas are less qualified than those in affluent areas, there is no evidence that deprived areas offer fewer training opportunities than affluent areas. There is also no evidence that practitioners working in urban areas have greater training opportunities.
Although interviewees suggested that training opportunities were less accessible in rural areas, the APS shows that EY practitioners in rural areas get the same amount of CPD as colleagues in urban areas.
Differences by provider
There is moderate evidence that practitioners in school nurseries are (a) more qualified than their colleagues in private settings and (b) more likely to have access to training. The perception among some practitioners is that this has more to do with the size of the setting than with the type of provider. For example, childminders reported not feeling supported to engage in training provided by local authorities.
It is also unclear whether practitioners have more opportunities for progression in school nurseries or PVIs. Practitioners working in schools felt that there was little room for progression at their settings, while practitioners working in PVIs felt they had fewer opportunities to progress than their colleagues in schools. They explained that their only chance to progress was by moving setting. Other participants highlighted that there are more opportunities to progress in larger settings, regardless of the type of provider.
4.6 Knowledge and societal views of the sector
There is moderate evidence that the instability of the EY workforce is related to the perception that it is an unattractive, low-skilled, low-pay profession. This problem was explicitly mentioned in interviews as well. Practitioners pointed to the mismatch between the expectations of newly qualified practitioners and the actual requirements of the job. They saw this mismatch as a major source of frustration for all parties. Some practitioners felt that the job was not what they signed up for, and some managers felt that new staff were sometimes unprepared and unintentionally created more work for their colleagues. Practitioners perceived this as increasing the risk of resignation and dismissal.
Differences by region
There is no evidence that the reputation of the EY sector varies by region.
Differences by provider
There is weak evidence that the status of the profession varies by provider type. The issue was raised mainly by childminders, who were frustrated at being perceived as ‘babysitters’ by parents, friends and other EY practitioners. Participants from formal settings, whether PVIs or maintained settings, did not explicitly mention the reputation of the sector as a source of instability but explained that new entrants to the sector are often unaware of the demands of the job. This unawareness was a reason why some practitioners left or considered leaving the profession.
4.7 Organisational climate and culture
Interview participants mentioned a positive team culture and approachable, inclusive management as strong motivators for staying in a workplace long term. Conversely – and unsurprisingly – they indicated that lack of trust, bullying and excessive workloads all contributed to instability. The literature we reviewed lends only weak support to this argument.
Differences by region
There is weak evidence that practitioners in affluent areas have better working conditions and higher levels of job satisfaction than their counterparts in deprived areas. The statistics contradict the perceptions. The APS shows that EY practitioners in deprived areas are happier and less anxious and have higher levels of self-worth than practitioners in affluent areas. Some practitioners felt that parents in more affluent areas are often more involved with the setting, which they believed had two advantages: greater job satisfaction and reduced workload.
There is no convincing evidence that practitioners in rural areas have better working conditions or higher levels of job satisfaction than their counterparts in urban areas. We did not find significant differences in the APS between rural and urban areas in terms of job satisfaction.
Here again, perceptions were rather different. Practitioners expressed the view that, overall, rural areas provide better working environments and inferred that this could encourage retention. They felt that rural areas have a greater sense of community and provide better play areas. Although they recognised that staffing can be more challenging in rural areas, they said that the workforce is more stable due to a lesser reliance on agency practitioners.
Differences by provider
There is no convincing evidence that the culture of a setting depends on whether it is a school nursery or a PVI. The APS shows that EY practitioners in the public sector have slightly lower levels of happiness, satisfaction and self-worth, and higher levels of anxiety, than those working in private settings. However, this result should be treated with caution, as it contradicts other findings about working conditions and workload.
EY practitioners at school nurseries did not mention organisational culture as a barrier to stability. Within PVIs, one view was that the climate and culture of the setting has more to do with the size of the setting or the group than with the type of ownership (that is, public or private). However, there was no consensus about the direction of the association: some practitioners thought that larger settings have clearer and fairer procedures, but others thought this greater focus on procedures makes them less flexible and supportive. Some participants indicated that community-run, not-for-profit settings are facing unique challenges in terms of management.
Unsurprisingly given their self-employed status, childminders did not see organisational culture as a barrier to stability.
4.8 Case study: Michelle Wisbey, Thaxted
University lecturer in early years education, aged 50. Has worked in EY for 24 years. Owner/manager of four pre-schools, covering three months to five years, funded by fees and grants.
“In my experience over the past 25 years, the people who become Early Years workers are either mothers returning to work, or young girls who want to look after children, and aspire to have their own.
We are a rural setting, outside of London, where the average income for a manager is £11-12 an hour. As a pre-school manager, you have a large portfolio of responsibility: Ofsted inspections; compliance with Early Years Foundation Stage delivery; safeguarding; managing the team; and overseeing health and safety, to name but a few. It’s a sadness knowing you would earn more money working at ALDI. Young girls often leave the sector due to its low pay, high stress levels and long hours.
Small unique nursery owners are getting to the point that they cannot afford to invest for short- term gain. For practitioners, increased qualification does not necessarily lead to a higher wage. A 19-year-old with GCSEs and a Level 2 NVQ in Early Years has no reason to do more training to a Level 3, because she will earn pretty much the same.
I’ve loved every minute of my work, but I’m lucky in that my income supplements the family income: we are not dependent on it. My generation were funded through our training in the good times, which made a huge difference to the demographics of the people entering the profession. My fear is that as many of us leave the sector or retire, knowledge is slowly filtering out, and the younger staff we leave behind tend to have a lower level of training.
I don’t know the answer, but as long as we have the present mixture of corporate privatisation, rural unique private nurseries and maintained nurseries – all funded and financed differently – we are unlikely to see fair working conditions in the sector.
Qualifications and skills need to be standardised, with qualifications delivered only by FE and HE colleges, rather than small, unregulated training providers. Too many agencies deliver low-quality training and when the government pushed for standardisation and professionalisation, the big corporates pushed back because they didn’t want to pay higher wages.
We need to learn more from other countries that do early years well and respect it as an education and developmental platform for the youngest, rather than just a place where parents leave children so they can go to work.
5. Evidence review
This section presents the findings of a rapid review of the evidence on the factors that influence the stability of the EY workforce.[footnote 10]
Where possible, we also indicate whether a factor of instability is more likely to result in (1) an exit from a sector, (2) a movement between settings or (3) movement within the setting. This reflects the definition of instability presented in the introduction. However, this proved more difficult than expected, as most studies tend to conflate these different outcomes into a single measure of turnover.
5.1 The key barriers to the stability of the EY workforce
The five most important factors associated with instability were identified according to the number of citations in the literature review. They are:
- pay
- work demands
- demographic characteristics
- training and continuous professional development (CPD)
- organisational climate and culture
Pay
Low pay appears to be one of the most important factors in practitioners’ decisions to leave their setting or the sector, while increasing wages is one of the most useful ways to increase retention.[footnote 11]
Several studies find that EY workers with a higher salary are less likely to leave or intend to leave the setting they work at or the EY sector.[footnote 12] One study reviewed suggests that the wages of EY workers are not significantly associated with retention over a 12-month period, but the timing of the study coincided with a major economic downturn, which might have limited job opportunities and so labour mobility.[footnote 13] Studies also suggest that pay is one of the most common reasons for EY workers to consider leaving their setting or the sector altogether.[footnote 14] For instance, one study finds that inadequate pay would cause 52% of EY practitioners in England to leave the EY sector within the next 12 months.[footnote 15]
Some studies suggest that EY workers take low pay as a given in the sector, with their desire to work with children outweighing concerns about low pay.[footnote 16] However, far from communicating an acceptance of low pay, this appears to be testament to the intrinsic motivations of many EY workers to work in the sector. Some practitioners reported having no choice but to take second jobs, while others described themselves as living on the edge of financial survival.[footnote 17] Additional strain is put on the ability and desire of EY practitioners to remain in the sector by the combination of low pay and high work demands.[footnote 18] This is compounded by the lack of recognition of EY workers’ qualification levels relative to other sectors, with workers who hold a bachelor’s degree often earning a lower wage in the EY sector than they might in other sectors.[footnote 19] A further risk is that EY practitioners feel they receive wages that are unfair when compared with those of other workers in the education system.[footnote 20]
EY workers reported that workforce stability would increase if their pay was increased, and especially if it reflected their level of education and experience and the responsibilities of their job.[footnote 21]
Work demands
High work demands on EY workers can lead to burnout, especially when it goes without sufficient pay or other compensation. Five main issues contribute to excessive work demands in the EY sector: long working hours, paperwork, child-to-staff ratios, high levels of responsibility and unfavourable tasks.
Long hours:
Workers in the EY sector reported that having to work long hours, especially when they are not paid for all of their hours, is a reason why they move between settings or leave the sector altogether.[footnote 22] Some 92% of practitioners in England reported having worked some overtime in the past year,[footnote 23] while 62% of EY workers in group-based settings reported that they do not have a good work–life balance.[footnote 24] There is some evidence that the number of hours worked by practitioners varies by setting type, with EY workers at private settings working on average 45 to 50 hours per week, compared with workers at voluntary settings, who work 35 to 40 hours per week.[footnote 25]
One study suggests a mismatch between the perception of working hours among EY employers and workers, with employers thinking that shorter hours could be a barrier to recruitment because of the associated lower take-home pay.[footnote 26] Workers, on the other hand, value shorter working hours because this gives them more time, for example, to spend with their children, and because doing more hours could be associated with more unpaid work. Indeed, the literature supports the conclusion that EY practitioners do not enjoy working long hours and value flexibility over their work schedule.[footnote 27]
Paperwork:
In addition to working long hours, the literature suggests that EY practitioners can be required to perform unpaid work outside of working hours.[footnote 28] This is because when children are present at the setting, practitioners are mostly required to focus their attention on the children and are unable to do lesson planning and paperwork. Having to complete paperwork could mean getting to spend less time with children, which can lead to reduced job satisfaction.[footnote 29] Some EY workers take their paperwork home with them, which can negatively impact their health and wellbeing.[footnote 30]
Given these findings, it is unsurprising that one study found that EY practitioners who were happy in their roles were paid for non-contact time to do paperwork and administrative tasks.[footnote 31]
Child-to-staff ratios:
One reason EY practitioners and managers gave for taking paperwork home is restrictive and unmanageable child-to-staff ratios.[footnote 32] The child-to-staff ratio refers to the number of children one staff member is permitted to care for at a time. In England the number differs depending on the children’s ages, with child-to-staff ratios being lower the younger the children’s ages (maximum child-to-staff ratios are set out in regulations in England).
EY workers reported that high child-to-staff ratios reduce their ability to speak to their colleagues, reflect on their practice or improve provision for children.[footnote 33] For instance, one practitioner reported regularly looking after multiple infants by herself and feeling worn out as a result.[footnote 34]
High responsibility and unfavourable tasks:
The evidence suggests that workers in the EY sector often face a high level of responsibility and are required to perform unfavourable tasks. Practitioners also view the high levels of responsibility assigned to them as being out of line with the relatively low pay.[footnote 35] This issue can be particularly pertinent for setting managers.[footnote 36]
Meanwhile, EY workers can become frustrated when given the same tasks daily, especially when these are administrative or simple.[footnote 37] For instance, workers at private day nurseries in England reported experiencing low job satisfaction due to expectations on them to perform heavy cleaning, such as washing windows and mopping floors.[footnote 38] These findings suggest that EY practitioners enjoy being challenged but do not appreciate the high burden of responsibility placed on them, particularly when greater responsibility does not come with greater pay.
5.2 Demographic characteristics
Demographic characteristics such as the age and gender of the workforce are commonly mentioned in the literature about the stability of the EY workforce. The impact of demographic characteristics often appears to be contingent on other factors such as skills levels and the state of the wider economy, as detailed below.
While age does appear in several studies to be associated with workers’ propensity to leave a setting, with older workers less likely to leave than younger ones, this appears to be due largely to their position within the setting (seniority) or their education levels.[footnote 39] There is evidence that a significant proportion of the workforce is considering retirement, which could strain the stability of the workforce if fewer workers are entering the workforce than leaving.[footnote 40] Some evidence suggests that workers at private EY settings in England are on average younger than those working in the voluntary sector, with one study identifying a 25-year age gap.[footnote 41] This could be because private sector settings often require longer working hours of staff, meaning that those workers who have not yet started families have more time and are in a better position to work there.
A key feature of the EY workforce across the world is that it is predominantly female. There is some evidence that this can act as a barrier to the stability of the workforce, both directly and indirectly. Some 9% of EY settings in England reported having lost staff in the past 12 months due to their decision to take a career break, including maternity leave.[footnote 42] Additionally, the positioning of working in the EY sector as ‘women’s work’ can contribute to its low status, leading to a lower supply of workers and, perhaps, an acceptance of reduced benefits.
5.3 Training and continuous professional development
There is good evidence that EY workers value training and CPD opportunities to learn from other EY practitioners and to feel part of the EY sector, and that these are important factors in their decision to remain at an EY setting.[footnote 43]
Currently, the EY sector has a reputation for offering insufficient CPD and training opportunities,[footnote 44] which some settings reported has dissuaded individuals from joining the sector.[footnote 45] Indeed, practitioners working at EY settings which provide them with higher levels of advice and professional support were found to be less likely to leave their setting after two years compared with practitioners at settings which offer less support.[footnote 46] For those who have joined the sector, a lack of training opportunities can make it more difficult for practitioners to become confident in their skills or to ease the transition into a managerial role, leaving new managers overwhelmed.[footnote 47] EY workers in the voluntary sector have greater access to training and CPD, according to one study which found that they were also provided with more time off during their workday to attend CPD.[footnote 48] In contrast, practitioners at private settings often have to pay for their own training and to attend sessions outside of their paid working hours.
The most common reason for poor provision of training and CPD cited by EY employers is the lack of funding available for training.[footnote 49] Employers in the private and voluntary sectors often lack the funds to pay for staff cover while their staff are on training.[footnote 50] This issue is not showing signs of relenting, with a 2019 survey finding that only 8% of EY settings in England planned to spend more money on training the following year, while 55% planned to spend less.[footnote 51] There is some evidence that employers are concerned that offering training and CPD to staff could lead those staff to become more competitive in the sector and to move to a new employer.[footnote 52] In fact, some practitioners did report that they are motivated to take part in training because they want to access a more senior position in a different setting.
The type of training offered is important to EY workers, as is the recognition they get – in pay or career progression – for having completed training.[footnote 53] This can mean that mandatory training which is unaccompanied by a pay rise can actually be a barrier to staff retention, as some staff reported that mandatory courses do not teach them anything new, while some may refuse to take part if they are not compensated for doing so. In one study, practitioners reported that they disliked having to continually obtain qualifications because they believed practical experience with children outweighed the qualifications gained through written assignments and observations.[footnote 54]
5.4 Organisational climate and culture
Organisational climate and culture refer to the perceptions that EY practitioners and managers have of the organisation (or setting) and their shared beliefs and behavioural expectations.
There is mixed evidence about the impacts that the organisational climate can have on staff retention in the EY workforce.[footnote 55] However, there is evidence that certain aspects of the climate and culture – such as a culture of stability and positive management practices – are associated with staff retention.
There is evidence that the management style of leaders in EY settings has an impact on the stability of the workforce. Practices which appear to positively affect staff retention include making staff feel valued and listened to by their manager, and giving them a say over their working hours, the curriculum of the setting and the organisational ethos.[footnote 56] EY workers also appear to value managers who recognise the commitment and achievements of their staff and who do not believe they are above doing ‘dirty work’ like changing nappies.[footnote 57] EY workers’ job satisfaction and retention are also positively impacted by their belief that their work is worthwhile, having friendships with colleagues, sharing progress with parents, and receiving recognition and support from management.[footnote 58]
In contrast, job satisfaction appears to be negatively impacted by practitioners having insufficient time to perform the job well while perceiving management to behave more favourably towards some staff members than others. It is worth noting that evidence is inconclusive on the extent to which job satisfaction is associated with workers’ propensity to remain in a setting.[footnote 59]
There is some evidence that there are different management styles at EY settings in the private sector and voluntary sector. One study found that practitioners at private settings regarded managers as disengaged but controlling and reported that they did not feel comfortable going to management with an issue.[footnote 60] At voluntary settings, staff felt that the managers struck a balance between being senior members of staff and playing an important part in the day-to-day work with the children.
It appears that staff turnover in an EY setting can lead to more staff turnover in the future. Managers of EY settings in the USA reported that a practitioner leaving the setting leads to a reshuffle of roles in the setting and lower morale among the remaining practitioners.[footnote 61] The continuity of management staff also seems important, with staff turnover of practitioners being higher in settings where the manager has been replaced more recently.[footnote 62]
5.5 Summary of key points
The literature highlighted several factors that have a negative impact on the stability of the EY workforce. While a passion for working with children and feeling valued in the workplace help to keep many professionals in the sector, several other elements emerged as important drivers of instability. These were low pay, increasing workload and responsibilities, limited opportunities for CPD and career progression, a lack of support from the setting management or local authorities, high volume of paperwork, and less time spent with children.
We found little or no information about workers’ employment history and about stability in terms of movement within the setting. Importantly, the literature gave little attention to some key themes, such as differences across geographies and the influence of wider labour market dynamics, which makes this study’s place-based approach even more important to fill in this evidence gap.
5.6 Case study: Fiona Doyle, London
Former school teacher, aged 36, who switched careers to early years five years ago and now runs her own childminding business and three after-school clubs.
“I was a secondary school teacher for nearly 10 years. I reached management levels and became head of department. But then I had my daughter and I retrained as a childminder, five years ago now.
For me, it was difficult reputationally to go from being a respected head of department to being a childminder. It was difficult emotionally, because it’s not a well-respected profession. People tend to view it as a low-skill service industry.
When I retrained I thought as a qualified teacher it wouldn’t be that difficult, but there was a lot more to learn, including a Level 3 Childminding course, my DBS security check, and my first aid and safeguarding courses.
Childminding involves a lot of study and continuing professional development (CPD). You have to have full knowledge of the EYFS (Early Years Foundation Stage), you’re inspected every couple of years by Ofsted, and you have to retrain constantly. It’s an intense, high- pressure job.
You need excellent communication skills and patience. Soft skills and tact are important when supporting parents and offering advice and signposting where necessary – for example if you’ve spotted signs of special needs.
We work to the EYFS requirements and constantly monitor their physical development, their emotional literacy, their language, their maths, their reading. Can they hold a fork? Can they thread beads? Can they write letters? We teach them all of that. We also make observations, record them in our reports and then feed back to the parents.
When I was teaching in secondary school, my experience was the girls who didn’t have an idea of what they wanted to do were all put on the BTEC Childcare course.
Bigger nurseries can employ kids of 18 or 19, with just a couple of GCSEs. That gives them a viable job and career, but on the other hand, they’re being told that’s all they can do, so people who get more GCSEs don’t want to do childminding.
We need to focus on the fact that EY is part of the education system. There can be such a discrepancy between a child’s development before they start school and after they enter reception. Actually, the learning starts as soon as you place them in someone else’s care.”
6. What we found
This chapter describes the barriers to stability faced by the EY workforce in England. It includes the results of the quantitative and qualitative strands of the research and looks in detail at the major barriers to workforce stability identified by the literature review.
The quantitative strand involved analysis of data from a special request of the APS for the years 2015 to 2017. The data identified approximately 280,900 EY professionals in England: 58% were nursery nurses and assistants, 33% were childminders and 9% were playworkers. These three occupations are presented together as the EY workforce. This group is representative of people working in PVI settings and of childminders, as well as of those working in maintained and school-based nurseries. It does not include reception year teachers, who are not a focus of this research.
The qualitative strand involved a series of 40 interviews with EY practitioners, setting managers and local policy-makers. Participants were recruited from areas with varying poverty levels and a mix of urban and rural areas representing a range of geographies. Interviews focused on the main barriers to EY workforce stability identified in the literature review, but participants were also encouraged to talk about other barriers (see Annex 2 for more details on the methodology).
Following a brief summary of the stability of the EY workforce in England according to the APS data, the findings from both strands (where applicable) are presented for each of the following barriers to the stability of the EY workforce: pay and funding, work demands, demographic characteristics, training and CPD, organisational climate and culture, and knowledge and societal views of the sector.
6.1 Overview of the stability of the EY workforce in England
The APS data does not allow us to calculate turnover rates at provider level. Instead, we can observe the length of time individuals have been with their current employer. We find that around 37% of EY workers have been with their current employer for less than two years, which is a smaller proportion than among retail sector workers (47%), but higher than among female workers (31%) and all workers (29%). In contrast, a smaller proportion of EY workers stay with their employer for 10 to 20 years: 16% compared with 13% of retail workers, 21% of female workers and 21% of the total workforce.
According to this measure, staff stability varies substantially across regions, with the north in general having a more stable population than the south or London region. Approximately 31% of EY workers in the north of England stay with their current employer for less than two years, compared to 37% in the midlands and 40% in the south of England. Conversely, 19% of EY workers in the north of England stay with the same employer for between 10 and 20 years, 18% in the east and west midlands and 13% across London and the south of England.
We find only small differences between rural and urban areas. Similar proportions of workers stay with the same employer for less than two years in rural and urban areas (36% vs 38%) and the same proportion stay for two to five years (25% vs 25%). However, a higher proportion of workers in rural areas (19%) stay with the same employer for 10 to 20 years compared with workers in urban areas (15%)
Finally, our findings suggest that private sector workers stay with their current employer for fewer years than those in the public sector. A larger proportion of private sector workers (39%) stay with their current employer for less than two years compared with public sector workers (27%). Similar proportions stay in continuous employment for between two and five years (25% private vs 23% public) and between five and ten years (18%), but only 14% of private sector workers stay with the same employer for between 10 and 20 years, compared with 25% of public sector workers.
6.2 Pay and funding
The literature review highlighted low pay as one of the leading factors associated with instability of the EY workforce. Our analysis of the APS shows that the average wage across the EY sector is £7.42 per hour, which is similar to the retail sector (£7.09), but far lower than the average pay across the female workforce (£11.37) and total working population (£12.57).
As shown in Figure 1, 60% of EY workers are paid between £5 and £9 per hour, compared with 72% of retail workers, 35% of the female workforce and 29% of the total working population. At the other end of the spectrum, only 12% of EY workers are paid above £11, compared with 7% of the retail sector, 45% of the female workforce and 53% of the total workforce.
Figure 1: Banded hourly pay for EY workers, retail workers, the female workforce and the total workforce
| Workers | £0 to £5 | £5 to £7 | £7 to £9 | £9 to £11 | £11 and over |
|---|---|---|---|---|---|
| Early years workers | 13% | 29% | 31% | 15% | 12% |
| Retail workers | 12% | 34% | 38% | 10% | 7% |
| Female workforce | 5% | 14% | 21% | 15% | 45% |
| Total workforce | 4% | 11% | 18% | 14% | 53% |
Source: ONS (Office for National Statistics), Annual Population Survey, 2018
Interview participants identified low income as a major cause of instability in the EY sector. A low income could be the result of low wages, high living costs or changes to government policies – or all three.
They said that earning National Minimum Wage, or just above, was widespread. Workers on this wage struggled to meet their living costs and moved to other employers for even a small pay increase or left the EY sector for other low-skilled work, such as retail or bar work, where wages were higher.
“Recently we’ve had, ‘I can get more money working in a bar’.” – Director of Children’s Services, deprived/rural
Practitioners who are parents face additional challenges. Participants reported examples of parents who had either left or considered leaving the sector because of a combination of low pay and unintended effects from the benefit system. This problem was acute at two stages of a child’s life. First, parents wishing to return to work in the EY sector from parental leave found that they could not earn enough to cover their own childcare costs, so these practitioners chose to become stay-at-home parents instead.
“We’ve got someone that’s not coming back from maternity leave again because they can’t afford to live. We offer a discount for staff children, but even with that they can’t afford to come back to work basically because they wouldn’t make as much money as they need to cover their own rent and rates and everything else at home.” – PVI setting manager, affluent/rural
Second, practitioners with children approaching the stage when child support benefits would be withdrawn could struggle financially. Without these benefits, they found it difficult to cover basic living costs. With limited ways to increase their wages while remaining in an EY job, they needed to consider seeking better-paid work to survive financially.
Practitioners said government policies designed to support EY, such as 30-hours funding, the quality supplement (a payment of £1,000 a year from local authorities to nurseries that employ a qualified EY teacher) and the National Minimum Wage, kept wages low and caused instability in nurseries.
Three problems with 30-hours funding made it hard for nurseries to raise wages:
- the hourly rate paid by the local authority may be too low to fully cover the nursery’s costs, leading to budget shortfalls
- some nurseries were uncertain when their 30-hours payments would arrive, as local authorities occasionally failed to communicate or did not give enough advance notice of the funding rate for a new financial year
- the local authority may suddenly underpay in one month after overpaying in another
“We had an issue just a couple of weeks ago that … there’s now going to be a massive shortfall in the monthly payment for November because of overpaid in September and October … which just really mucks up things.” – PVI setting manager, affluent/urban
Practitioners also raised problems with the quality supplement. They saw it as unfair because it did not help nurseries pay higher wages to reward other highly qualified staff. Further, there were reports of local authorities abruptly withdrawing the quality supplement, leaving a hole in funds to pay EY teacher salaries.
The age boundary of the National Minimum Wage, which requires workers to be above 25 to earn the full rate, caused problems for practitioners below this age. Practitioners said it was possible for a Level 3 qualified practitioner under 25 to earn less than an unqualified worker over 25 for the same job. Once again, this was described as a motivation to leave the sector.
“Those who are Level 3 qualified, if they don’t happen to be the age of 25, are seeing colleagues that aren’t Level 3 qualified getting better pay than they are.” – Director of Children’s Services, affluent/rural
Differences by region
Practitioners interviewed believed that challenges related to pay could be geographically specific. One view was that practitioners in rural areas could be deterred from working in the EY sector because of high travel costs or poor public transport links. In contrast, high rents were of concern to practitioners in more urban areas. A nursery school teacher in a university town highlighted that younger members of staff had left their setting because of this.
“Unless you’re established, you would have to live outside the city to be able to afford [housing] … people do move to different parts of the country.” – Nursery school teacher, affluent/rural
Settings close to public transport were in demand. A childminder in an affluent commuter town explained that childminders nearest to the train station had a competitive advantage regardless of the quality of their provision.
“A lot of parents, first they’re looking for the childminder that is closest to the station, so they can do that drop-off and jump on the train.” – Childminder, affluent/urban
Interview practitioners in rural communities expressed the view that the relative absence of alternative job opportunities could discourage practitioners from leaving the sector. In comparison, practitioners from settings near or within major urban areas observed a trend of staff leaving the sector for retail jobs. In a former mining community in the north of England, a supermarket giant ‘pulled’ practitioners away from the sector because of better pay and shorter hours. A shopping mall in a large city in the south of England had a similar appeal to those unhappy about the sector.
“There’s a big retail presence in the area … they [practitioners] don’t need any paperwork, they don’t have to do reports, they don’t have to do transition records, they don’t have to meet with parents.” – Director of Children’s Services, deprived/urban
APS data shows that EY workers in rural areas are paid, on average, less than workers in more urban areas, at approximately £7.06 per hour against £7.49 per hour. We also find a larger proportion of rural-area workers being paid between £5 and £9 per hour, at 67% of the workforce versus 58% in urban areas. Among higher earners, only 9% of workers in rural areas earn more than £11 per hour compared with 13% of workers in urban areas. The differences are not surprising, as pay conditions generally reflect the cost of living in a particular area and rates of pay are usually greater in urban areas.
However, at a regional level, pay rates do not differ widely. Workers from all regions in England (excluding London) are paid very similar wages, ranging from £7.09 in the west midlands to £7.30 in the east of England. The average hourly wage in London is higher than in all other regions, at £8.67, which may be partly explained by the London Living Wage of £10.75. Most EY workers across all regions (excluding London) earn between £5 and £9, ranging from 75% of the EY workforce in the north-east and south-west to 52% in the east of England (Figure 2). Approximately 52% of workers in London are paid more than £9 per hour. For lower-income earners, 20% of workers in the east midlands and 19% of workers in the east of England are paid between £0 and £5 – both areas have the largest proportion of low-income earners of all regions.
Variation in regional wages may be minimal because EY workers’ pay is already close to the National Minimum Wage. This is indicative of the inability of settings to increase pay much above this minimum due to financial difficulties.
Figure 2: Banded hourly pay for EY workers by region
| Region | £0 to £5 | £5 to £7 | £7 to £9 | £9 to £11 | £11 and over |
|---|---|---|---|---|---|
| North East | 8% | 31% | 43% | 11% | 7% |
| North West | 8% | 45% | 27% | 12% | 8% |
| Yorkshire and Humberside | 11% | 37% | 31% | 11% | 10% |
| East Midlands | 20% | 27% | 31% | 12% | 11% |
| West Midlands | 14% | 38% | 29% | 12% | 6% |
| East of England | 19% | 27% | 25% | 19% | 11% |
| London | 11% | 12% | 25% | 23% | 29% |
| South East | 16% | 26% | 34% | 14% | 10% |
| South West | 11% | 32% | 42% | 9% | 6% |
Source: ONS, Annual Population Survey, 2018
We find that the average pay of EY workers differs by an area’s deprivation level, with workers in the most affluent areas being paid £7.28 per hour, on average, compared with £7.30 in the most deprived areas. However, differences begin to emerge among higher earners. The data shows that approximately 26% of EY workers in the most affluent areas are paid above £9 compared with 20% of workers in the most deprived areas.
Low funding rates for 30-hour childcare are a barrier to a stable workforce in all areas, but participants’ focus in affluent and deprived areas varies. Those in affluent areas explained that funding rates were insufficient to cover high running costs. This risked settings’ long-term viability, although settings in affluent areas could often rely on parental top-up fees to supplement the funding rates and keep them afloat. In contrast, a key concern for participants in more rural areas was the combination of low funding rates and a limited supply of children.
Differences by provider type
Clear differences in pay levels emerge across provider types, favouring public sector employees.[footnote 63] On average, public sector workers earn £8.43 per hour while private sector workers earn £7.10 per hour. Around 47% of EY workers in the public sector earn above £9 compared with 20% in the private sector (Figure 3). At the lower end of the pay scale, 26% of public sector workers are paid below £7 per hour, compared with 47% of private sector workers.
Figure 3: Banded hourly pay for EY workers by provider type
| Provider type | £0 to £5 | £5 to £7 | £7 to £9 | £9 to £11 | £11 and over |
|---|---|---|---|---|---|
| Private sector | 14% | 33% | 33% | 11% | 9% |
| Public sector | 11% | 16% | 27% | 25% | 22% |
Source: ONS, Annual Population Survey, 2018
Our study participants perceived PVIs to be less stable than maintained settings, as maintained settings offer higher pay and better benefits at all qualification levels. This often leads to career-oriented practitioners moving from PVIs to maintained settings once they have gained their Level 3 qualification.
Even though participants perceived the hourly rate to be higher in maintained settings, they explained that it is possible to earn more at PVIs that are open throughout the year and for long hours. They regarded this as a potential reason for remaining at a PVI setting. In contrast, maintained settings restrict how much practitioners can work and earn, as they are only open during term time.
Participants also reported that PVIs with high turnover bring in EY practitioners from staffing agencies. These practitioners earn more money as agency staff, so they do not tend to accept permanent roles. However, this further destabilises these settings.
Both provider types faced funding shortfalls following the introduction of the 15 and 30 hours of funded childcare, but they responded differently. At PVIs, managers paid staff the minimum wage, as this was all they could afford. In contrast, maintained settings responded to the funding shortfalls by decreasing the number of staff they employed, which put high demands on the remaining staff.
There have been a lot of cuts. We currently have an apprentice, but she’s been told that they [the setting] can’t afford to pay her after Christmas, so then we will be one member of staff down.” – Maintained-setting worker, affluent/urban.
Childminders:
Childminders reported facing three specific challenges which related to their self-employed status. First, they do not receive sick or holiday pay. When childminders feel too unwell to work or go on holiday, they need to close their provision and go without income. As a result, they risk losing children and income if parents find alternative providers.
The second challenge childminders faced was an unstable income. Because parents only pay for the time their child is cared for, childminders’ incomes vary depending on the number of children in their care. Those childminders who care for one child or have children that require only part-time care reported struggling financially.
”It works quite well if I’ve got my son and three other children, but if I’ve just got my son and one other child, I charge £4.20 an hour, so I’m not making minimum wage.” – Childminder, affluent/urban
Since the introduction of funded hours, childminders described facing a third challenge: increased competition with maintained settings. To secure funded children, childminders reported that maintained settings offer free care to children who have not reached the age of three but will turn three before the end of their first term at the setting. Maintained settings do this by telling parents that sending their child to nursery early will guarantee their child’s place in reception. Childminders are unable to do this because they cannot afford to give a spot away for free.
“Since the 30 free hours started, I’ve had 3 full-time children who have gone on to just nursery care. That’s a huge amount of competition here and if you’re constantly having to compete, that’s quite disheartening to give up somebody you’ve worked hard with to a competitor.” – Childminder, affluent/urban
6.3 Case study: Kate C, South-east
Early years manager of term-time pre-school, aged 44; 15 years in sector; role is sole household income; single mother of two.
“I’ve been in the sector for 15 years. In that time, I’ve had to rely fairly heavily on Childcare Tax Credits and now Universal Credit (UC). In eight years as manager, I’ve never had more money coming in than I did eight years ago. Whatever I’ve had as a pay rise has reduced my UC. I have to rely on it to pay bills, just to continue living in my house with my children.
There are eight of us working here. I’m full-time; everyone else is part-time. We’re all trained to Level 3 or degree. I should really be paying my early years teacher way more that she gets. She’s well above minimum wage, but when you compare it to other degree-level jobs, she’d probably be getting about double what we’re able to pay her.
Most of the people in the sector are mums or young people starting out – young people who have no idea that they’re not going to get the remuneration that they deserve. That’s not a good place to attract fresh blood.
I’m waiting for my son to finish school and then I’ll have to relocate and find a different job. It’s not a nice feeling when you put your heart and soul into a job and you’re going into more debt every month. At 44, I sometimes have to rely on my parents to bail us out. I haven’t taken my family on holiday for 10 years.
We’ve been screaming for years that brain development from zero to five is vital, so why are we the bottom of the pile every time? Why isn’t there a pay scale in line with teaching assistants? They don’t have to have the same level of qualifications that mine do. There’s no equivalent to teacher pay scales for us, so it’s hard to gauge where we should be.
We increase our staff’s wages in line with increases in the National Minimum Wage. Our assistants are on minimum wage and our L3s not much above that. This year we froze pay because not everybody was working due to COVID. However, we had to increase the L3s’ rate because otherwise they’d have slipped below minimum wage.
There’s a big hike next April to get us to £9, but that’s going to have a huge impact on our wages bill. The increases haven’t been in small increments, like 0.5% or 1%; they’ve been in big chunks like 4.5%. We have to find those, but our early years funding has only gone up 1%.
Most of us do this job for love, not money. But love doesn’t pay the bills.”
6.4 Work demands
Both the literature review and the interviews highlighted work demands as a source of job dissatisfaction and a possible cause of instability in the EY sector.
According to the APS, EY staff work significantly longer hours than some other groups in the study. Approximately 11% of EY workers reported working more than 42 hours per week, compared with 3% of retail workers, 6% of female workers and 13% of the total working population. Long working hours, especially when unpaid or underpaid, can reduce job satisfaction and lead to higher staff turnover.
Interview participants identified two specific dimensions of work demands: long hours of strenuous work ‘on the floor’ with the children, and demanding paperwork. Both were perceived to have been made worse by the way Ofsted scrutinises the sector.
They described how long hours and inadequate working conditions cause exhaustion and low morale, feeding a desire to leave EY for less-demanding work. Three problems worsen the issue. First, there is an expectation in the sector that staff will simply put up with long hours of physically tiring work. Second, because nurseries can operate at the minimum possible staff-to- child ratio, practitioners feel unsupported during long shifts. Third, resources to help children with additional needs or SEND are often lacking, meaning that individual members of staff have to carry the extra responsibility by themselves.
“There’s that element of ‘Is this worth it?’ It’s sucking all of my energy out and I’m getting a very small amount in return.” – Childminder, affluent/urban
In addition, practitioners reported often having to work long past their paid hours to complete paperwork, such as for EY Foundation Stage monitoring. This is particularly challenging for staff without strong literacy skills. Participants felt frustrated – believing that much of the paperwork is a formality that neither parents nor schools will use. Additionally, they believe that the demands of paperwork are keeping them from engaging with the children.
“The amount of paperwork we do for what we do is crazy. The worst thing is it takes staff away from actually interacting with the children.” – PVI practitioner, affluent/urban
There was a sense that scrutiny from Ofsted directly causes workers to leave the sector. Practitioners reported inspections leading to even longer working hours, more stress and yet more paperwork.
“There is that feeling with the thought of being inspected that all of a sudden someone is just going to say ‘Oh no, you’re doing it totally wrong and actually we’re going to say unsatisfactory and that’s going to be it.’ That’s not a nice feeling.” – Childminder, affluent/urban
Differences by regions
The national picture of long working hours is partially reflected across all regions. On average, one in nine EY workers from all regions reported working more than 42 hours per week, and this was also the case across rural and urban areas. There is greater regional variation in the proportion of workers working for between 31 and 42 hours, ranging from approximately half the EY workforce in the west midlands to just over a quarter of the EY workforce in the east midlands.
Differences emerge between rural and urban areas, with urban-area workers reporting higher numbers of hours. Some 31% of rural-area workers reported working between 31 and 42 hours per week, compared with 37% of urban-area workers. Also, a higher proportion of EY professionals in rural areas work between 0 and 30 hours (57% of workers in rural areas vs 51% of workers in urban areas).
Participants in deprived areas reported a high proportion of children with complex needs in their settings. This includes those with English as an additional language (EAL), with mental health issues or living in poverty. These conditions mean practitioners find their remit extended to supporting children’s families, which adds to pressure and workload.
“We’re essentially their social worker half the time.” – PVI practitioner, deprived/urban
Pressure and workload intensify where little additional support is available to staff. A teaching assistant in a nursery school described how the removal of a family outreach centre attached to the nursery had increased the volume and complexity of safeguarding work for practitioners.
“We’ve got so much going on with safeguarding … We … [are] trying to do the role that our outreach colleagues used to do.” – Maintained-setting practitioner, affluent/rural
Participants in deprived areas discussed how some Ofsted requirements are more difficult for them to meet, which increases pressure on staff and reduces job satisfaction. A practitioner in a deprived area in the north-west illustrated this with reference to parental engagement. They explained that parents’ reluctance to engage with school staff – driven partly by cultural and language barriers – is “stressful” for all practitioners.
“We try, but we can only do so much. We’re only one half, they need to work with us, so then we feel the pressure because even Ofsted have said parent partnership is not where it needs to be … it’s just like a losing battle.” – PVI practitioner, deprived/urban
The quantitative analysis also highlighted differences in working hours between areas with different levels of deprivation. In the most affluent areas approximately 16% of workers work more than 42 hours per week, compared with 9% of workers in the most deprived areas.
However, this is not unique to the EY sector, as 15% of the working population in the most affluent areas reported working more than 42 hours compared with 12% in the most deprived areas.
Differences by provider type
The quantitative analysis found that private sector workers are more likely to work longer hours. On average, 14% of private sector workers reported working more than 42 hours per week, compared with just 2% of public sector workers. Again, this trend is not exclusive to the EY sector. Among the working population, approximately 15% of workers in the private sector work more than 42 hours per week, compared with 7% in the public sector. Nonetheless, it fits with the interview findings, where there is a perception among interview participants that working conditions are better at maintained settings because of shorter opening hours and a term-time- only schedule. These characteristics encourage more qualified practitioners, particularly those with children, to move from PVIs to maintained settings,.
Participants reported that working conditions vary across PVIs depending on the size, management and type of setting. One local authority lead explained that private PVIs often require staff to work long hours and perform additional duties such as cleaning. In comparison, not-for-profit PVIs tend to offer shorter workdays and term-time-only hours.
Practitioners at PVIs believe the increase in paperwork required by Ofsted is more difficult for PVIs. They rely more on apprentices and lower-qualified staff to perform administrative tasks, with which they could struggle because of lower literacy levels. This view contrasted with that of practitioners at maintained settings who explained that, because of the above-mentioned job cuts, they are devoting more time to paperwork and less time to the children in their care.
Childminders expressed a very specific set of challenges. Although they generally enjoy the flexibility self-employment offers, there are multiple challenges which contribute to them leaving the profession or moving to other EY providers. One is the lack of support and designated time to meet Ofsted requirements, which they believe practitioners at maintained settings or PVIs can rely on.
“In nursery you have five kids or whatever to do your observations and you get time within your day to do them … We have to do the accounts, the cooking, the cleaning, the shopping, all our observations and everything that managers and everything would pick up.” – Childminder, deprived/urban
Another unique challenge that childminders reported is the lack of physical separation between work and home, which makes it difficult to switch off. They described wanting ‘their house back’ from the toys and posters, especially when their own kids grew older. Childminders discussed the pressure to open their provision for long hours to compete with PVIs. This has resulted in childminders leaving their job to enter maintained settings as teaching assistants, where work is separate from their home and working hours are more fixed.
6.5 Demographic characteristics
Several studies described in the literature review suggest that a young and predominantly female EY workforce can pose challenges to the stability of the sector and that turnover is lower for older workers, which may be connected to an educator’s position within the setting.[footnote 64] Further, some short-term instability can be caused by female workers deciding to take a career break, such as maternity leave. The APS data confirms that the English EY workforce is predominantly composed of young, female workers. Some 40% are aged between 16 and 29, 34% between 30 and 44, and 26% between 45 and 64. Meanwhile, 96% of EY professionals are female, with no differences by region or provider type.
The qualitative research did not investigate how demographic characteristics affect participants’ views and experiences of staff stability.
Differences by regions
At a regional level, the demographic characteristics of the EY workforce do not vary significantly. The proportion of workers aged between 16 and 29 is around 40% at national level and ranges from 36% in London to 44% in the north-east. Generally, the north of England and the midlands have a slightly higher proportion of workers aged between 16 and 29, at 42% on average compared with an average of 39% in all other regions. The south and east of England have a larger proportion of workers in the 30 to 49 age group, at 45% compared with 40% in the midlands and north of England. The share of workers over 50 is slightly higher than the national average (17%) in Yorkshire and the Humber (22%), the north-west (19%) and London (19%).
We find some differences in the age distribution of the EY workforce between urban and rural areas, with a higher proportion of young workers in urban areas than in rural areas.
Approximately 41% of urban workers are aged below 30, compared with 35% of workers in rural areas (Figure 4). Differences are marginal at the other end of the age spectrum, with 19% of workers in rural areas aged above 50, compared with 17% of urban area workers. Finally, 49% of workers in the most deprived areas are aged below 30, compared with 35% of workers in the most affluent areas. The reverse is true for the older population: 13% of workers in the most deprived areas are aged between 50 and 65, compared with 21% in the most affluent areas.
Figure 4: Age distribution of EY workers by population density and institution type
| Description | 16 to 29 years | 30 to 49 years | 50 to 64 years |
|---|---|---|---|
| Rural | 35% | 46% | 19% |
| Urban | 41% | 42% | 17% |
| Most affluent areas | 35% | 45% | 21% |
| Most deprived areas | 49% | 38% | 13% |
Source: ONS, Annual Population Survey, 2018
The qualitative research did not investigate how demographic characteristics affect participants’ views and experiences of staff stability.
Differences by provider type
The data shows that public and private EY employers have similarly high proportions of female workers. However, private sector workers are on average younger than public sector workers. Across the age groups, the largest proportion of EY workers in the private sector are aged between 20 and 24 (19%, compared with 8% in the public sector). By comparison, the largest age group in the public sector is 30 to 34 (17% of workers in the public sector, compared with 13% in the private sector).
The qualitative research did not investigate how demographic characteristics affect participants’ views and experiences of staff stability.
6.6 Training and continuous professional development
The EY workforce in England is often described as relatively underqualified compared with workers in other sectors.[footnote 65] Nationally, 20% of the EY workers hold at least one GCSE at A*-C grade as their highest qualification, which is similar to the proportion of female workers (22%). However, larger differences emerge for more advanced qualifications. For instance, the EY sector has a larger proportion of workers whose highest qualification is at A level (44% of EY workers, compared with 21% of female workers) but a much smaller proportion of workers whose highest qualification is at degree level (16% of EY workers, compared with 36% of female workers).[footnote 66]
Against a backdrop of low qualifications, only 17% of EY workers reported receiving job-related training. Relative to other groups in the study, EY workers are nearly twice as likely to receive CPD as retail workers (9%), and somewhat more likely than the female working population (14%) and the entire working population (13%). However, these figures do not present the whole picture. For example, they do not cover the quality of the CPD undertaken. It may also be the case that the EY workforce, whether because of the nature of their work or because of their relatively lower levels of qualifications, require more CPD than workers in other sectors to achieve workforce stability. Studies suggest that employees respond well to CPD opportunities, as they feel more integrated into the sector after receiving CPD, and they value learning from other practitioners. In contrast, limited access to CPD opportunities can cause professionals to leave the sector.[footnote 67] However, some managers reported being reluctant to upskill their staff, as they believed employees would leave for higher-paying occupations, especially in the school system.[footnote 68]
Interview participants identified three barriers to stability linked to professional development and progression in the EY sector. The first was a perceived trend of junior staff entering the sector with entry-level qualifications who are inadequately prepared for the job. Participants felt that courses such as National Vocational Qualification (NVQ) Level 3 do not equip practitioners properly for work in EY. Specific difficulties with new staff include problems with basic literacy (required for paperwork) and poor understanding of the fundamentals of working with children. Managers said they regularly need to let new staff go because they fail to meet the basic requirements of the work.
“We have found that those practitioners coming in from colleges that have trained them to Level 3, we wonder how on Earth they’ve got their Level 3 on occasions. They struggle to … put a comprehensive paragraph together that’s spelt correctly and with correct punctuation.” – PVI setting manager, affluent/urban
This was perceived to increase workload and stress on managers. Poor preparedness of new joiners, who are more likely to call in sick or simply not turn up, also creates knock-on effects for other staff in the team, lowering morale and making them more likely to leave.
“If I’ve got staff phoning in sick, or apprentices that just don’t want to turn up, I think it just affects staff morale, to be perfectly honest, and they get fed up and frustrated.” – PVI setting manager, deprived/urban
The second perceived problem was inadequate provision to help staff upskill through short-term professional development. Participants indicated that councils offer basic courses, which are most useful to workers at the start of their careers, but rarely anything more advanced. Added to this, participants reported that settings sometimes struggle to pay for cover for staff attending training.
Training gaps add to practitioner workload. Without the right training, participants can struggle to support groups with additional needs, such as babies, or EAL and SEND children.
“Our staff that work with our youngest and most vulnerable children need to have specific training, but actually there is very little out there, particularly that is offered locally. Actually, I don’t think our LA [local authority] offers anything at the moment linked to that.” – PVI setting manager, affluent/urban
Third, participants described difficulties with longer-term professional development, such as working towards an NVQ Level 3 or other qualifications. Reasons for this include the cutting of bursaries or grants, which has reduced opportunities for staff to acquire degree qualifications. Although some EY workers consider paying for these qualifications themselves, many are seen as unaffordable.
“I’d really like to go and do a degree part-time in EY childhood studies, but it’s so expensive and there’s no funding any more to do these things.” – PVI setting manager, deprived/urban
Participants also felt that they have little incentive to get these qualifications as they are unlikely to lead to higher pay or better conditions. Practitioners described situations where there are vacancies in a setting for senior positions, such as SEND co-ordinator or deputy manager, but which are unlikely to come with any financial reward. When facing impractically expensive qualifications and no guarantee of financial reward for upskilling, participants struggle to see a future in EY.
“If the training and development’s not there, they will leave the sector, because they can’t see a career progression.” – Director of Children’s Services, affluent/urban
Differences by region
The distribution of qualifications among the EY workforce is broadly similar across regions, with some exceptions. For instance, the east and west midlands have the highest share of staff holding a GCSE or equivalent as their highest qualification, at 32% and 28% respectively, whereas all other regions are close to the national average of 20% of workers (Figure 5). As expected, Level 3 qualifications are the most common qualifications held by EY workers, ranging from 36% in London to 52% in the south-west. Most regions have a similar proportion of degree-level qualifications to the national average (16%), excluding the north-east (where 25% of the workforce is qualified to degree level) and the east midlands (9%).
Figure 5: Highest qualification held by EY workers and access to job-related training by region
| Region | GCSE grades A* to C or equivalent | GCE A level or equivalent | Higher education | Degree or equivalent | Other qualification | Continuous professional development |
|---|---|---|---|---|---|---|
| London | 16% | 38% | 18% | 18% | 10% | 16% |
| South West | 17% | 52% | 13% | 16% | 2% | 20% |
| North East | 17% | 48% | 8% | 25% | 2% | 13% |
| North West | 18% | 47% | 13% | 18% | 4% | 17% |
| Eastern | 18% | 46% | 14% | 15% | 6% | 18% |
| Yorkshire and Humberside | 18% | 49% | 10% | 14% | 9% | 16% |
| South East | 21% | 42% | 13% | 18% | 6% | 18% |
| West Midlands | 28% | 43% | 10% | 15% | 4% | 16% |
| East Midlands | 32% | 43% | 17% | 9% | 0% | 15% |
Source: ONS, Annual Population Survey, 2018
Access to job-related training also shows a slight regional variation (Figure 5). The proportion of workers who receive job-related training ranges from 13% in the north-east to 20% in the south-west. There does not seem to be any significant correlation between the rate of access to job-related training and the level of qualifications held.
In the most deprived areas in England, a higher proportion of EY workers have low qualifications compared with the more affluent areas (Figure 6). For example, 47% of workers in the most deprived areas hold an A level or equivalent as their highest qualification compared with 40% of workers in more affluent areas. Additionally, the latter have proportionately more workers with a higher education qualification (16% vs 11% in the most deprived areas) and a degree (21% vs 13% in the most deprived areas). Despite these differences, a similar proportion of workers in both groups (16%) have access to job-related training.
Figure 6: Highest qualification levels held by EY workers by deprivation levels
| Highest qualification level | Most deprived areas | Most affluent areas |
|---|---|---|
| Degree or equivalent | 13% | 21% |
| Higher education | 11% | 16% |
| GCE A level or equivalent | 47% | 40% |
| GCSE grades A* to C or equivalent | 20% | 19% |
| Other qualification | 7% | 4% |
Source: ONS, Annual Population Survey, 2018
Rural areas have a lower proportion of workers qualified to GCSE A* to C level (16%, vs 20% in urban areas). In addition, 47% of workers in rural areas hold an A level or equivalent qualification as their highest qualification and 17% hold a higher education qualification, compared with 42% and 13% respectively in urban areas. Both groups have a similar proportion of degree-qualified workers, at 16%. Despite the differences, a similar proportion of workers receive job-related training (17% in rural areas and 18% in urban areas).
Accessing CPD opportunities appears particularly difficult for participants in more rural areas. A reason for this is a lack of local providers to deliver degree-level courses. This requires practitioners to travel long distances or leave their area to pursue Level 4 or Level 5 qualifications. This adds to a perception that practitioners in urban areas or university towns find it easier to develop professionally.
“If you’re in a rural area you are a bit stuck, really. There are not the same opportunities.” – PVI practitioner, affluent/rural
Differences by provider type
Practitioners at PVIs believe maintained settings offer more opportunity for progression, as these settings have more clearly defined roles.
“Say you’re a teacher in a nursery. You have the opportunity to then become an EY lead and then maybe something else in senior management team, maybe become an inclusion, SENCO, maybe becoming deputy head, head, this kind of thing. You’ve got that potential.” – PVI practitioner, deprived/urban
This fits with findings from the quantitative research, which show that private sector employees are less likely to receive CPD training. Approximately 17% of private sector workers receive CPD compared with 22% of public sector workers. However, the differences in CPD are not unique to the EY sector, as the data for the total working population shows that 11% of private sector workers receive CPD compared with 20% in the public sector.
Meanwhile, the public sector has more degree-qualified and higher-education-qualified workers and the private sector has more GCSE- and A level-qualified staff (Figure 7).
Figure 7: Highest qualifications held by EY workers by setting type
| Highest qualification level | Private sector | Public sector |
|---|---|---|
| Degree or equivalent | 15% | 22% |
| Higher education | 12% | 17% |
| GCE A level or equivalent | 44% | 38% |
| GCSE grades A* to C or equivalent | 19% | 17% |
| Other qualification | 6% | 6% |
Source: ONS, Annual Population Survey, 2018
However, this contrasts with the view of practitioners at maintained settings, who reported that there is little room for progression at their settings. This was partly attributed to progression at maintained settings being conditional on gaining certain qualifications, such as qualified teacher status (QTS). In contrast, because PVIs do not have a statutory requirement for room leads or managers to have QTS, it is possible to progress at a PVI through experience alone.
Stability at PVIs is also at risk because of practitioners moving from one PVI to another to progress. Participants explained that at bigger settings with a higher variety of levels and roles there is often a clear progression pathway. For example, a manager of multiple settings explained that at each setting there is a career progression ladder: practitioner, senior practitioner, room leader, deputy manager and manager. In contrast, at smaller stand-alone settings participants reported that opportunities for progression are only available when an existing member of staff leaves.
Childminders did not perceive progression to cause instability in the workforce. This appears to be because they know when entering the role that there is no possibility of progression. However, they believe they are insufficiently supported to engage with training by their local authority, which they see primarily as catering to PVIs and maintained settings. One reason for this is that local authority training is only offered during the day, which requires them to close their setting and lose income.
“They do offer training but it’s more directed at nurseries because they hold it within the day, and obviously if we all work daytime, Monday to Friday, there’s no way we can get to any of the venues. It is just a joke, really.” – Childminder, deprived/urban
They also expressed similar frustration about the decline in local authority training. Childminders who had previously received LA training found it helpful, as they learned about Ofsted requirements. They expressed disappointment that they are expected to deliver the same level of education as other practitioners who have easier access to relevant training.
“I think there’s a lot of pressure on childminders to be basically EY educators, so to be these professional educators, but at the same time we’re not given any training. We can go out and find our own training. We can buy it ourselves. We’re told don’t kill a child or this is how you don’t poison a child, but we are not taught how to educate but we are expected to educate.” – Childminder, affluent/urban
Both factors contributed to the sense among childminders that, compared with other providers, they are not well supported to meet Ofsted requirements and manage their setting.
6.7 Case study: Lydia Pryor, Aldborough
Lydia Pryor, pre-school leader, 50, has worked in the sector for 11 years.
“The pre-school I run started out as a grassroots organisation, then the whole early years workforce was professionalised through Every Child Matters and Sure Start under Labour. That was a good thing, but a lot of the structure and funding was dismantled by the Coalition government. Now, the expectations remain high, but you could earn more at Tesco.
There’s no sense of progression. I recently had an 18-year-old doing some work experience with us. She was good, and enjoyed it, but I was conflicted about encouraging her to pursue this career: she would have to find £3,000 for an NVQ Level 3, which would only earn a minimum wage, with no prospect of a pay rise.
My deputy recently handed in her notice because she found another job that pays more, and I had nothing that could entice her to stay. She’s a single mum and her children are growing up. She’s had enough of just making do and worrying about money when her car breaks down.
I have a Level 2 staff member who would be a great deputy with a Level 3, but there is no funding for her to do it. So I’m missing out, she is missing out and the children are missing out, because research shows that a more qualified workforce leads to better outcomes for them.
We’re advertising for a new deputy, but have only had two applicants. One was excellent, but we can’t afford what she wanted, and I’m concerned that we won’t be able to fill that role. It’s a statutory requirement that we have a properly qualified deputy, so it’s become my priority.
Things like that have a domino effect on morale. Our energy and focus is pulled away from giving our children and their families care, support, safeguarding and quality of education.
It’s a constant stress, A lot of work goes unpaid, such as non-contact time support for SEN children. With funding frozen for five years, and a shortfall of over 20% per child, a lot of the burden falls on the manager: curriculum planning, SEN support, running the charity committee, health and safety, safeguarding, unblocking toilets.
I have so much responsibility and we all work so hard. I’ve told my committee that I can do one more year, and then need to earn more. The response is “we cannot afford to pay our staff what they are worth”. But, as we see with the deputy role, how can we afford not to pay properly if it means we can’t staff positions?”
6.8 Organisational climate and culture
The EY workforce reported higher levels of happiness and self-worth in comparison with the total working population. Approximately 20% of EY workers reported being “completely happy” and 22% believe the things they do in their life are “completely worthwhile”, compared with 15% and 16% of the total workforce respectively. However, EY workers rank similarly to the total workforce for the proportion of workers who state they are “completely satisfied” (13% of EY workers vs 12% total workforce) and “not at all anxious” (32% EY workers vs 29% total workforce).[footnote 69]
According to interview participants, the culture and ethos of an EY setting can affect a worker’s decision to remain in their job, or in the workforce at all. Participants said that they are more likely to work long term in an EY setting with a strong, positive culture. This was characterised by settings where the management support staff, involve them in decision-making and foster mutually supportive relationships between them.
“[In participant’s previous setting] we had the same staff all the time that I was there … it was because we all worked together … because we all respected each other. We all took in turns doing the planning, we all had regular meetings to meet these goals, and I felt like I was supported by the manager.” – PVI practitioner, affluent/rural
In contrast, difficult relationships with management are a reason for leaving the setting. For instance, managers who limit practitioners’ autonomy to make basic decisions such as disciplining a misbehaving child are regarded as problematic. Negative relationships between staff are also a key reason for leaving a setting. There was a feeling that younger staff members are particularly vulnerable to bullying by older, more experienced workers.
“I’ve also found when I’ve worked a lot of bullying on younger, especially in bigger settings, bullying on younger educators from older educators that has caused them to leave.” – PVI practitioner, affluent/rural
A lack of unionisation was perceived as further contributing to instability in the sector. Participants who are union members believe this has led to a voiceless workforce that is largely unaware of its rights and has no one to turn to for workplace support.
“I’m just happy that I’m in a union. I keep telling my other friends to go in it, because I feel like I’ve got someone there if I need it, or I can ring someone for advice … I think a lot of people leave just because they don’t think they’ve got any rights.” – PVI practitioner, deprived/urban
Differences by region
It is important to note that the responses to the wellbeing questions in the APS are both subjective and open to interpretation. Consequently, it can be difficult to understand what influences worker wellbeing and to establish any relationship with their employment.
Nevertheless, the regional breakdown can provide a general overview of the wellbeing of workers across the country, who are likely to be influenced, at least in part, by labour market factors.
There are some considerable differences in wellbeing among EY staff in different regions (Figure 8). The east midlands stands out for having the highest proportion of workers who believe the things they do in their lives are “completely worthwhile” (33% vs 22% nationally), but it has a relatively low proportion of workers who are “completely happy” (13% vs 20% nationally) and “completely satisfied” (9% vs 13% nationally). Regarding happiness, approximately 28% of workers in the north-east and 25% of workers in Yorkshire and the Humber report being “’completely happy”, both exceeding the national average of 20%.
Figure 8: Proportion of EY workers expressing high levels of worth, happiness and satisfaction by region
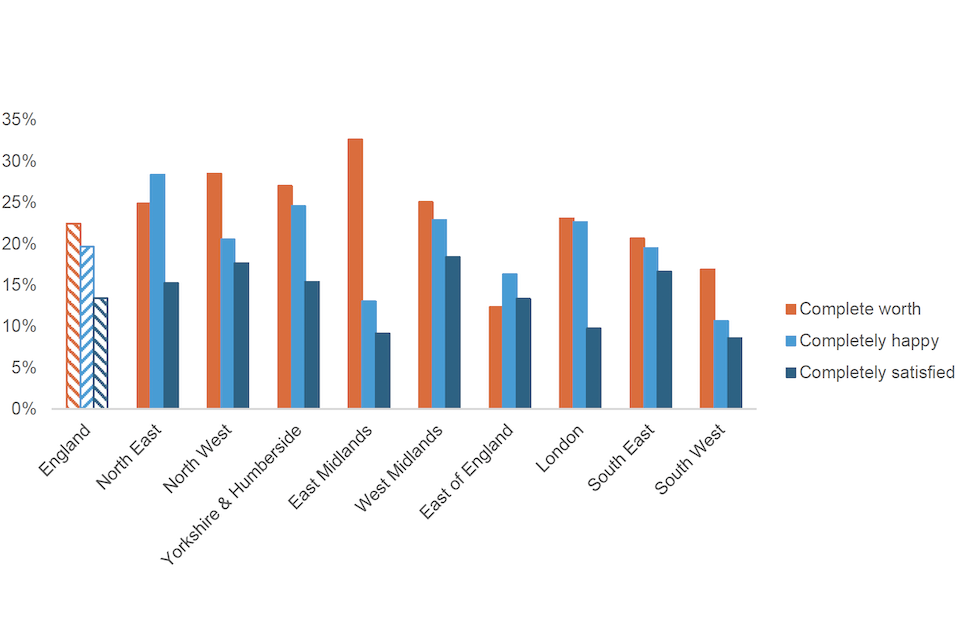
Source: ONS, Annual Population Survey, 2018
There is less regional variation regarding anxiety, but there is a clear geographic divide. Approximately 39% of workers in the north and the west midlands reported not feeling anxious at all, against only 28% of workers in the south, the east midlands and east of England.
No significant differences in wellbeing measures can be observed by population density. Instead, a higher proportion of workers in more deprived areas reported being “completely happy” (23% in deprived areas vs 18% in affluent areas) and that their lives are “completely worthwhile” (25% in deprived areas vs 20% in affluent areas). Finally, slightly fewer workers in deprived areas reported being “completely satisfied” (13% in deprived areas vs 15% in affluent areas).
The geographical breakdown of anxiety levels shows no difference across rural and urban areas in the proportion of workers who responded “not at all anxious” when asked how anxious they felt (31% rural vs 31% urban). However, there are marginal differences across deprivation levels, as 34% of workers from the most deprived areas responded that they are “not at all anxious” compared with 32% in the most affluent areas.
From the qualitative research, interview participants in affluent areas reported that parents appear to be more involved with the setting. They welcome this, primarily because it decreases their workload, for instance when parents volunteer to organise nativity plays. A practitioner who has worked in both affluent and deprived areas believed that time is the key reason why parents get involved or not.
“In the poorer settings the parents haven’t got the time … they’re so busy … that they don’t have the time to build up that relationship or volunteer.” – PVI practitioner, affluent/rural
A perceived benefit of working in small rural settings is the sense of community and belonging participants feel. These settings tend to be staffed by people who live in the village and have close ties with colleagues and parents. This familiarity makes them feel appreciated and shapes their overall job satisfaction.
“Everybody seems to know everybody in a village and so a lot of the staff … people come in, chat to each other, feel like a community. People don’t then want to move from that because they feel valued and wanted.” – PVI practitioner, affluent/rural
Another perceived advantage specific to rural areas is the availability of better outdoor and play areas, which participants felt makes their work easier and more enjoyable.
“When you’ve got an urban setting, quite a lot of them have only got concrete or tarmac.” – PVI practitioner, affluent/rural
Although recruitment is a challenge in all areas, the type of challenge varies. Participants felt rural settings were less viable, as they have a more limited workforce to draw on to fill vacancies. In contrast, participants in urban areas spoke about a strong reliance on short-term agency staff to temporarily fill vacancies; this could add to the workload of permanent staff who need to upskill agency workers.
Differences by provider type
Practitioners at maintained settings did not mention organisational culture and setting as a barrier to stability. A potential reason for this might be the lesser variation in the structure of maintained settings.
There were different views among local authority leads and practitioners at PVIs about which type of setting has the best approach to setting culture and leadership. One view was that in private PVIs, leadership and culture are worse when setting proprietors own other businesses and view the setting as simply another business. Another view was that bigger settings tend to invest more in their workers and have a better ethos of supporting workers.
There were also contrasting views around the stability of community-run, not-for-profit settings. One perspective was that stability is lower at these settings because staff do not receive enough support from management committees. This is because these are made up of parent volunteers who lack the time and knowledge to carry out the increasingly complex responsibilities required by Ofsted. The responsibilities then fall to staff, who feel overburdened. A local authority lead provided the example of a not-for-profit setting in their area that had recently lost its manager and deputy manager because they had not received enough support from the management committee. An alternative view was that stability is greater at these settings because, unlike at for-profit settings, they reinvest left-over money back into their staff, creating a better ethos at the setting.
Given the range of differences between provider types explored so far, we might expect wellbeing measures to be more positive for staff in the public sector than for those in the private sector. However, the quantitative data shows that private sector workers reported marginally higher levels of happiness, satisfaction and self-worth, and lower levels of anxiety. In terms of happiness, 21% of private sector workers stated they were completely happy, compared with 15% of public sector workers. The differences are smaller for levels of satisfaction, at 14% in the private sector and 12% in the public sector. Similarly, 23% of private sector workers reported very high levels of self-worth, compared with 20% in the public sector. Low anxiety is also more common in the private sector, with 32% of workers not feeling anxious at all compared with 28% in the public sector.
Childminders:
As explained above, the downside to ‘being their own boss’ means that childminders feel less supported than colleagues who work in maintained settings or PVIs. Those who do receive support from their local authority are more confident in their practice and appreciate the assistance and advice they receive. For example, a childminder explained that in their local authority there is a buddy system which pairs new childminders with experienced ones.
There is also a liaison officer who offers regular meetings and is a point of contact for queries. Those childminders who do not have access to a strong support network offered by their local authority cope by creating their own informal networks to fill this gap.
“From a childminder’s point of view, it can be quite a lonely job, so to have a couple of childminder friends that we can chat to, you can bounce ideas off, we can meet in the park, is just a real great advantage. I think without my two childminding friends, I don’t think I’d still be working, to be honest.” – Childminder, affluent/rural
Childminders reported that the lack of formal support is particularly difficult for new childminders. They speculated that a lack of support would not drive experienced childminders out of the sector but could be a reason why new childminders left.
6.9 Knowledge and societal views of the sector
Interview participants noted that society’s under-appreciation of EY contributes to an unstable workforce. They saw inadequate pay and underfunding as characteristic of the low status. Workers believe they do an important job but want to leave because they do not feel valued.
“You get the constant joke, ‘What do you do? You just colour in with the children’ … I think there’s just not that status attributed to it.” – PVI practitioner, deprived/urban
There was a view that the limited value attached to the profession leads to people entering the sector unaware of its challenges. This is made worse by qualification bodies not vetting candidates sufficiently to make sure they fulfil the professional requirements. These workers are then likely to leave when confronted with the responsibilities and paperwork.
“There used to be a really good vetting system for people that were coming into childcare, but I think that a lot of the training organisations are just generally, if someone turns up, then that’s good enough for them.” – PVI setting manager, deprived/urban
Differences by provider
The quantitative research did not produce findings about differences by provider related to the reputation of the sector.
Childminders:
Childminders were frustrated at being perceived as ‘babysitters’ by parents, friends and other EY practitioners. This perception has two consequences. First, people who enter the sector to become childminders are unaware of what is required and this mismatch in expectations could lead to them leaving the sector. Second, childminders leave because they do not feel valued by parents, the government and others in the sector. They believe they are viewed as inferior to nurseries, even though they are required to be qualified at Level 3.
“Nobody gives us a recognition; we’re just a childminder, we’re just a babysitter to a lot of people … that brings us all down. That’s part of why people leave; because we don’t get the recognition, we are just babysitters to a lot of people.” – Childminder, deprived/urban
Group-based and school-based providers:
At both provider types, participants believed new entrants are aware of the professional demands. An issue that appears unique to PVIs is the increase in new entrants who lack the required skills to perform key tasks, such as completing paperwork. Managers attributed this to a tendency of school career advisers and teachers to ‘push’ less academic students into the sector.
“We don’t need somebody that can come in and just babysit children and look after them. It’s so much more. They have to be literate, they have to be able to read and write effectively, to do the required reports and observations and things that we require.” – PVI setting manager, affluent/urban
6.10 Summary
The EY workforce in England faces several key barriers to its stability, including pay, workload, training opportunities, demographic characteristics and organisational culture. These barriers were highlighted by a review of the relevant literature, and we investigated to what extent they were present in England, and how far they differed by region and type of EY provider.
We found that all five of the potential barriers described in the literature review are relevant in the UK context. In the EY sector in England, workers are predominantly young, the vast majority are female, and workers are paid less than average, work longer hours, and have lower qualifications, though they receive more frequent training.
We found that some of these barriers are much more prominent in some regions or types of area than others, and in some types of EY providers than others. As many of the practitioners we spoke to expressed frustration at their working conditions and lack of compensation, our research suggests that the EY workforce in England faces considerable barriers to its stability.
6.11 Case study: Rachel Skinner, Winchester
Manages a small committee-run pre-school and has worked in early years for 12 years.
“People working in early years are regularly unpaid for administrative work. Parents have my phone number and contact me via WhatsApp or Facebook Messenger, which is fine, but it means that some sort of admin is being done all the time.
Before COVID-19, I was actually paid to do seven hours of paperwork a week, although I did far more. Now there’s even more regulations and safety, and two returns to the council a week, but the financial pressures of the pandemic have cut my paid admin time to just five hours a week.
We try not to ask staff to do things that they are not paid for, but the demands from Ofsted and the council grow each year, while funding has been frozen for five years. Fundraising with parents is harder than it used to be, because property has become so expensive that mortgages are ridiculous, and families have less money.
When I move in a few years’ time, none of my staff are prepared to take on my job, because the tiny increase in pay is not worth the extra workload and responsibility. I think they might struggle to recruit a replacement.
Like many of my contemporaries, my husband has a full-time job so, as a family, we are not struggling for money. I would like to continue in early years, but just for a couple of days a week, and not in management. I’m on £11.70 an hour as a manager, but would happily work at the minimum wage of £9.70 an hour if it means that I don’t have to fret when I haven’t seen a child for three days whose mother is coping with a substance addiction. We have the same responsibility as teachers, but on half the wages and with no support. There’s no head teacher that I can go to for help or back-up: the buck stops with me.
When all our Level 3 NVQ qualified staff move on or retire, I don’t know how we will replace them. Their training was funded, like mine, but a lot of junior staff don’t want to do additional training because it isn’t funded, takes up too much time, and leads to no increase in pay.
Frozen funding, increased workload, extra costs, ridiculous property prices, no funding for training … it’s a perfect storm. Last year we cut every cost possible and we still lost money.”
6.12 Case study: Melanie, Warrington
Melanie owns a childminding setting in Warrington and has worked in early years for 15 years.
“I received my Ofsted Outstanding in October 2019. I am an experienced childminder of 15 years, and feel passionately about the high-quality education that my children receive. I was the first childminder locally to secure an Education Health and Care plan for a child. I helped a child who has autism to make great progress in speech and language. And I feel strongly about the value of a small early years setting to help children with additional needs.
I’ve been open throughout the lockdown. I only had two children in my setting, both of whom are children of key workers. Now lockdown has eased, I’ve started to see other children return, but I still have significant numbers of places, which is having a huge effect on my financial sustainability.
The pandemic is having a devastating impact on my business and others around the Warrington area. At this time of year, I usually have a long waiting list, but now I have five free places for September and three funded places for three- and four-year-olds.
I’ve put in place measures to ensure my setting is as safe as possible. We have extra cleaning and hygiene protocols and we do most of our learning outside. But the fact is that families are worried about sending their children back into childcare. One family whose son I have cared for from nine months to three years old has been so anxious they’ve barely left the house since lockdown began. I am so worried about the emotional, social and educational impact on that boy, along with so many others.
I think we’re going to have significant behavioural problems from children to deal with over the coming months. Children have missed out on so much at a critical time in their development – it’s heartbreaking.
So many childminders and nurseries are being forced to close down. Childminders and early years settings need support to ensure we can sustain our businesses through this pandemic. Without this, I’m worried that, as families start to return to work, there will be nowhere for them to get the high-quality childcare that we offer.
What can’t happen is for children to be looked after by family members or in unregistered care settings. Childminders and nursery staff are trained practitioners offering high-quality care to children, who need to be in the right educational setting to help them achieve their potential.”
7. Conclusions
The six most salient barriers to a stable EY workforce are:
- low income
- high workload and responsibilities
- over-reliance on female practitioners
- insufficient training and opportunities for progression
- low status and reputation
- negative organisational culture and climate
We found strong evidence that the first four issues impact across the country. Similarly, we found weak or no evidence that these barriers vary at a local level, for example between urban and rural areas or between affluent and deprived areas.
However, we found that some barriers vary by provider type. There is strong evidence that practitioners working in PVIs and childminders experience lower income levels and higher workloads and responsibilities than practitioners working in maintained nurseries. There is moderate evidence that practitioners working at PVIs and childminders are less qualified and have fewer opportunities for progression than practitioners in maintained and school nurseries.
Table 1: Summary of key findings
| Barrier | Strength of the evidence: At national level | Strength of the evidence: Differences between regions | Strength of the evidence: Differences between providers |
|---|---|---|---|
| Income | Strong | Weak | Strong |
| Demographic imbalance | Strong | None | Weak |
| Workload and responsibilities | Strong | None | Strong |
| Training and progression | Strong | None | Moderate |
| Reputation | Moderate | None | Weak |
| Organisational culture | Moderate to weak | Weak | None |
7.1 Further research
This study shed light on some of the barriers to a stable EY workforce. It also pointed to some areas that require further research.
The existing evidence is based on workers who are currently in the sector. What is lacking is a study of the people who have left the sector. This would help to clarify the actual motivations for people leaving and would observe their career trajectory after leaving the EY sector. It would enable the exploration of the differences between intention to leave the sector and actual turnover, which are often confounded in the existing literature.
The analysis also found some important differences between rural and urban areas, particularly in relation to workers’ demographics, qualification levels and pay. For example, pay is lower in rural areas than in urban areas. This is partly due to differences in costs of living, but more research is needed to understand the mechanisms that drive these findings.
Several recent studies have shown that the EY workforce is among the lowest paid in the whole economy – especially in light of the increasing responsibilities taken on by EY professionals – and this undoubtedly increases instability in the sector. But low pay is not the only determinant of financial instability. Additional efforts should be made to understand the impact of other elements such as housing, travel time and travel expenses.
7.2 Policy
The Children’s Commissioner’s July 2020 report set out the blueprint for the big-picture thinking required for the entire sector.[footnote 71] Our work emphasises some of the challenges which relate to the workforce element of that picture. There is a clear need for more strategic thinking. And we know previous strategies have existed. However, they have failed either because they lacked the will to implement them or because they were simply not feasible. Our leading recommendation therefore requires not just a new workforce strategy co-created with the sector, but a proper commitment to see it implemented.
Policy recommendations
The government should convene an expert group to devise a career strategy for early years professionals working with children aged zero to eight. The strategy should include:
- a new training pathway that allows people to start as apprentices and upskill along a clear path all the way through to primary school headship, with opportunities to enter the sector at any point along this development continuum, depending on qualifications and experience
- a reform of careers advice services to make sure clear expectations are communicated about what a job in EY entails, while portraying careers as a real professional choice rather than a fall-back option for low achievers
- a pilot of a workforce registry that would allow EY practitioners to create a community, develop a sense of belonging, craft their professional profile and access CPD opportunities
- a clear plan for attracting those further or later on in their careers to join the workforce as EY educators
The government should address the shortfall between the costs to providers of funded places in early years settings and the actual money allocated for those places:
- in the short term, funding rates should increase to match rising operational costs due to inflation and National Minimum Wage increases
- in the long term, the government should launch a review of funding by education phase, looking into alternative systems to allocate public funding
8. Glossary
8.1 Introduction
Gap in attainment
The difference in academic achievement between two groups.
Social mobility
The movement of individuals, families or groups through a system of social hierarchy or stratification.
Workforce stability
The degree to which employees remain in employment in an organisation or sector.
Turnover rate
The percentage of employees leaving a company in a certain period of time.
Disadvantaged communities
A group of individuals residing in a deprived location.
Childminders
Childminders and related occupations provide day-to-day care of children in a domestic setting, and supervise and participate in their play, educational and other activities.
Level 3 qualification
Qualifications at this level can include A levels, a wide array of technical qualifications, apprenticeships and, starting in 2020, T Levels. They are usually taken for the first time at the end of Key Stage 5, when a student is aged 18. They are the final qualification level a student is expected to achieve while in mandatory schooling.
Level 2 qualification
Qualifications at this level can include GCSEs, functional skills in English and maths, a wide array of technical qualifications, and apprenticeships. They are usually taken for the first time at the end of Key Stage 4, when a student is aged 16.
Early years
The period in a child’s life between birth and five years of age.
8.2 Evidence review
Rapid review
Rapid reviews are a form of knowledge synthesis in which components of the systematic review process are simplified or omitted to produce information in a timely manner.
EY practitioner
An individual who works with young children in any school, nursery, or childcare environment.
Child-to-staff ratio
The recommended number of children per staff member as set out in the Early Years Foundation Stage framework.
Continuous professional development (CPD)
The process of tracking and documenting the skills, knowledge and experience that you gain both formally and informally as you work, beyond any initial training.
8.3 Barriers to stability in England
Nursery nurses and assistants
Nursery nurses and assistants care for children from birth up to seven years of age in day or residential nurseries, children’s homes, maternity units and similar establishments.
Playworkers
Playworkers deliver and facilitate play opportunities for children in a range of formal and informal settings including play groups, play schemes, free play locations, and in pre- and after-school activities.
Retail workforce
Sales assistants and retail cashiers sell goods and services in retail or wholesale establishments, accept payments, give change, and arrange finance as appropriate in respect of sales. They obtain, receive and record telephone orders for goods and services.
Total workforce
The total working population estimate provided in the Annual Population Survey.
Female workforce
The total female working population estimate provided in the Annual Population Survey.
PVI
PVI is a frequently used acronym for the Private, Voluntary and/or Independent sector. Many early years settings are classified as PVIs.
Public sector
The part of an economy that is controlled or partly controlled by the state.
Private sector
The part of an economy that is not under direct state control.
National Minimum Wage
The National Minimum Wage is the minimum pay per hour almost all workers are entitled to. The National Living Wage is higher than the National Minimum Wage – workers get it if they are over 25.
30 hours
30 hours of free childcare (1,140 hours per year, which parents can choose how they take) for working parents with children aged three to four years.
Children with complex needs
This includes those with English as an additional language, special educational needs, or mental health issues and those living in poverty.
Ofsted
Ofsted is the Office for Standards in Education, Children’s Services and Skills. It inspects services that provide education and skills for learners of all ages. It also inspects and regulates services that care for children and young people.
Teaching assistant
A person who is employed to help a teacher in a classroom, for example giving help to children who need extra support.
Apprenticeships
A work-based training system, where apprentices earn a qualification after completing a blended mix of study and work. Apprentices must complete 20% of their training off the job, be paid the Apprenticeship Minimum Wage (£3.70/hr for those aged 19 and over) and pass an end point assessment.
National Vocational Qualification (NVQ)
The NVQ is a work-based qualification which recognises the skills and knowledge a person needs to do a job. The candidate needs to demonstrate and prove their competency in their chosen role or
career path.
Level 4 and 5 qualifications
These include numerous higher-level technical qualifications as well as qualifications that help students bridge into higher education, such as certificates or diplomas of higher education.
Local authority training
Continuous professional development training provided by the local authority.
Special Educational Needs Co-ordinator (SENCO)
A SENCO is a teacher who co-ordinates the provision in schools for children with special educational needs or disabilities.
Not-for-profit settings
Not-for-profit settings are types of settings that do not earn profits for their owners.
Level 6
Qualifications at this level can include bachelor’s degrees, some technical qualifications and apprenticeships. They are usually completed after mandatory schooling.
8.4 Methodology
Systematic analysis
A research method used to answer a defined research question by collecting and summarising all empirical evidence that fits pre-specified eligibility criteria.
Annual Population Survey (APS)
A combined survey of households in Great Britain. Its purpose is to provide information on key social and socio-economic variables between the 10-yearly censuses, with particular emphasis on providing information relating to sub-regional (local authority) areas.
Labour Force Survey (LFS)
The LFS is a study of the employment circumstances of the UK population. It is the largest household study in the UK and provides the official measures of employment and unemployment.
Descriptive statistics
Descriptive statistics are brief descriptive coefficients that summarise a given dataset, which can be either a representation of the entire population or a sample of a population.
Cross-tabulation
Cross-tabulation is a method to quantitatively analyse the relationship between multiple variables.
Income Deprivation Affecting Children Index
The English indices of deprivation measure relative deprivation in small areas in England called lower-layer super output areas. The index of multiple deprivation is the most widely used of these indices.
-
Siraj-Blatchford, I., Mayo, A., Melhuish, E., Taggart, B., Sammons, P. and Sylva, K. (2011), Performing against the odds: developmental trajectories of children in the EPPSE 3 to 16 study, London: Department for Education; Sylva, K., Melhuish, E., Sammons, P., Siraj-Blatchford, I. and Taggart, B. (2004), The Effective Provision of Pre-school Education (EPPE) Project: findings from pre-school to end of Key Stage1, Nottingham: DfES Publications. ↩
-
Bonetti, S. (2019), The early years workforce in England: A comparative analysis using the Labour Force Survey, London: Education Policy Institute. ↩
-
Melhuish, E. and Gardiner, J. (2018), Study of Early Education Development (SEED): study of quality of early provision in England (revised), Research Brief, London: Department for Education; Ceeda (2019), Early years workforce survey, Stockton on Tees: Ceeda Research Limited. ↩
-
Richards, L., Garratt, E., and Heath, A.F. with Anderson, L. and Altintaş, E. (2016), The childhood origins of social mobility: socio-economic inequalities and changing opportunities, London: Social Mobility Commission. ↩
-
Social Mobility Commission (2019), State of the nation 2018–19: social mobility in Great Britain, London: Social Mobility Commission. ↩
-
Bonetti, S. (2018), The early years workforce: a fragmented picture, London: Education Policy Institute. ↩
-
The strength of evidence is assessed using the following criteria: strong – the finding is consistent across all three strands; moderate – the finding is consistent across two strands and not contradicted by the third strand; weak – the finding is supported by one strand and not contradicted by other sources of evidence OR the finding is supported by two strands but contradicted by the third source of evidence; no evidence – the finding is inconsistent across all strands ↩
-
Melhuish, E. and Gardiner, J. (2018), Study of Early Education Development (SEED): study of quality of early provision in England (revised), Research Brief, London: Department for Education; Ceeda (2019), Early years workforce survey, Stockton on Tees: Ceeda Research Limited. ↩
-
Worth, J., Lynch, S., Hillary, J., Rennie, C., and Andrade, J. (2018), Teacher workforce dynamics in England, Slough: National Foundation for Educational Research, available at: https://www.nfer.ac.uk/media/3111/teacher_workforce_dynamics_in_england_final_report.pdf ↩
-
Out of the 15 elements that impact stability, which were identified through the conceptual framework, we examine in detail the five factors that appeared most frequently in the literature (see Annex 3 for a list and description of the 15 elements considered in this evidence review). Where appropriate, we discuss what the existing evidence tells us about how these factors vary by geographical region and by type of EY provider. ↩
-
Totenhagen, C.J., Hawkins, S.A., Casper, D.M., Bosch, L.A., Hawkey, K.R. and Borden, L.M. (2016), Retaining early childhood education workers: a review of the empirical literature, Journal of Research in Childhood Education, 30(4), 585–599. ↩
-
Totenhagen, C.J., Hawkins, S.A., Casper, D.M., Bosch, L.A., Hawkey, K.R. and Borden, L.M. (2016), Retaining early childhood education workers: a review of the empirical literature, Journal of Research in Childhood Education, 30(4), 585–599; Whitebook, M. and Sakai, L. (2003), Turnover begets turnover: an examination of job and occupational instability among child care center staff, Early Childhood Research Quarterly, 18(3), 273–293; Bird, P.P. (2012), Establishing a positive emotional climate in an early years setting, PhD thesis, University of Worcester, available at: http://eprints.worc.ac.uk/2338/1/PP%20Byrd%20PhD%20Thesis%202012%20-%20Establishing%20a%20Positive%20Emotio%20%281%29.pdf;Ceeda (2018), Early years sector skills survey, Stockton on Tees: Ceeda Research Limited. ↩
-
Manlove, E.E. and Guzell, J.R. (1997), Intention to leave, anticipated reasons for leaving, and 12-month turnover of child care center staff, Early Childhood Research Quarterly, 12(2), 145–167. ↩
-
Kalitowski, S. (2018), Building blocks 2018: focus on the workforce, London: PACEY; NDNA (2019), NDNA 2018/19 workforce survey, England, London: National Day Nurseries Association. ↩
-
Kalitowski, S. (2018), Building blocks 2018: focus on the workforce, London: PACEY. ↩
-
Bird, P.P. (2012), Establishing a positive emotional climate in an early years setting, PhD thesis, University of Worcester, available at: http://eprints.worc.ac.uk/2338/1/PP%20Byrd%20PhD%20Thesis%202012%20-%20Establishing%20a%20Positive%20Emotio%20%281%29.pdf; Crellin, N. (2017), An exploration into early years practitioners’ work experiences in private day nurseries and voluntary sector pre-schools in England, PhD thesis, University of Southampton; McDonald, P., Thorpe, K. and Irvine, S. (2018), Low pay but still we stay: retention in early childhood education and care, Journal of Industrial Relations, 60(5), 647–668; Rolfe, H. (2005), Building a stable workforce: recruitment and retention in the child care and early years sector, Children & Society, 19(1), 54–65; Simms, M.G. (2010), Retention of early years practitioners in day nurseries, PhD thesis, Nottingham Trent University, available at: http://irep.ntu.ac.uk/id/eprint/209 ↩
-
Crellin, N. (2017), An exploration into early years practitioners’ work experiences in private day nurseries and voluntary sector pre-schools in England, PhD thesis, University of Southampton. ↩
-
Rolfe, H. (2005), Building a stable workforce: recruitment and retention in the child care and early years sector, Children & Society, 19(1), 54–65; Simms, M.G. (2010), Retention of early years practitioners in day nurseries, PhD thesis, Nottingham Trent University, available at: http://irep.ntu.ac.uk/id/eprint/209 ↩
-
Allen, L., and Kelly, B.B. (2015), Status and well-being of the workforce, in: National Research Council (ed.), Transforming the workforce for children birth through age 8: a unifying foundation, Washington, DC: The National Academies Press, pp. 461–481. ↩
-
Carroll, M., Smith, M., Oliver, G. and Sung, S. (2009), Recruitment and retention in front‐line services: the case of childcare, Human Resource Management Journal, 19(1), 59–74. ↩
-
Osgood, J. Elwick, A., Robertson, L., Sakr, M. and Wilson, D. (2017), Early years teacher and early years educator: a scoping study of the impact, experiences and associated issues of recent early years qualifications and training in England, project report, London: TACYC, available at: http://eprints.mdx.ac.uk/22867; Cassidy, D.J., Lower, J.K., Kintner-Duffy, V.L., Hegde, A.V. and Shim, J. (2011), The day-to-day reality of teacher turnover in preschool classrooms: an analysis of classroom context and teacher, director, and parent perspectives, Journal of Research in Childhood Education, 25(1), 1–23. ↩
-
Ceeda (2018), Early years sector skills survey, Stockton on Tees: Ceeda Research Limited; Crellin, N. (2017), An exploration into early years practitioners’ work experiences in private day nurseries and voluntary sector pre-schools in England, PhD thesis, University of Southampton; Jovanovic, J. (2013), Retaining early childcare educators, Gender, Work & Organization, 20(5), 528–544; Kalitowski, S., (2018), Building blocks 2018: focus on the workforce, London: PACEY; McDonald, P., Thorpe, K. and Irvine, S. (2018), Low pay but still we stay: retention in early childhood education and care, Journal of Industrial Relations, 60(5), 647–668; NDNA (2019), NDNA 2018/19 workforce survey, England, London: National Day Nurseries Association; Rolfe, H. (2005), Building a stable workforce: recruitment and retention in the child care and early years sector, Children & Society, 19(1), 54–65; Simms, M.G. (2010), Retention of early years practitioners in day nurseries, PhD thesis, Nottingham Trent University, available at: http://irep.ntu.ac.uk/id/eprint/209 ↩
-
NDNA (2019), NDNA 2018/19 workforce survey, England, London: National Day Nurseries Association. ↩
-
Preschool Learning Alliance (2018), Minds matter: the impact of working in the early years sector on practitioners’ mental health and wellbeing, London: PLA. ↩
-
Crellin, N. (2017), An exploration into early years practitioners’ work experiences in private day nurseries and voluntary sector pre-schools in England, PhD thesis, University of Southampton. ↩
-
Rolfe, H. (2005), Building a stable workforce: recruitment and retention in the child care and early years sector, Children & Society, 19(1), 54–65. ↩
-
Ceeda (2018), Early years sector skills survey, Stockton on Tees: Ceeda Research Limited; McDonald, P., Thorpe, K. and Irvine, S. (2018), Low pay but still we stay: retention in early childhood education and care, Journal of Industrial Relations, 60(5), 647–668; NDNA (2019), NDNA 2018/19 workforce survey, England, London: National Day Nurseries Association. ↩
-
Jovanovic, J. (2013), Retaining early childcare educators, Gender, Work & Organization, 20(5), 528–544; Rolfe, H. (2005), Building a stable workforce: recruitment and retention in the child care and early years sector, Children & Society, 19(1), 54–65; Simms, M.G. (2010), Retention of early years practitioners in day nurseries, PhD thesis, Nottingham Trent University, available at: http://irep.ntu.ac.uk/id/eprint/209 ↩
-
Crellin, N. (2017), An exploration into early years practitioners’ work experiences in private day nurseries and voluntary sector pre-schools in England, PhD thesis, University of Southampton; Simms, M.G. (2010), Retention of early years practitioners in day nurseries, PhD thesis, Nottingham Trent University, available at: http://irep.ntu.ac.uk/id/eprint/209 ↩
-
Jovanovic, J. (2013), Retaining early childcare educators, Gender, Work & Organization, 20(5), 528–544; Simms, M.G. (2010), Retention of early years practitioners in day nurseries, PhD thesis, Nottingham Trent University, available at: http://irep.ntu.ac.uk/id/eprint/209 ↩
-
McDonald, P., Thorpe, K. and Irvine, S. (2018), Low pay but still we stay: retention in early childhood education and care, Journal of Industrial Relations, 60(5), 647–668. ↩
-
Cassidy, D.J., Lower, J.K., Kintner-Duffy, V.L., Hegde, A.V. and Shim, J. (2011), The day-to-day reality of teacher turnover in preschool classrooms: an analysis of classroom context and teacher, director, and parent perspectives, Journal of Research in Childhood Education, 25(1), 1–23 ↩
-
Jovanovic, J (2013), Retaining early childcare educators, Gender, Work & Organization, 20(5), 528–544. ↩
-
Simms, M.G. (2010), Retention of early years practitioners in day nurseries, PhD thesis, Nottingham Trent University, available at: http://irep.ntu.ac.uk/id/eprint/209 ↩
-
Carroll, M, Smith, M, Oliver, G and Sung, S (2009), Recruitment and retention in front‐line services: the case of childcare, Human Resource Management Journal, 19(1), 59-74. ↩
-
Preston, D. (2013), Being a manager in the English early years sector, European Early Childhood Education Research Journal, 21(3), 326–338. ↩
-
Jovanovic, J. (2013), Retaining early childcare educators, Gender, Work & Organization, 20(5), 528–544. ↩
-
Crellin, N. (2017), An exploration into early years practitioners’ work experiences in private day nurseries and voluntary sector pre-schools in England, PhD thesis, University of Southampton. ↩
-
Jeon, L. and Wells, M.B. (2018), An organizational-level analysis of early childhood teachers’ job attitudes: workplace satisfaction affects early head start and head start teacher turnover, Child & Youth Care Forum, 47(4), 563–581; Manlove, E.E. and Guzell, J.R. (1997), Intention to leave, anticipated reasons for leaving, and 12-month turnover of child care center staff, Early Childhood Research Quarterly, 12(2), 145–167; Totenhagen, C.J., Hawkins, S.A., Casper, D.M., Bosch, L.A., Hawkey, K.R. and Borden, L.M. (2016), Retaining early childhood education workers: a review of the empirical literature, Journal of Research in Childhood Education, 30(4), 585–599; Whitebook, M and Sakai, L, (2003), Turnover begets turnover: an examination of job and occupational instability among child care center staff, Early Childhood Research Quarterly, 18(3), 273–293. ↩
-
NDNA (2019), NDNA 2018/19 workforce survey, England, London: National Day Nurseries Association. ↩
-
Crellin, N. (2017), An exploration into early years practitioners’ work experiences in private day nurseries and voluntary sector pre-schools in England, PhD thesis, University of Southampton. ↩
-
Ceeda (2018), Early years sector skills survey, Stockton on Tees: Ceeda Research Limited; Carroll, M., Smith, M., Oliver, G. and Sung, S. (2009), Recruitment and retention in front‐line services: the case of childcare, Human Resource Management Journal, 19(1), 59–74. ↩
-
Jovanovic, J. (2013), Retaining early childcare educators, Gender, Work & Organization, 20(5), 528–544; Osgood, J. Elwick, A., Robertson, L., Sakr, M. and Wilson, D. (2017), Early years teacher and early years educator: a scoping study of the impact, experiences and associated issues of recent early years qualifications and training in England, project report, London: TACYC, available at: http://eprints.mdx.ac.uk/22867 ↩
-
Crellin, N. (2017), An exploration into early years practitioners’ work experiences in private day nurseries and voluntary sector pre-schools in England, PhD thesis, University of Southampton; Osgood, J., Elwick, A., Robertson, L., Sakr, M. and Wilson, D. (2017), Early years teacher and early years educator: a scoping study of the impact, experiences and associated issues of recent early years qualifications and training in England, project report, London: TACYC, available at: http://eprints.mdx.ac.uk/22867; Preston, D. (2013), Being a manager in the English early years sector, European Early Childhood Education Research Journal, 21(3), 326–338; Rolfe, H. (2005), Building a stable workforce: recruitment and retention in the child care and early years sector, Children & Society, 19(1), 54–65; Simms, M.G. (2010), Retention of early years practitioners in day nurseries, PhD thesis, Nottingham Trent University, available at: http://irep.ntu.ac.uk/id/eprint/209 ↩
-
Rolfe, H. (2005), Building a stable workforce: recruitment and retention in the child care and early years sector, Children & Society, 19(1), 54–65. ↩
-
Bridges, M., Fuller, B., Huang, D.S. and Hamre, B.K. (2011), Strengthening the early childhood workforce: how wage incentives may boost training and job stability, Early Education & Development, 22(6), 1009–1029. ↩
-
Preston, D. (2013), Being a manager in the English early years sector, European Early Childhood Education Research Journal, 21(3), 326–338; Simms, M.G. (2010), Retention of early years practitioners in day nurseries, PhD thesis, Nottingham Trent University, available at: http://irep.ntu.ac.uk/id/eprint/209 ↩
-
Crellin, N. (2017), An exploration into early years practitioners’ work experiences in private day nurseries and voluntary sector pre-schools in England, PhD thesis, University of Southampton. ↩
-
Preschool Learning Alliance (2018), Minds matter: the impact of working in the early years sector on practitioners’ mental health and wellbeing, London: PLA. ↩
-
Osgood, J., Elwick, A., Robertson, L., Sakr, M. and Wilson, D. (2017), Early years teacher and early years educator: a scoping study of the impact, experiences and associated issues of recent early years qualifications and training in England, project report, London: TACYC, available at: http://eprints.mdx.ac.uk/22867 ↩
-
NDNA (2019), NDNA 2018/19 workforce survey, England, London: National Day Nurseries Association. ↩
-
Rolfe, H. (2005), Building a stable workforce: recruitment and retention in the child care and early years sector, Children & Society, 19(1), 54–65. ↩
-
Simms, M.G. (2010), Retention of early years practitioners in day nurseries, PhD thesis, Nottingham Trent University, available at: http://irep.ntu.ac.uk/id/eprint/209 ↩
-
Simms, M.G. (2010), Retention of early years practitioners in day nurseries, PhD thesis, Nottingham Trent University, available at: http://irep.ntu.ac.uk/id/eprint/209 ↩
-
Totenhagen, C.J., Hawkins, S.A., Casper, D.M., Bosch, L.A., Hawkey, K.R. and Borden, L.M. (2016), Retaining early childhood education workers: a review of the empirical literature, Journal of Research in Childhood Education, 30(4), 585–599. ↩
-
McDonald, P., Thorpe, K. and Irvine, S. (2018), Low pay but still we stay: retention in early childhood education and care, Journal of Industrial Relations, 60(5), 647–668. ↩
-
McDonald, P., Thorpe, K. and Irvine, S. (2018), Low pay but still we stay: retention in early childhood education and care, Journal of Industrial Relations, 60(5), 647–668. Simms, M.G. (2010), Retention of early years practitioners in day nurseries, PhD thesis, Nottingham Trent University, available at: http://irep.ntu.ac.uk/id/eprint/209 ↩
-
Bird, P.P. (2012), Establishing a positive emotional climate in an early years setting, PhD thesis, University of Worcester, available at: http://eprints.worc.ac.uk/2338/1/PP%20Byrd%20PhD%20Thesis%202012%20-%20Establishing%20a%20Positive%20Emotio%20%281%29.pdf ↩
-
Jeon, L. and Wells, M.B. (2018), An organizational-level analysis of early childhood teachers’ job attitudes: workplace satisfaction affects early head start and head start teacher turnover, Child & Youth Care Forum, 47(4), 563–581, found measures of job satisfaction to be related predictive of whether individuals left settings, while Manlove, E.E. and Guzell, J.R. (1997), Intention to leave, anticipated reasons for leaving, and 12-month turnover of child care center staff, Early Childhood Research Quarterly, 12(2), 145–167, found the opposite. ↩
-
Crellin, N. (2017), An exploration into early years practitioners’ work experiences in private day nurseries and voluntary sector pre-schools in England, PhD thesis, University of Southampton. ↩
-
Cassidy, D.J., Lower, J.K., Kintner-Duffy, V.L., Hegde, A.V. and Shim, J. (2011), The day-to-day reality of teacher turnover in preschool classrooms: an analysis of classroom context and teacher, director, and parent perspectives, Journal of Research in Childhood Education, 25(1), 1–23. ↩
-
Whitebook, M. and Sakai, L. (2003), Turnover begets turnover: an examination of job and occupational instability among child care center staff, Early Childhood Research Quarterly, 18(3), 273–293. ↩
-
In the APS, the public sector can be considered an approximation of maintained and school-based nurseries, while the private sector includes PVIs and childminders. ↩
-
Totenhagen, C.J., Hawkins, S.A., Casper, D.M., Bosch, L.A., Hawkey, K.R. and Borden, L.M. (2016), Retaining early childhood education workers: a review of the empirical literature, Journal of Research in Childhood Education, 30(4), 585–599. ↩
-
Akhal, A. (2019), The early years workforce: a comparison with retail workers, London: Education Policy Institute; Bonetti, S. (2019), The early years workforce in England: a comparative analysis using the Labour Force Survey, London: Education Policy Institute. ↩
-
It is not possible to further disaggregate data for ‘degree’ from ‘higher education’. Examples of higher education qualifications are: NVQ Level 4, diploma in higher education, teaching (further, secondary and primary education) and nursing. A complete list can be found in the user guidance section of Office for National Statistics (2017), Graduates in the UK labour market: 2017, available at: http://dera.ioe.ac.uk/30577/1/Graduates%20in%20the%20UK%20labour%20market%202017.pdf ↩
-
Bridges, M., Fuller, B., Huang, D.S. and Hamre, B.K. (2011), Strengthening the early childhood workforce: how wage incentives may boost training and job stability, Early Education & Development, 22(6), 1009–1029. ↩
-
Rolfe, H. (2005), Building a stable workforce: recruitment and retention in the child care and early years sector, Children & Society, 19(1), 54–65. ↩
-
The APS data allows us to examine some indirect measures through questions about personal wellbeing, such as workers’ self-reported levels of happiness, self-worth, life satisfaction and anxiety levels. Survey respondents were asked to rate their answers on a scale from 0 (not at all) to 10 (completely). Questions are phrased as follows: “Overall, how satisfied are you with your life nowadays?”; “Overall, to what extent do you feel that the things you do in your life are worthwhile?”; “How happy did you feel yesterday?”; “How anxious did you feel yesterday?”. ↩
-
We are grateful to the Professional Association for Childcare and Early Years (PACEY) for its help with Melanie’s story. PACEY is a charity providing training, expert advice, help and peer support to early years practitioners working throughout England and Wales. Find out more at: https://www.pacey.org.uk/ ↩
-
Children’s Commissioner (2020), Best beginnings in the early years: a proposal for a new early years guarantee to give all children in England the best start in life, London: Children’s Commissioner for England, available at: https://www.childrenscommissioner.gov.uk/wp-content/uploads/2020/07/cco-best-beginnings-in-the-early- years.pdf. ↩