SPI-M-O: Summary of modelling considerations for the reimposition of measures, 13 October 2021
Updated 13 May 2022
1. Given the coming uncertainty over autumn and winter, it is possible that government may choose to reimplement measures to curb increasing rates of hospital admissions. The government’s COVID-19 autumn and winter plan [footnote 1], outlined contingency measures (Plan B) that might be enacted should data suggest further intervention is needed to protect the NHS. SAGE are separately considering what the impact of these Plan B measures might be. It is possible, however, that action beyond Plan B may be required to control growth. SAGE have been asked to consider the potential effect of returning to the steps outlined in February 2021’s Roadmap [footnote 2].
2. As SPI-M-O has discussed previously, the earlier that measures are enacted, the less likely that more stringent ones would be needed and the faster they would likely be able to be lifted. Similarly, the higher the prevalence and growth rates when measures were introduced, the more rapidly hospital pressures would need to be reduced, and therefore the stricter the measures that would be needed to do so.
3. If steps of the Roadmap were to be reintroduced, their effects on reducing transmission would not be the same as when they were originally implemented. Reasons for this include, but are not limited to:
- behaviour is likely to be different from what it was when the measures were originally put in place, but the impact of any differences on effectiveness is unknown;
- testing and isolation rules have been relaxed since the end of the Roadmap;
- one-time effects that previously reduced or increased transmission could not be repeated, such as the Euro 2020 football championship and the isolation of a large proportion of the active population during the so-called ‘pingdemic’;
- the demographic profiles of those who would be susceptible in such a scenario would be different from when the measures were originally in place; and
- the Delta variant became dominant during the course of the Roadmap.
Nevertheless, it is possible to draw some conclusions from retrospective analysis of the Roadmap.
4. The higher the growth rate at the time that contingency measures were put in place, the greater the transmission reduction that would be needed to reduce R below one. As an illustration, if R were 1.5, a reduction in transmission of over 33% would be needed; but if R were 1.2, transmission would only need to be reduced by 0.2 divided by 1.2 equating to 17%.
5. 2 modelling groups, Warwick and Imperial, have estimated the extent of transmission during different steps of the Roadmap. These estimates can be used as a starting point to consider the extent by which reimposed measures could slow or reverse epidemic growth. SPI-M-O does not attempt to say what combination of conditions (prevalence, speed of growth, amongst other factors) would require reimposition of measures, but instead estimate the strength of intervention required to stop growth.
6. Imperial estimated how the reproduction number excluding any immunity from vaccination or past infection (Rexcl_immunity) changed at each step of the Roadmap over time, and the relative change in rate of contacts, once the emergence of the Delta variant is accounted for (beta). They estimate that beta increased by only around 10% between Steps 1A and 1B of the Roadmap, then remained almost unchanged at Step 2. There were further increases of around 15% between Steps 2 and 3, and another 5% between Step 3 and Step 4 to date [footnote 3]. This implies that a return to Step 3 behaviours would result in only a modest reduction in transmission from its current levels [footnote 4]; but a return to Step 2 behaviours would make a much bigger difference. As noted above, however, these calculations do not account for factors such as the Euro 2020 football championship and the pingdemic that could not be repeated.
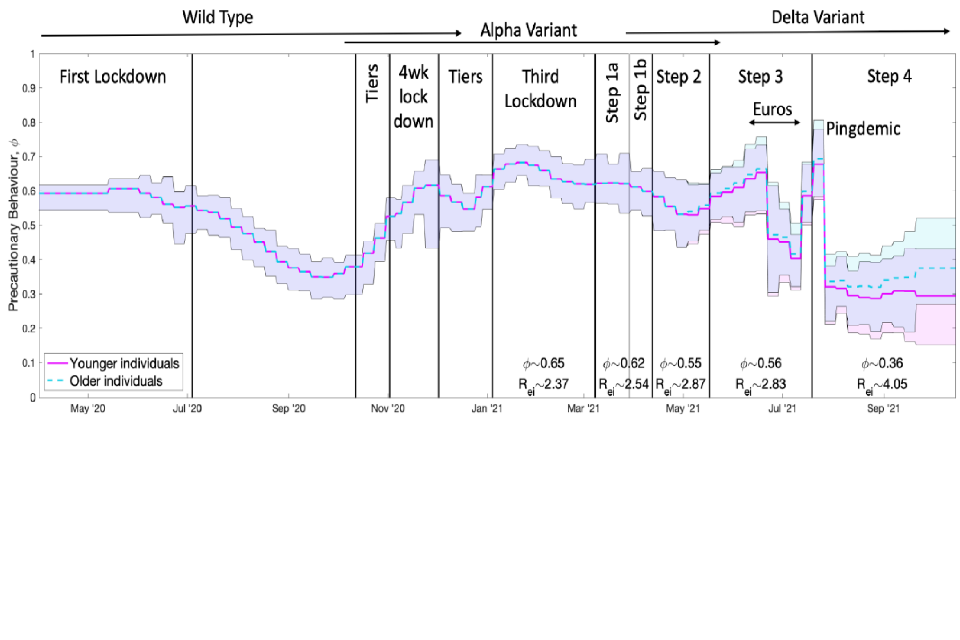
7. Warwick has also considered the generic principles of what scale of intervention might be required to halt growth using their metric of precautionary behaviour (phi). phi describes the proportion by which transmission is reduced compared to pre-pandemic behaviour, so phi equalling 0 is equivalent to pre-pandemic behaviours and phi equalling one corresponds to highly restrictive lockdown controls. Figure 1 shows the estimate of this metric changing over time since the start of the epidemic.
Figure 1: Inferred precautionary behaviour (phi) over time including the various periods of measures implemented and different predominant variants in circulation. Solid lines show the mean values and the shaded areas cover the 95% credible intervals (over 3 assumptions for the extent of waning vaccine effectiveness); mean phi and Rexcl_immunity values for the Delta variant are included below the plot. The pink solid line shows the inferred values for younger individuals aged under 40 while the dashed blue line shows the inferred values for the older population (over 60) with these 2 assumed to be equal before May 2021. Ages between 40 and 60 take values between the 2 inferred levels, increasing with age. phi values are assumed to vary slowly (with exceptions such as during the Euro 2020 football matches and ‘pingdemic’) and remain constant over a week.

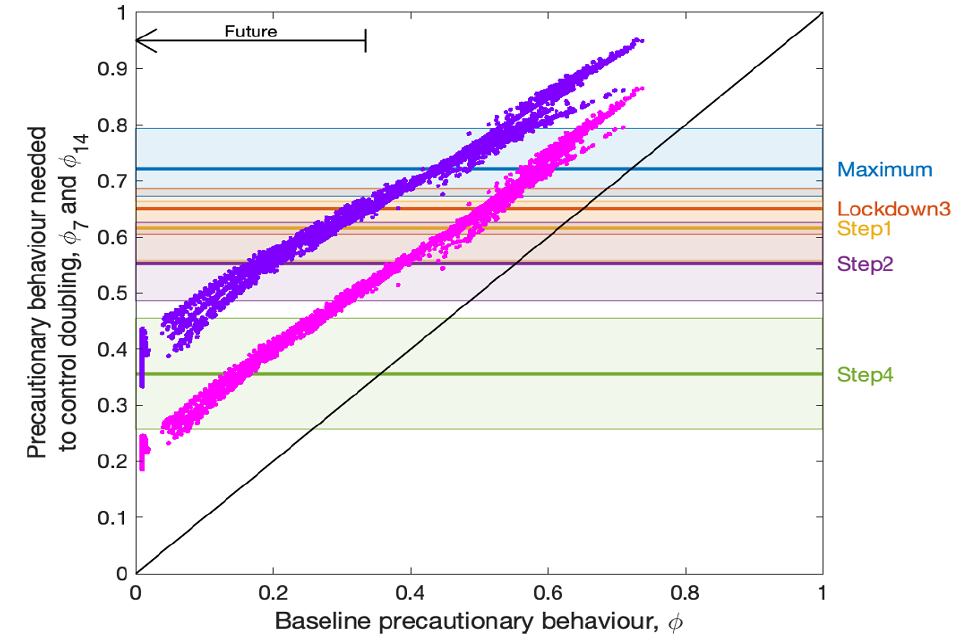
8. Figure 2 considers the required precautionary behaviour (phi on y axis) to flatten growth for a given pre-intervention behaviour (phi on x axis) in an epidemic that is either doubling every fortnight (pink dots) or every week (purple dots). For example, if pre-intervention phi (x axis) were 0.4 with the epidemic doubling approximately every fortnight, required phi (y axis) would need to move to 0.55 or around the level of behaviour during Step 2 of the Roadmap to stop growth; to reverse growth would require phi greater than 0.55.
9. It is likely that baseline phi will be below its current value in the future unless precautionary behaviour reduces transmission before any measures are reimposed. If this were the case, relatively light additional measures would be sufficient to successfully arrest growth. For example, if pre-intervention phi (x axis) were 0.15 with the epidemic doubling approximately every 2 weeks, required phi (y axis) would only need to move to around Step 4 of the Roadmap behaviour to stop growth. This is consistent with work from LSHTM, which suggest relatively mild measures can now make a big difference to transmission.
10. Even if doubling times were as short as 2 weeks, ‘plan B’ measures should make a big difference if put in place quickly; if not, further measures would likely not need to be as strict as last winter’s measures to be sufficient to curb growth.
Figure 2: The necessary change in precautionary behaviour (y axis) to overcome a doubling of infection every week (purple dots; top diagonal) or every fortnight (pink dots; middle diagonal), as a function of precautionary behaviour at the time the doubling starts (x axis). These results combine 3 assumptions about the extent of waning of vaccine effectiveness, and two assumptions around the decline in precautionary behaviour (declining to zero by December 2021 or June 2022). The arrow in the top left indicates the expected move of current behaviour levels from approximately phi = 0.36 now to lower levels of precautionary behaviour. Horizontal lines include 95% credible intervals that correspond to values inferred from 2021 observations.

1. Footnotes
-
COVID-19 Response: Autumn and Winter Plan 2021; 14 September 2021. ↩
-
COVID-19 Response - Spring 2021 (Summary); 22 February 2021. ↩
-
Note that Imperial did not distinguish between periods in Step 4 with schools closed and open when estimating this. ↩
-
Step 4 behaviours, as estimated up to the end of September 2021. ↩
