SPI-M-O: Consensus statement on COVID-19, 22 December 2021
Updated 11 February 2022

© Crown copyright 2022
This publication is licensed under the terms of the Open Government Licence v3.0 except where otherwise stated. To view this licence, visit nationalarchives.gov.uk/doc/open-government-licence/version/3 or write to the Information Policy Team, The National Archives, Kew, London TW9 4DU, or email: psi@nationalarchives.gov.uk.
Where we have identified any third party copyright information you will need to obtain permission from the copyright holders concerned.
This publication is available at https://www.gov.uk/government/publications/spi-m-o-consensus-statement-on-covid-19-22-december-2021/spi-m-o-consensus-statement-on-covid-19-22-december-2021
All probability statements are in line with the framework given in Annex 2.
Severity of Omicron
1. SPI-M-O have seen early estimates of risk of hospitalisation of the Omicron variant from South Africa [footnote 1], Scotland [footnote 2] and England. [footnote 3] The interplay between age, vaccine status, infection history and variants (as well as the small numbers of hospitalised cases in older people so far), in a rapidly changing and heavily lagged system makes it extremely difficult to produce precise, robust estimates of Omicron’s severity at this point. In particular, estimates are sensitive to the methodology used to adjust for reinfections, many of which will not have been detected by a positive test.
2. Based on the evidence currently available, it is likely that the intrinsic hospitalisation rate of Omicron is lower than that of Delta. [footnote 4] It is also highly likely that reinfections are less severe than first infections, therefore the realised hospitalisation rate is almost certainly lower than it would have been in an entirely susceptible population. The realised hospitalisation rate in the UK population is also highly dependent on the age profile of those infected. Everything else being equal, lower vaccine effectiveness would mean a higher proportion of those infected are older; however, that will be counteracted to some extent by the fact that booster vaccine uptake is currently considerably higher in older people.
3. Whilst the estimates for the reduction in risk of hospital admission with Omicron currently range from 15% to 80% lower than with Delta, SPI-M-O has low confidence in any specific figure. At present there are few older people in the data used to estimate the severity of Omicron and relative severity may differ between age groups. A 20% reduction would result in four times as many hospitalisations as an 80% reduction and would therefore require a very different policy response to achieve the same outcome.
Sensitivity of modelling of future scenarios
4. SPI-M-O have considered the implications of and explanations for the apparent slowing in the growth rate of Omicron cases in the last few days. There are several plausible explanations for this, which are not mutually exclusive and not possible to disentangle. These include:
- changes in behaviour reducing transmission in response to increased perception of risk and / or to avoid being in isolation over Christmas
- the impact of Plan B
- changes in test-seeking behaviour to avoid needing to isolate (which would be consistent with PCR positivity not showing signs of slowing)
- lower availability of tests and longer testing turnaround times
- reinfections, which are not currently included in the headline daily figures
- the continued rollout of booster vaccines
- the spread of Omicron from the highest growth age groups to the rest of the population
- a reduction in the number of susceptible people in some of the age groups and locations with extremely high prevalence
5. SPI-M-O therefore have low confidence in whether the underlying growth rate of Omicron has, in reality, significantly slowed.
6. Modelling results are highly sensitive to the growth rate they are fitted to and it is very difficult to fit models in a rapidly changing environment with many unknowns. Were growth to have permanently slowed, the epidemic would peak at a lower level than currently modelled; some of the factors in the previous paragraph, however, could reverse after Christmas, which would limit the scale of this reduction.
7. The generation time is the average time between someone becoming infected and that person infecting others. [footnote 5] Given the current growth rate, a shorter generation time would mean the reproduction number is smaller and that weaker measures or a smaller amount of behavioural change would be needed to curb the spread of the variant.
8. At present, SPI-M-O is not aware of any evidence that the generation time for Omicron is shorter than that of Delta. Were that to be the case, we would expect recent behavioural changes to have had a larger effect on growth rates, and that the epidemic peak would be lower than modelled. It would also result in measures having a greater effect on Omicron than Delta, slowing the rate at which the former becomes dominant. Careful epidemiological studies are needed to estimate Omicron’s generation time. Other factors that can result in epidemics peaking at a lower level than implied by models include network effects resulting in differences in behaviour, and local epidemics peaking at slightly different times, spreading out the national epidemic.
9. SPI-M-O’s modelling has focussed on hospital admissions rather than occupancy. This is because the average length of stay of patients hospitalised for Omicron in the UK is not yet known. While early data from South Africa are consistent with Omicron having a shorter length of stay than Delta, such data are hard to map directly to the UK and require sufficient time to have passed to ensure estimates are not biased because of patients with milder infections leaving hospital more quickly than those with more severe infections. The average length of stay in the UK may also be different to that in other countries as a result of different patterns of population immunity, age profiles and treatment paths.
10. If the average length of stay with Omicron were to be, for example, half as long as with Delta on average, then for a given level of hospital admissions, occupancy would be approximately halved.
Modelling update
11. University of Warwick have updated their previous modelling to consider the return to Step 2 of the February 2021 Roadmap [footnote 6] from either 28 December or 1 January, which is then lifted on 15 January, 28 January or 28 March. As a proxy for non-mandated behaviour change, they have also included a scenario where from 28 December, mixing reduces by half the amount it does under the imposition of Step 2. This is illustrative only – SPI-M-O cannot predict how behaviour will change in future in the absence or presence of interventions. Measures change on the given end date, but it is assumed that, as with previous policy changes, behaviour only gradually returns to Plan B levels over the course of four weeks. Modelling assumptions used are the same as in the paper presented to SAGE 100 and are described in detail in the SPI-M-O consensus from that meeting. [footnote 7]
12. Warwick’s model is of hospital admissions for COVID-19, not admissions of people for other reasons who also test positive. It is currently fitted to the number of cases with S-gene target failure (namely cases that are almost certainly Omicron), not to the number of Omicron hospital admissions. This means that Warwick modelling results are not sensitive to hospital admissions data that includes people admitted to hospital for other reasons who happen to be Omicron-positive.
13. A reduction in mixing equivalent to half that of Step 2 results in only a very small reduction in severe outcomes compared to Plan B alone. Step 2 has a much larger effect, reducing the number of deaths up to 31 May by 39% (24% to 54%) if kept in place from 28 December until 28 March, and 18% (12% to 27%) if kept in place until 15 January. The reduction in admissions and deaths was smaller when modelled as starting on 1 January, but there was consensus on SPI-M-O that models do not have sufficient precision to capture the effect of such small differences to policies. However, as previously stated, [footnote 8] when an epidemic is rapidly growing, the earlier interventions take place, the larger their effect.
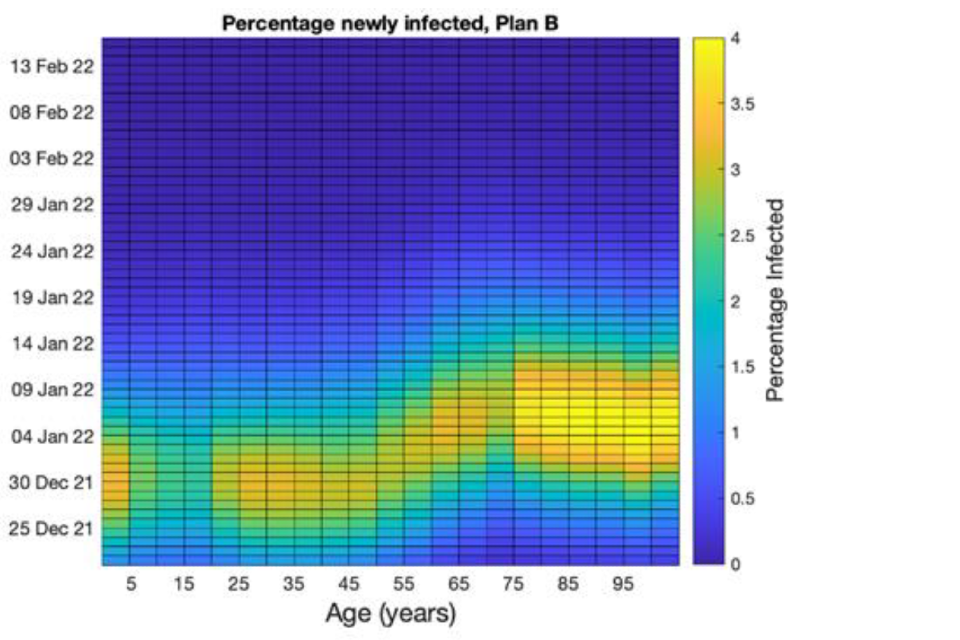
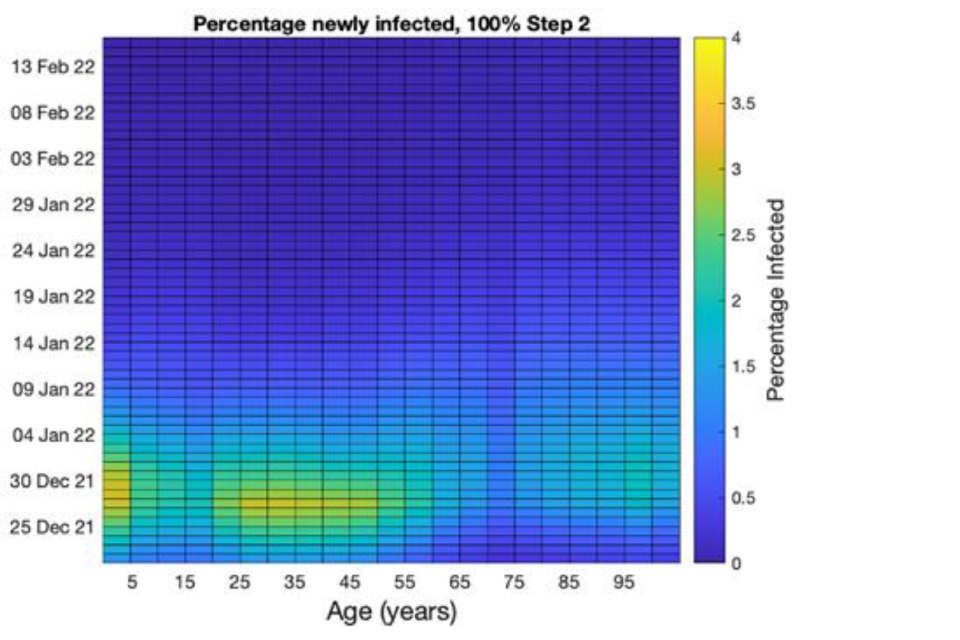
14. Previous waves of the pandemic have started in younger age groups before spreading to older people. The Omicron wave has also started in younger people. Figure 1 illustrates a modelled description of how infections travel across age groups (horizontal axis) over time (vertical axis). The left-hand plot assumes only Plan B is kept in place, and shows infections moving from younger people to older people. The right-hand plot assumes that Step 2 measures are brought in from 28 December for 1 month. In this scenario, the measures cause the epidemic to turn over more quickly, disproportionately reducing infections in older people. Because older people are more likely to be hospitalised by infection, this modelling implies that the reintroduction of measures would reduce the number of hospital admissions disproportionately more than the number of infections. Note that this does not explicitly model mixing during the Christmas holiday, and increased intergenerational mixing over those days could substantially alter this conclusion.
Figure 1: The proportion of the population newly infected in Warwick’s model with Plan B only (top) or Step 2 (bottom) in place from 28 December for 1 month.
Horizontal axes are the age groups, and the vertical axes shows time, going forwards from bottom to top. Colours indicate the proportion newly infected.
15. This work was completed before the newest data on Omicron’s severity was available. This means that, as previously, Warwick considered scenarios where Omicron’s intrinsic severity was 10%, 20%, 50% or 100% of that of Delta. Also, in line with previous work, Warwick assume that prior Delta infection yields 90% protection against Omicron infection and that reinfected individuals are 95% less likely to need hospitalisation.
16. In light of the emerging data on the severity of the Omicron variant, SPI-M-O now consider the 100% severity scenario to be highly unlikely. Under rapidly enacted Step 2 measures, peak hospital admissions in the 20% severity scenario are broadly similar to those seen in January 2021 (although as noted above, hospital occupancy would be proportionately lower were length of stay to be reduced compared to Delta, and both behaviour change and generation times could change the scale of the peak). Peak admissions scale with the risk of admission given infection, so are 2.5 times lower in the 20% severity scenario than the 50% scenario and would be 4 times higher were Omicron 80% as severe as Delta.
17. In all the scenarios modelled, rapidly enacted Step 2 measures reduce the peak of hospital pressure to about half its level under Plan B only. Behaviour change equivalent to half of Step 2 have a much smaller effect, in the order of 10% to 20%. It is important to remember that it is not just the maximum peak in hospital occupancy that affects the running of healthcare services, but the total time spent at elevated levels. More stringent measures would decrease the number of days when many people are in hospital.
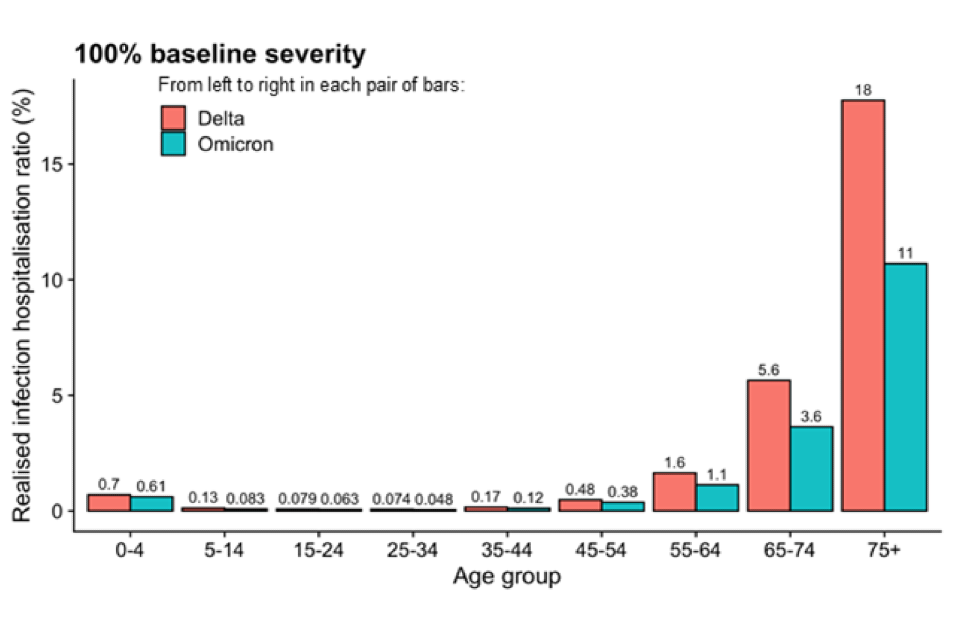
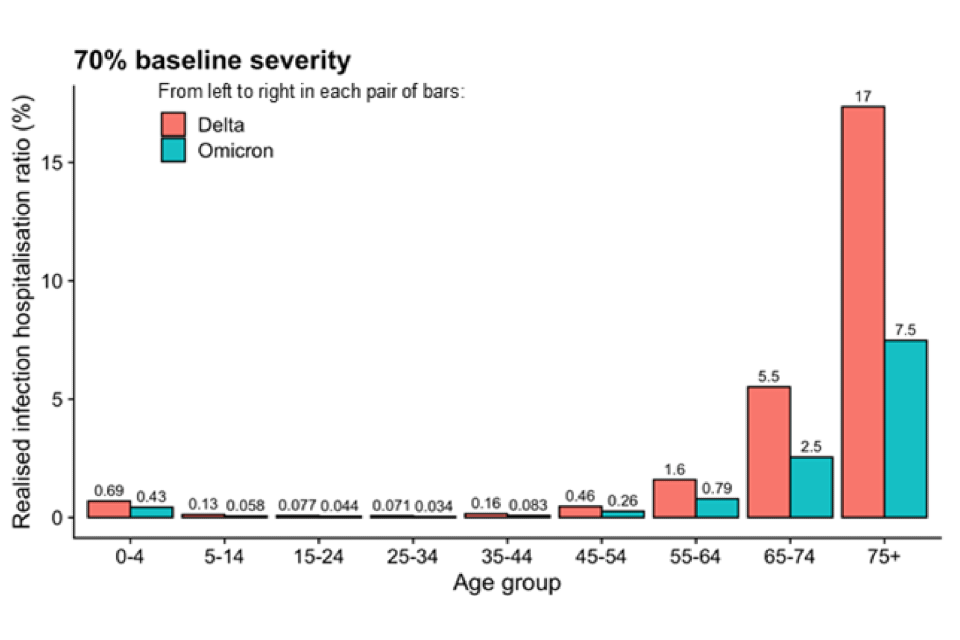
18. Additional modelling from LSHTM of interventions was completed after SPI-M-O met and was shared with SPI-M-O’s chairs and SAGE. The top panel of Figure 2 demonstrates that even in a scenario where the intrinsic severity of Omicron is the same as Delta, the age-specific realised severity is considerably lower because of its immune escape property. The population level realised severity also depends on the age profile of those infected. Whilst a reduction in Omicron’s intrinsic severity of 30% (lower panel) further reduces the realised severity, this makes less of a difference than immune escape.
Figure 2: The age-specific ratio of hospitalisations to infections in the LSHTM model where Delta (red) is as severe (top) or 70% as severe (bottom) as Omicron (blue). Snapshot of infections, and infections that will later go on to become hospitalisations on 1 December (Delta) and 5 January (Omicron).
19. Hospital admissions in LSHTM’s model peak at lower levels than in Warwick, in the order of 3,000 to 6,000 per day. The imposition of measures on 28 December in this model comes too late to significantly reduce the number of admissions and deaths. This finding is very sensitive to the assumptions on current growth rate and the proportion of infections in older people on 28 December. If growth rates were slightly smaller, or fewer older people were infected at that point, then interventions would have a larger effect.
Annex 1: SPI-M-O Chairs statement on COVID-19 – the potential impact of segmentation and shielding
Date: 20 December 2021
1. Measures intended to significantly reduce the peak burden of hospital admissions would need to be targeted at a much larger number of people than those previously advised to shield. Only 13% of people admitted to hospital for COVID-19 in a large study between December 2020 and July 2021 were immunosuppressed. [footnote 9] In terms of age-related vulnerability, 42% of all COVID-19 hospital admissions in England have been in the under 65s. [footnote 10]
2. The Social Care Working Group Chair has advised that, in spite of shielding, excess deaths in social care settings in the first COVID-19 wave (spring 2020) were high. [footnote 11] Between wave 2 (winter 2020 till early 2021) and wave 3 (summer 2021), vaccines reduced the number of outbreaks in care homes by 75% and the number of cases in those outbreaks by 50%.
3. The impact of shielding in previous waves is highly confounded as it is extremely difficult to separate this from other factors, such as the general effects of lockdown as well as individuals spontaneously changing their behaviour. The Department for Health and Social Care is confident that shielding has had a positive impact on protecting clinically extremely vulnerable (CEV) people but is unable to say whether shielding led to fewer deaths and less serious illness in CEV people than would otherwise have been the case, although it is likely to have helped. [footnote 12]
4. To achieve a meaningful reduction in hospitalisation and death in those who are clinically extremely vulnerable and older age groups, both transmission within and between households needs to be significantly reduced.
5. Any measures to protect the vulnerable using segmentation or shielding are expected to be less effective than they would have been against previous variants as a result of Omicron’s higher immune evasion and transmissibility.
6. Once 1 person in a household is infected, on average Omicron is passed on to more people than Delta would have been. [footnote 13] Extremely high community prevalence means the number of introductions of Omicron into a household will increase therefore increasing the likelihood that Omicron will infect someone within the household, even if transmission within the household is reduced. Protecting the vulnerable requires breaking of the national network of infection to prevent ingress into settings that house vulnerable individuals in the first place.
7. It is not possible to precisely model the impact of future segmentation or shielding strategies. That would depend on a wide range of unknown parameters including but not limited to the severity and immune evasion of Omicron; the other measures in place and their adherence; wider population behaviour change; and the adherence to and shielding or segmentation policies.
8. However, relatively simple models can provide useful principles relating to the effect of large proportions of the population being asked to reduce their contacts (‘segmentation’). As previously noted by SPI-M-O [footnote 14] [footnote 15], any successful intervention would need to apply to the whole household, not just the vulnerable individual to be successful. A policy of ‘shielding the shielders’ (interventions that do not just protect the vulnerable from Omicron but also those immediately around them) is expected to have the greatest impact, but would inevitably require a very large proportion of the population to change their behaviour significantly.
9. Preliminary work from the University of Manchester, in collaboration with UK Health Security Agency estimates the impact of a wave of infections in terms of prevalence on individuals aged 65 and over, under interventions that would reduce transmission by different levels. In this model, a 25% reduction in contacts outside the home reduces the number of infections in those age 65 and over by a relatively modest proportion. In all scenarios modelled, infection prevalence remains higher than average in houses with three generations of people, and in those where under 20s live with those 65 and older. A greater reduction in peak hospital admissions is observed when measures target all households than when they target only households where those 65 and older are resident.
10. A separate, simple model has considered scenarios where non-pharmaceutical interventions are targeted at reducing contacts either amongst those 55 and over only, or both amongst those 55 and over and between this age group and those aged 0- to 54-years-old.
11. They conclude that the success of such a policy would depend on whether vaccines are ‘all-or-nothing’ (namely that 70% vaccine effectiveness against infection means that 70% of those vaccinated have perfect protection and 30% have no protection) or ‘leaky’ (namely that 70% vaccine effectiveness against infection means that everyone vaccinated is 70% less likely to be infected per exposure each time they are exposed to SARS-CoV-2).
12. In their model, even an 80% reduction in contacts both within the 55 and older age group and between the 55 and older and 0- to 54-year-olds averts only 50% of cases in those 55 and older with an all-or-nothing vaccine. With a leaky vaccine, the overall number of infections in the 55 and older group is much higher, but an 80% reduction in contacts reduces this number by three-quarters.
13. The widespread use of lateral flow tests offers an alternative approach to shielding or segmentation. Given the rapid growth of Omicron, these tests are most effective if taken as short a time as possible before meeting someone at higher risk.
Annex 2: PHIA framework of language for discussing probabilities

0 to 5% remote chance.
10% to 20% highly unlikely.
25% to 35% unlikely.
40% to 50% realistic possibility.
55% to 75% likely or probably.
80% to 90% highly likely.
95% to 100% almost certain.
-
Early assessment of the clinical severity of the SARS-CoV-2 Omicron variant in South Africa, Wolter et al, 2021. ↩
-
Severity of Omicron variant of concern and vaccine effectiveness against symptomatic disease: national cohort with nested test negative design study in Scotland, Sheikh et al, 2021. ↩
-
Report 50 - Hospitalisation risk for Omicron cases in England, Imperial College, 2021. ↩
-
Intrinsic severity is the severity of a variant in a population which has no prior immunity from infection of vaccination. Realised severity is the severity that is actually observed at a given time in a population with a given level of immune protection. ↩
-
More information on generation times and serial intervals is available from Plus magazine: Understanding the generation time for COVID-19 plus.maths.org. ↩
-
SPI-M-O Chairs: Statement on COVID-19, 19 December 2021. ↩
-
SPI-M-O: Consensus statement on COVID-19, 8 December 2020. ↩
-
CO-CIN: Hospital admission for COVID-19 and impact of vaccination, 9 September 2021. ↩
-
UK Summary Coronavirus (COVID-19) in the UK (data.gov.uk). ↩
-
Excess mortality for care home residents during the first 23 weeks of the COVID-19 pandemic in England: a national cohort study (biomedcentral.com), Morciano et al 2021. ↩
-
Protecting and supporting the clinically extremely vulnerable during lockdown: National Audit Office report, 19 February 2021. ↩
-
SARS-CoV-2 variants of concern and variants under investigation. UK Health Security Agency, 17 December 2021. ↩
-
SPI-M-O: Statement on population segmentation, 15 July 2020. ↩
-
SPI-M-O: Statement on population segmentation by age group, 22 July 2020. ↩