Review of the UK Material Deprivation Measures
Updated 12 April 2024

© Crown copyright 2024
This publication is licensed under the terms of the Open Government Licence v3.0 except where otherwise stated. To view this licence, visit nationalarchives.gov.uk/doc/open-government-licence/version/3 or write to the Information Policy Team, The National Archives, Kew, London TW9 4DU, or email: psi@nationalarchives.gov.uk.
Where we have identified any third party copyright information you will need to obtain permission from the copyright holders concerned.
This publication is available at https://www.gov.uk/government/publications/review-of-the-uk-material-deprivation-measures/review-of-the-uk-material-deprivation-measures
By Abigail McKnight, Irene Bucelli, Tania Burchardt and Eleni Karagiannaki
March 2024
DWP research report no.1049
A report of research carried out by the Centre for Analysis of Social Exclusion (CASE) at the London School of Economics and Political Science (LSE) on behalf of the Department for Work and Pensions.
Crown copyright 2024.
You may re-use this information (not including logos) free of charge in any format or medium, under the terms of the Open Government Licence. To view this licence, visit National Archives or write to:
Information Policy Team,
The National Archives,
Kew,
London
TW9 4DU
or email psi@nationalarchives.gov.uk
This document/publication is also available on our website at: www.gov.uk
If you would like to know more about DWP research, email socialresearch@dwp.gov.uk
First published 21st March 2024.
ISBN 978-1-78659-651-2
Views expressed in this report are not necessarily those of the Department for Work and Pensions or any other government department.
Acknowledgements
This Review was commissioned by the Department for Work and Pensions (DWP) and carried out by the Centre for Analysis of Social Exclusion (CASE) at the London School of Economics and Political Science (LSE).
The authors are grateful to the DWP project team who supported this Review, in particular Lottie Devaney for the positive and constructive approach she took to guiding the Review and working closely with the research team. We would also like to thank Grace Gibson, Antonia Ashworth-Davies, Michael Fini Henriques and Charlotte Harris, for their helpful input at various stages of the review. The DWP project tream provided feedback throughout, engaged in thoughtful discussion, sought additional information when required and provided helpful comments on various drafts of this report.
This research benefited from an engaged and experienced DWP steering group chaired by Elaine Squires and composed of Steve Ellerd-Elliott, Mike Elkins, Joanna Littlechild, Natalie Lloyd, Hilary Patel, Luke Staniland, and Mark Vaughan.
We would like to thank our project advisory group who provided invaluable advice and guidance to the project team throughout the Review: Matt Barnes (City University), Jonathan Cribb (Institute for Fiscal Studies), Paula Croal (Office for National Statistics), Paul Fishe (University of Essex), David Gordon (University of Bristol), Rod Hick (Cardiff University), Peter Matejic (Joseph Rowntree Foundation), Steve McKay (University of Lincoln), Jane Millar (University of Bath) and Veronique Siegler (Office for National Statistics).
We are grateful to the individuals who took part in a series of focus groups during January and February 2022. Their willingness to engage in thoughtful discussions on which items and activities should be regarded as necessities for an acceptable standard of living in the UK today, was invaluable. We would also like to thank Siôn Jones (Cardiff University) who led the focus group for Welsh participants, allowing us to offer a focus group for Welsh speakers.
Finally, the research team would like to thank the Family Resources Survey (FRS) project team for supporting the development of a bespoke FRS module to test material deprivation items and FRS interviewers for collecting the valuable information on these test items which underpin much of the analysis presented in this report. We are indebted to all the individuals who voluntarily take part in the FRS, giving up their time to facilitate the measurement of living standards in the UK and who agreed to respond to the test questions which underpin the recommended revisions to the UK material deprivation measures.
Executive Summary
This report contains the findings and recommendations from a review of the UK material deprivation measures. The review was conducted by the Centre for Analysis of Social Exclusion (CASE) at the London School of Economics and Political Science and commissioned by the Department for Work and Pensions (DWP). This followed recommendations made by the Office for Statistics Regulation (OSR) to DWP to review the current set of questions which underpin UK material deprivation measures and determine a way to compare material deprivation across groups.
The aims of the review were to explore:
-
which material deprivation items for families with children, families with working-age adults and families with pensioners should be included in the Family Resources Survey (FRS)
-
the advantages and disadvantages of different approaches for determining who is materially deprived
-
the advantages and disadvantages of developing a core set of questions for the whole population alongside measures aimed at working-age adults, children and pensioners
-
whether the advantages of updating the material deprivation measures outweigh the disadvantages
Material deprivation is a widely recognised concept in the field of poverty analysis. It is a direct measure of poverty derived from the lack of items and activities deemed to be necessary for a minimum acceptable standard of living. In order for measures to capture contemporary material deprivation it is important that necessities included in measures are periodically reviewed to ensure they reflect public perceptions of necessities.
The report begins with a review of existing evidence on material deprivation. This is followed by findings from new qualitative research with focus groups to provide an up-to-date understanding of which items and activities are perceived to be necessary for an acceptable standard of living in the UK today. The evidence review, and qualitative research informed a short-list of items and test questions which were included in the FRS in April, May and June 2022. Results are presented from the analysis of the test question data to assess the suitability, validity and reliability of the test items, and the consistency and additivity of composite material deprivation scales. This led to recommendations for revisions to the UK measures. Although breaks in series make it difficult to analyse trends, the Covid-19 pandemic had already disrupted the series and the Review concluded that the benefits of revising the measures outweighed the disadvantages.
The revised measures include updating of individual-level items in the measures for working-age adults, children and pensioners and a core set of household-level items. Improvements to, and standardisation of, data collection methodologies underpin the revised measures, and the new questions were included in FRS 20232/2024. Finally, recommendations are made in relation to the advantages and disadvantages of different approaches to determining who is materially deprived and further research required to explore a whole population or household level measure.
Author credits
Abigail McKnight is Director of the Centre for Analysis of Social Exclusion (CASE) at the London School of Economics and Political Science (LSE). She is as an economist and her research interests include poverty, multidimensional inequality, low wage employment, social mobility and the evaluation of employment policy. Abigail led the review of UK material deprivation measures.
Irene Bucelli is a Research Officer at CASE at the LSE whose research focuses on multidimensional inequality, poverty and deprivation, and is an experienced qualitative researcher. Irene was primarily responsible for conducting the focus groups, she also contributed to the evidence review, the shortlisting of items and activities for the revised material deprivation measures and the final recommendations.
Tania Burchardt is an Associate Director of CASE, and an Associate Professor in the Department of Social Policy at the LSE. Her research interests include concepts and measurement of poverty and inequality, both quantitative and qualitative, and applied welfare analysis. Tania played a significant role in the qualitative research, contributed to the shortlisting of items and activities for the revised material deprivation measures and the final recommendations.
Eleni Karagiannaki is an Assistant Professorial Research Fellow at CASE at the LSE. She has conducted research on a range of issues relating to poverty and inequality measurement and analysis with a particular focus on understanding how the tax and benefit systems, the labour market and families interplay to shape socio-economic inequalities. Eleni advised on the quantitative analysis, contributed to the shortlisting of items and activities for the revised material deprivation measures and the final recommendations.
Glossary of terms
| Term | Definition |
|---|---|
| Additivity tests | In the context of assessing the properties of material deprivation measures, additivity tests assess whether lacking more necessities included in a measure is associated with greater degrees of deprivation. |
| Benefit Unit | A Benefit Unit in the FRS (also sometimes referred to as a family by DWP) is defined as ‘a single adult or couple living as married and any dependent children’. A dependent child is aged 16 or under, or is 16 to 19 years old, unmarried and in full-time non-advanced education. This is a standard grouping used by DWP for assessing benefit entitlement. So, for example, a husband and wife living with their young children and an elderly parent would be 1 household but 2 families or benefit units. The husband, wife and children would constitute 1 benefit unit and the elderly parent would constitute another. |
| Constrained lack | Lacking an item or activity included in a material deprivation indicator due to a constraint, such as a financial constraint or a disability. |
| Factor analysis | Statistical methods used to identify sets of correlated variables related by common factors which are usually unobserved. |
| Family Resources Survey | The Family Resources Survey (FRS) is a continuous household survey which collects information from a representative sample of private households in the United Kingdom. |
| Item Response Theory | Also known as latent response theory, refers to mathematical models which seek to explain (test) the relationship between a latent trait (an unobserved characteristic or attribute – here material deprivation) and observed outcomes. |
| Latent trait or construct | Theoretical concept, characteristic or attribute which cannot be observed or measured directly. |
| Material deprivation | Material deprivation is a widely recognised concept in the field of poverty analysis. It is a direct measure of poverty derived from the lack of items and activities deemed to be necessary for a minimum acceptable standard of living. |
| Necessity | In this context, a necessity is an item or activity deemed to be necessary for an acceptable standard of living. |
| Prevalence | A measure of the frequency an item or activity (a necessity) is owned or enjoyed within a given population. |
| p-value | The probability value (p-value) is a measure of statistical significance. It provides a measure of how likely it is (under a null hypothesis) to obtain a test statistic value greater than the observed value by chance. Lower p-values denote higher estimated statistical significance. Commonly accepted cut-offs are p-values of 0.1, 0.05 or 0.01 (10%, 5% or 1%, respectively). A p-value of 1% can be interpreted as a 1% probability of estimating a statistical value completely by chance. |
| Reliability tests | These tests are used to assess if a set of candidate items and activities (necessities) included in a composite measure capture the same underlying concept. Reliability tests assess how closely related the candidate items and activities are as a group. |
| Simple absence | Lacking an item or activity included in a material deprivation measure (a necessity) for any reason. |
| Statistical significance | Is an indicator of how unlikely it is that a result is obtained by chance (to a specified degree of confidence). The significance level is the probability of rejecting the null hypothesis (for example, that there is no relationship between two variables), demonstrated by the p-value of the result. |
| Suitability tests | The suitability of candidate items and activities as indicators of material deprivation can be tested through estimating the share of survey respondents who agree that an item or activity is a necessity for a minimum acceptable standard of living. |
| Validity tests | These tests provide an assessment of whether candidate items or activities are valid indicators of material deprivation. Tests assess whether lacking candidate items or activities is associated with deprivation (proxy measures for material deprivation). |
Summary
This report reviews and makes recommendations for revisions to the measurement of material deprivation in the UK.
Material deprivation signifies a standard of living beneath a minimum acceptable level, positioned between destitution (where people lack basic necessities such as food and shelter) and a low but comfortable standard of living with sufficient resources to afford some luxuries. Material deprivation measures are classed as direct measures of poverty which are derived from the lack of items and activities deemed to be necessary for a minimum acceptable standard of living. Lack can be defined in terms of affordability, other barriers (such as disabilities) or simple absence. These ‘necessities’ can change over time due to changes in norms, average living standards, or technological and social change. In order for measures to capture contemporary material deprivation it is important that necessities included in measures are reviewed periodically to ensure they reflect public perceptions of necessities.
Specifically, the aims of the review were to explore:
-
which material deprivation items for families with children, families with working-age adults and families with pensioners should be included in the Family Resources Survey (FRS)
-
the advantages and disadvantages of different approaches for determining who is materially deprived
-
the advantages and disadvantages of developing a core set of questions for the whole population alongside measures aimed at working-age adults, children and pensioners
-
whether the advantages of updating the material deprivation measures outweigh the disadvantages
Research context
In December 2021, the Department for Work and Pensions (DWP) commissioned the Centre for Analysis of Social Exclusion (CASE) at the London School of Economics and Political Science to conduct a review of the UK material deprivation measures. This followed a recommendation from the Office for Statistics Regulation to review the current set of questions that underpin UK material deprivation, and to determine a way to compare material deprivation across groups (OSR, 2021).
It is well over a decade since the items included in the UK material deprivation measures have been reviewed. The child material deprivation indicator was introduced in 2004/2005 and the last time changes were made to the items in this measure was 2010/2011. The pensioner material deprivation indicator was introduced in 2009/2010 and the items in this measure have not been reviewed since. A recently introduced material deprivation indicator for working-age adults is based the subset of adult items included in the child indicator, which remain unchanged since 2010/2011.
Structure of the review
The Review began with a rapid evidence review on material deprivation, focusing on the concept, its practical application and key aspects of material deprivation measures. This was followed by qualitative research with focus groups to provide an up-to-date understanding of which items and activities are considered to be necessary for an acceptable standard of living in the UK today.
The evidence review and qualitative research informed a short-list of items and activities and a series of test questions which were included in the FRS in April, May and June 2022. Analysis of the FRS test question data led to recommendations for changes to the items and activities included in the UK material deprivation measures for working-age adults, children and pensioners. Further recommendations were made to change the FRS question routing and a standard follow-up question used to establish why any of the items are lacked. These recommendations were accepted and changes were introduced in FRS 2023/2024. Finally, recommendations were made in relation to different methodological approaches for determining who is materially deprived.
Key findings from the evidence review
The foundations of the modern concept of material deprivation are commonly traced back to the work of Peter Townsend (1979) (Chapter 2). Key elements of Townsend’s theory are resource constraints leading to deprivation of necessities, a relative concept of poverty determined by societal norms and an understanding that standard of living extends beyond material goods. While the definition of material deprivation has evolved, these key elements remain at the core of the concept.
It is not possible to directly observe material deprivation, instead material deprivation measures include indicative items and activities which incur a financial cost and are considered to be necessary for an acceptable standard of living. Townsend simply measured whether or not individuals lacked items included in his measure (simple absence). Piachaud (1981) argued that judging deprivation on simple absence ignores the possibility that people may choose not to have these items. To take into account differences in tastes and preferences, he stressed the importance of distinguishing between people who lack items because they cannot afford them from people who don’t want them. This led to the now common practice of considering people to be materially deprived of such items if they lack them because they cannot afford them.
To establish which items should be classed necessities, Mack and Lansley (1985) stressed the importance of taking into account public perceptions. Qualitative research and survey evidence are now commonly used to identify candidate socially perceived necessities. Furthermore, an analytical framework has been developed to assess the suitability, validity and reliability of candidate items and activities, and the consistency and additivity of composite material deprivation scales (Guio and others, 2017). Outcomes from these statistical tests combined with expert judgement have been used to identify optimal sets of items and activities to include in material deprivation measures.
Some measures combine material deprivation with low-income status, producing a combined measure which excludes people who are classified as materially deprived but but have higher income. However, the combined measure rules out the possibility that people may still be deprived due to additional needs, other constraints or as a result of measurement error in income. In addition, it has been argued that it risks confusing two concepts and can be seen to contradict the basis for directly measuring low living standards.
Qualitative research findings and short-listing test items
In early 2022, a series of focus groups were held to help assess whether changes were required to the items and activities included in UK material deprivation measures (Chapter 3). Participants were drawn from across the UK, different age groups, income groups, ethnic groups, gender, household types and disability status.
A rapid review of the literature, drawing on evidence from a range of existing and previous approaches to measuring material deprivation, led to a long-list of 103 items and activities. These were classified into ten main categories: (1) Financial security, (2) Food, (3) Clothing, (4) Health, (5) Communications, (6) Mobility, (7) Home and living conditions, (8) Social and leisure activities, (9) Things for oneself, (10) Items and activities related to children.
Each focus group was structured around a series of polls covering items and activities selected from these categories. Participants were invited to indicate any of the items they thought were necessities which people should be able to afford for an acceptable standard of living in the UK today. The poll results were used as a starting point for in-depth discussions.
Following the focus groups, set criteria were used to select a short-list of items and activities. These were based on data collected in the focus groups, information from secondary data sources on prevalence and support for particular items or activities, the potential impact of variation in tastes, differences in cost and whether an item or activity is likely to be specialist for particular groups in the population. Finally, the relationship to other short-listed items or activities was considered along with relevant evidence from the rapid evidence review. The result was a recommendation to test a short-list of 35 items and activities.
The test questions were included in the FRS during April, May and June 2022. The first set of questions asked respondents to identify necessities from the short-list (necessities questions). A second set asked respondents if they lacked any of the short-listed items and activities (material deprivation questions).
The FRS test questions included a number of changes to the way in which information on material deprivation is collected. Firstly, one adult member of each household responded to questions on a common set of 13 household-level items (Chapter 4). These items, such as whether the home is damp-free, apply to all members of a household and, therefore, do not need to be collected from more than one person. This reduces the survey burden relative to asking a representative adult in each benefit unit or multiple adults in mixed age BUs, improves comparability between age groups and potentially aids the development of a whole population measure. Secondly, a two-step method established whether respondents lacked any of the items or activities before asking why they lacked any using a standardised follow-up question. Previously, this two-step method was used for pensioners only following recommendations made prior to the pensioner measure being introduced in 2009/2010. The standardised question routing and options for why any item is lacked removes inconsistencies in the current data collection. The changes improve the data collection methodology, increase comparability between age groups and aid the potential for developing a whole population measure.
Recommended changes to the material deprivation items and case for change
Analysis of the FRS test question data informed a set of recommendations on which items and activities should be included in revised material deprivation measures for working-age adults, children and pensioners. This involved first establishing the suitability of items and activities based on responses to the necessities questions, then assessing the validity and reliability of individual items, and finally establishing the consistency and additivity of composite material deprivation scales based on responses to the material deprivation questions. Recommendations for revisions to the UK material deprivation measures were based on assessing the strength or weakness of individual items based on the test results combined with expert judgement.
Although breaks in series make it difficult to analyse trends, the Covid-19 pandemic had already disrupted the series in recent years and the Review concluded that the benefits of revising the measures outweighed the disadvantages. The main advantages were:
-
updating the necessities to items and activities which are perceived to be necessary for a minimum acceptable standard of living in the UK today
-
standardisation in data collection methodology
-
a core set of household-level items which reduces the survey burden relative to collecting this information from each benefit unit or multiple adults in mixed age BUs, increases comparability between age groups and, potentially, aids the development of a whole population measure
Recommendations for revisions to the material deprivation measures were accepted and new questions were included in the 2023/2024 survey. To aid an assessment of the impact of a break in the series, it was agreed to split the 2023/2024 FRS sample, with 75% of respondents asked the new material deprivation questions and 25% the previous questions. From 2024/2025, only the new questions will be included in the FRS.
The items and activities in the revised material deprivation measures for working-age adults, children and pensioners are shown in the tables below.
| Household-level | Working-age | Children | Pensioners |
|---|---|---|---|
| Able to pay bills without cutting back on essentials | Yes | Yes | Yes |
| Able to put money aside for unexpected expenses | Yes | Yes | Yes |
| Cover cost of repair or to replace appliances | Yes | Yes | Yes |
| Home in good state of decoration or repair | Yes | Yes | Yes |
| Home adequately warm in cold weather | Yes | Yes | Yes |
| Home damp free | Yes | Yes | Yes |
| Reliable access to internet at home | Yes | Yes | Yes |
| Access to computer or tablet | Yes | Yes | Yes |
| Adequate access to reliable transport | Yes | Yes | Yes |
| Heating, electrics and plumbing in good working order | Yes | Yes | Yes |
| Home contents insurance | Yes | Yes | Yes |
| Individual-level | Working-age | Children | Pensioners |
|---|---|---|---|
| Three meals a day | Yes | Yes | Yes |
| Fresh fruit or vegetables every day | Yes | Yes | Yes |
| Annual break away from home | Yes | Yes | Yes |
| Without regular money worries | Yes | Yes | |
| Regular payments to workplace or private pension | Yes | ||
| Appropriate clothes for work or job interview | Yes | ||
| Regular dental appointments | Yes | Yes | |
| Go out socially at least monthly | Yes | Yes | |
| See friends and family at least monthly | Yes | Yes | |
| Small amount of money for oneself | Yes | Yes | |
| School trips | Yes | ||
| Enough clothes feel comfortable wearing | Yes | ||
| Organised weekly activity outside school | Yes | ||
| Friends round monthly | Yes | ||
| Age suitable toys or games | Yes | ||
| Enough bedrooms for children 10+ years | Yes | ||
| Toddler, nursery or playgroup at least weekly | Yes | ||
| Place for homework | Yes |
Notes: A full description of the items and activities can be found in Chapter 7.
Recommendations related to the strength of different approaches for determining who is materially deprived
The review also examined and made recommendations in relation to the advantages and disadvantages of different approaches for determining who is materially deprived. These were: 1) determining optimum deprivation score thresholds, 2) prevalence weighting, 3) combining material deprivation status with low-income, 4) using simple absence versus constrained lack.
1) Recommendations in relation to determining optimum deprivation score thresholds
(a) It was not within the remit of the Review to recommend optimum thresholds for the revised measures; data collected in the FRS for the first year, rather than the smaller FRS test question dataset, is required for this. However, the Review assessed different methodological approaches and recommended using a combination of statistical analysis and judgement to determine where the new thresholds are set. To provide full transparency to users, documentation detailing the decisions made, and why, should be published alongside the statistics.
(b) For the statistical modelling, we recommend DWP does not rely on household income alone to test which thresholds are best at discriminating between deprived and non-deprived groups. We recommend the development of a composite standard of living measure which could include information on savings, debts and food security, and recognises differences in needs/costs faced by different household types. For example, single parent households or where any household member has a long-standing illness or disability.
2) Recommendations in relation to prevalence weighting and type of material deprivation measure
(a) Given the lower complexity and greater transparency of simple count measures, we recommend additional research to establish whether such a measure would have led to substantially different estimates of material deprivation over the last decade. If not, we recommend moving to a simple count measure.
b) If prevalence weighting is continued, we recommend a number of items and activities should be given the maximum weight of one irrespective of prevalence rates. The degree of deprivation felt by lacking some items is very unlikely to be affected by prevalence. We recommend further exploratory work to assess the desirability of giving the maximum weight to a damp free home, keeping home adequately warm in cold weather, able to pay bills, three meals a day and daily fresh fruit and/or vegetables.
3) Recommendations in relation to combining material deprivation status with a low-income indicator
(a) To gain a clearer picture of poverty trends, we recommend that alongside the housing below average income (HBAI) low income series and the combined low income and material deprivation series (a legal requirement for the child poverty measure), DWP publishes new HBAI headline series on material deprivation alone. Currently DWP release this measure via their online dissemination tool, Stat-Xplore, including the standalone metric in the publication would also meet some users concerns about the combined measure conflating two concepts (low income and material deprivation).
(b) We recommend HBAI headline statistics for combined measures are based on after housing costs and not before housing costs income. This is a more realistic measure of the resources available to spend on necessities and consistent with other HBAI headline series.
4) Recommendations in relation to simple absence versus constrained lack
(a) Evidence suggests that adaptive preferences mean that people underreport financially constrained lack of necessities. We recommend further research to understand income gradients in people reporting that they, or their children, lack items or activities due to not wanting or needing them. This research could lead to the use of simple absence rather than constrained lack to establish deprivation for a wider set of items or activities.
(b) Parents may be more likely than children to report child-related items are lacked because children don’t want or need them rather than not being able to afford them. We recommend further research to establish the feasibility of asking children (aged 11+) directly about whether they lack items or activities, and the reason(s) why they lack any.
Recommendations on developing a core set of questions for the whole population alongside measures aimed at specific family types
Recommendations were accepted for a core set of household-level items in the revised measures for working-age adults, children and pensioners. The Review went further and assessed the advantages and disadvantages of developing a whole population, or household-level, material deprivation measure. The advantage of a whole population or household-level measure is that it would make it easier to compare rates of material deprivation between different age-groups as well as estimate population level rates. The disadvantage is that creating such a measure is likely to involve compromises which lead to less accurate estimates of material deprivation than the current age-group specific approach. Challenges were identified including lack of a consistent relationship between the individual-level measures and a measure constructed from household items alone. Therefore, we would not recommend moving to a measure based on household items alone, or combined with some individual-level items, at this point. If DWP wishes to pursue this further, the following work should be considered:
(a) For a measure based on the core household-level items alone, determine an optimum deprivation threshold, whether the measure should be based on wider constrained lack or financially constrained lack of items and whether material deprivation status should be combined with a low-income indicator.
(b) Assessing whether an alternative approach to defining household-level material deprivation could be based on whether any household member is classified as materially deprived according to the age-group specific measures which have passed statistical tests and validation from qualitative research.
(c) Exploring whether estimates from the age-group specific material deprivation measures can be added together and combined to provide valid whole population estimates.
Without further research, we recommend material deprivation is measured at the individual-level, based on the tried and tested measures for working-age adults, children and pensioners.
1. Introduction
The Department for Work and Pensions (DWP) commissioned the Centre for Analysis of Social Exclusion (CASE) at the London School of Economics and Political Science to conduct a review of the UK Households Below Average Income (HBAI) material deprivation measures. The project included reviewing the current set of items (necessities) included in existing measures to derive material deprivation status, the related questions included in the Family Resources Survey (FRS) and the methodology used to construct these measures.
It is well over a decade since the items included in the UK material deprivation measures have been reviewed. The official child material deprivation indicator was introduced in 2004/2005 and following a review in 2009, some minor changes were made to the items included in the measure from 2010/2011. The pensioner material deprivation indicator, for adults who have reached the State Pension Age, was introduced in 2009/2010 and the items included in this measure have not been reviewed since. A recently introduced material deprivation series for working-age adults (adults below State Pension Age) is based on a subset of items included in the child indicator which are relevant to adults. These items have remained unchanged since 2010/2011. In order for measures to best capture material deprivation it is important that the items from which these measures are derived are periodically reviewed to ensure they are perceived as necessities by the public.
Specifically, the aims of the review were to explore:
-
which material deprivation items for families with children, families with working-age adults and families with pensioners should be included in the Family Resources Survey (FRS)
-
the advantages and disadvantages of different approaches for determining who is materially deprived
-
the advantages and disadvantages of developing a core set of questions for the whole population alongside measures aimed at working-age adults, children and pensioners
-
whether the advantages of updating the material deprivation measures outweigh the disadvantages
The project began with a review of existing evidence on the concept of material deprivation and its measurement. This was followed by qualitative research with focus groups to help identify a contemporary list of necessities. The evidence review and qualitative research informed the selection of a short-list of items and activities which were tested in the Family Resources Survey during April, May and June 2022. Analysis of the FRS test question data combined with other evidence informed recommendations for changes to the items and activities included in the UK material deprivation measures for working-age adults, children and pensioners. Other recommendations were made related to FRS question routing and a standardised follow-up question used to establish the reasons why any of the items or activities are lacked. These recommendations were accepted and changes to the material deprivation questions are included in the FRS from 2023/2024. Finally, recommendations are made in relation to different approaches for determining who is materially deprived and the development of a whole population measure.
The report is structured as follows: Chapter 2 covers a review of existing evidence on material deprivation, Chapter 3 summarises findings from the qualitative research with focus groups, Chapter 4 presents the short-listed items and activities which were tested in the FRS, Chapter 5 contains the results from statistical tests on the test items and activities, Chapter 6 includes statistical test results on the core household-level items when considered alone, Chapter 7 presents the recommendations for changes to the items and activities in the UK material deprivation measures, Chapter 8 provides an assessment of the advantages and disadvantages of different approaches for determining who is materially deprived. It includes recommendations for further changes to the UK measures and more research to fill knowledge gaps.
2. Evidence review
This chapter contains a review of existing evidence on material deprivation focusing on the concept, its practical application and key aspects of material deprivation measures. It covers:
-
the foundations of the modern concept of material deprivation which are commonly traced back to the work of Peter Townsend. Key elements of Townsend’s theory of deprivation are resource constraints leading to deprivation of necessities, a relative concept of poverty determined by societal norms and an understanding that standard of living extends beyond material goods to include activities
-
how material deprivation is a standard of living beneath a minimum acceptable level, positioned somewhere between destitution (where people lack basic necessities such as food and shelter) and a low but comfortable standard of living with sufficient resources to afford some luxuries
-
how the measurement of material deprivation has evolved to take into account differences in tastes and preferences. This is to distinguish between people who lack items deemed to be necessities because they cannot afford them from people who lack them because they do not want them
-
the role of qualitative research to establish which items and activities should be deemed necessities through the use of interviews or focus groups to produce short-lists of socially perceived necessities rather than relying on expert judgement alone
-
the development of an analytical framework and testing criteria to inform the selection of necessities to include in material deprivation measures. These statistical tests assess the suitability, validity and reliability of individual items and activities, as well as the consistency and additivity of composite measures
-
the pros and cons of measures combining material deprivation with low-income status. Although there are seen to be some advantages to using a combined measure as it excludes the possibility of higher income individuals being counted as materially deprived, there are also some disadvantages. A main motivation behind the development of material deprivation measures was concern about flaws in income based measures. Combining low income status with material deprivation could be seen as contradictory and risks confusing two different concepts
2.1. Concept
Material deprivation is now a widely recognised concept in the field of poverty analysis. It is distinct from income poverty, multidimensional poverty or social exclusion, although related to all three. Each concept has certain advantages and are best viewed as complements, expanding our understanding of disadvantage and helping to inform policy. People are considered to be materially deprived if they lack ‘necessities’. Necessities include items (goods, activities, services and amenities) for which a lack of is understood to indicate deprivation.
The foundations of the modern concept of material deprivation are commonly traced back to the work of Peter Townsend (1979, 1987). In Poverty in the United Kingdom, Townsend set out a theory of relative deprivation:
Individuals, family and groups in the population can be said to be in poverty when they lack the resources to obtain the types of diet, participate in the activities and have the living conditions and amenities which are customary, or are at least widely encouraged or approved, in the societies to which they belong. Their resources are so seriously below those commanded by the average individual or family that they are, in effect, excluded from ordinary living patterns, customs and activities. (Townsend, 1979, 31)
Key elements of Townsend’s theory are resource constraints leading to deprivation of necessities, poverty being a relative concept determined by societal norms and an understanding that standard of living extends beyond owning material goods to include activities and amenities. While the definition of material deprivation has evolved, these key elements remain at the core of the concept.
In the study of material deprivation, it is important to identify a standard of living which is beyond survival or subsistence as there is more to life than just living (Mack and Lansley, 1985; 57). Figure 2.1 shows a visual representation of the position of material deprivation on a standard of living scale. Standard of living can be thought of as a continuum from very low levels to very high levels, with the material deprivation threshold defined in terms of a level which constitutes a minimum acceptable standard of living. The threshold is positioned somewhere between destitution where people lack very basic types of necessities such as food, clothing and shelter and a low but comfortable standard of living with sufficient resources to afford some luxuries.
Figure 2.1: Material deprivation relative to destitution and comfortable living standards
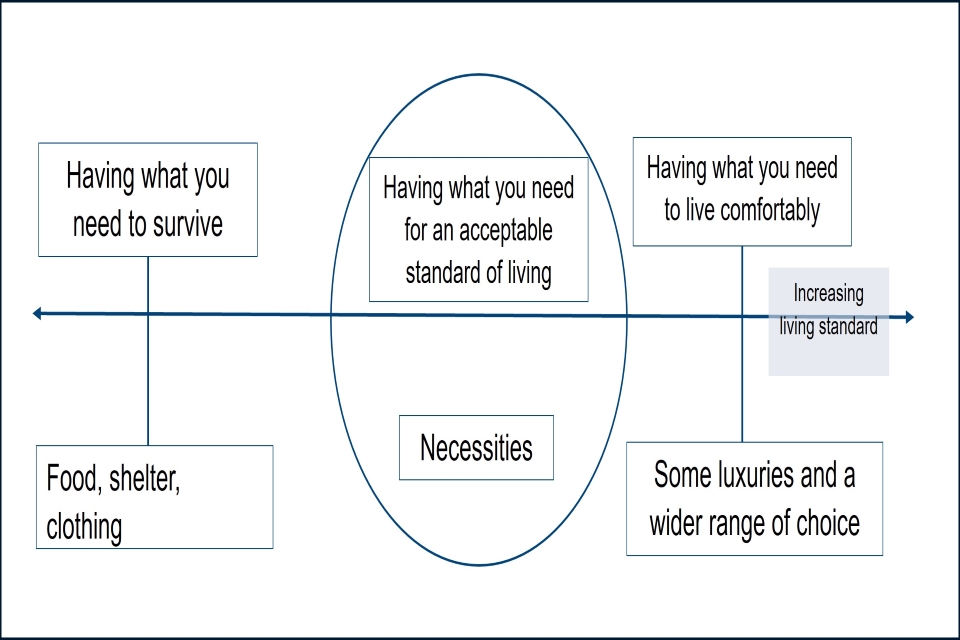
Source: prepared by the authors
Considering where the threshold lies is important for understanding the concept and, as explored further in Section 2.2, in operationalisation (the process of defining the measurement) and measuring material deprivation.
What sets material deprivation apart from multidimensional poverty and social exclusion is the focus on resource constraints leading to deprivation. That is not to say that resource constraints are not an important element or driver of multidimensional poverty or social exclusion, but from a material deprivation perspective, necessities only include items with a monetary value. In contrast, multidimensional poverty or social exclusion measures tend to include non-monetary indicators, or items or services for which individuals do not directly pay for at the point of need or use. A further key difference between material deprivation and social exclusion is in the dimensions they cover. For social exclusion, a broader range of dimensions is appropriate, including health and education, while material deprivation indices focus on material living conditions (Guio and Engsted Maquet, 2007). Examples of non-monetary items in multidimensional poverty measures include education outcomes such as low levels of education attainment (see, for example, Alkire and Foster, 2011) and social exclusion can include indicators of political engagement such as voting in elections (see, for example, Burchardt, Le Grand and Piachaud, 1999).
Using information on lack of necessities to calculate a relative deprivation score, Townsend sought to identify income thresholds beneath which people living in different household types are disproportionately deprived (Townsend, 1979, 258). The results were mixed but he found some evidence of deprivation threshold income levels for different types of households, all of which were above benefit levels in place at the time.
This approach of using information on deprivation of necessities to identify an income poverty threshold provides a measure of minimum standards of living. A number of measures have developed this approach further including budget standards and minimum income measures based on the cost of baskets of goods required to achieve a minimum standard of living (see, for example, Deeming, 2005). The UK Minimum Income Standard, first developed by Bradshaw and colleagues (Bradshaw and others, 2008) with funding from the Joseph Rowntree Foundation, identifies a set of necessities, estimates the cost of these necessities and calculates the minimum level of income required to pay for them.
More than one minimum income threshold can be set for different types of household. Households with income below the relevant threshold are unable to meet this minimum standard of living. A key difference between minimum income standards and material deprivation is that material deprivation measures focus on whether or not people are deprived of a selection of indicative items which have a monetary value and have been deemed to be necessities. In contrast, the minimum income standard approach calculates the cost of achieving a minimum standard of living identified in terms of a full set of necessities and then converts this cost into an income threshold.
2.2. Practical application of the concept and the identification of necessities
Material deprivation falls into the class of ‘direct’ measures of poverty which seek to establish standards of living through directly asking people about how they live and what they have. In contrast, income-based measures of poverty have been described as indirect measures, or proxy measures (McKay, 2004, Ringen, 1988). Ringen argues that income is not a reliable measure of poverty defined in terms of low consumption (Ringen, 1988, 359).
The challenge to measuring material deprivation is that it is a latent construct, a theoretical concept, which means it cannot be observed directly or measured directly. It is also multi-faceted as Townsend’s definition of relative deprivation highlights, which adds to the complexity. Measurement involves identifying an optimal set of indicators that reflect the latent construct and devising a measure which brings together information across these indicators.
Townsend used a household survey to collect information on 60 indicators reflecting ‘style of living’. These covered: diet, clothing, fuel and light, home amenities, housing and housing facilities, the immediate environment of the home, the characteristics, security, general conditions and welfare benefits of work, family support, recreation, education, health and social relations (Townsend, 1979, 249). For ‘illustrative purposes’, Townsend identified a set of 12 items for which going without any of these was seen as an indicator of relative deprivation. He summed across the following 12 items to compute a relative deprivation score:
- A week’s holiday away from home in last 12 months.
- (adults) A friend around for meal or snack in last 4 weeks.
- (adults) To go out with a relative or friend for a meal or snack in last 4 weeks.
- (children under 15) A friend around to play or for tea in last 4 weeks.
- (children) Party on last birthday.
- An afternoon or evening out for entertainment in last 2 weeks.
- Meals including fresh meat (including meals out) at least 4 days a week.
- Not going without a cooked meal one or more days in past 2 weeks.
- A cooked breakfast most days of the week.
- A refrigerator.
- Usually having a Sunday joint.
- Sole use of 4 amenities indoors (flush WC, sink or washbasin and cold water tap, fixed bath or shower, gas or electric cooker).
Townsend does not explain the criteria used for selection of the 12 items in his summary index which appears to be based solely on Townsend’s ‘expert judgement’ (Piachaud, 1981, Mack and Lansley, 1985). However, Townsend does say that the index is for illustrative purposes and acknowledged that more analysis was required (Townsend, 1979, 251), and picked up on this point in later work (Townsend, 2000; 17).
Key criticisms of Townsend’s construction of the summary index are that the selection of items was arbitrary and that he did not take into account ordinary people’s views on which items should be regarded as necessities. Mack and Lansley (1985) argued that public perceptions of which items are necessities should be incorporated into the development of a relative deprivation measure. In their Poor Britain study, a nationally representative sample of adults was asked to select from a list of 35 items which they thought were necessary and people should be able to afford, or not necessary but may be desirable (Mack and Lansley (1985, 50). Survey evidence established that the majority of people in 1980s Britain saw necessities to include a wide range of goods and activities reflecting a socially established minimum standard of living above mere survival or subsistence (Mack and Lansley, 1985, 53). Mack and Lansley used the survey evidence to derive a deprivation measure made up of 26 items (out of the original 35 items) which had been identified as ‘necessities’ by the majority of respondents using a simple 50% threshold (Mack and Lansley, 1985, 88).
This approach, asking the public in a survey which items from a list of candidate items, they regard as necessities for a minimal acceptable standard of living and only including those which are supported by the majority, has become known as the ‘consensual approach’ to identifying necessities and is now widely used (see, for example, Saunders, Naidoo and Griffiths, 2008, Abe and Pantazis, 2014). Despite widespread adoption of this approach, some experts have questioned whether this method really identifies a consensus (McKay, 2004, Walker, 1987, Halleröd, Bradshaw and Holmes, 1997). Halleröd, Bradshaw and Holmes (1997, 215) take issue with the use of the term ‘consensus’ as Mack and Lansley only require 50% of survey respondents to regard items to be necessities while a consensus implies that everyone is in agreement. In addition, the rule that an item needed support from at least 50% of respondents is set by Mack and Lansley and the 50% cut-off is ultimately arbitrary (Halleröd, 1994). Halleröd, Bradshaw and Holmes (1997) also highlight the problem that the closer a person’s choices are to the average choice (the so-called consensus ranking of items), the less likely that person will be classified as deprived because they prioritise the short-listed ‘necessities’ over other items. In contrast, a person who prioritises items deemed to be non-necessities over items classified as necessities, the more likely they are to be classified as deprived (Halleröd, Bradshaw and Holmes, 1997, 215).
McKay (2004) finds only limited agreement among survey respondents on which items, selected from a short-list of candidate necessities, are necessary and families should be able to afford. He found that the total number of items identified as necessities varied widely between survey respondents and, although the average number of items identified as necessities was similar between population sub-groups (for example, between men and women), within group variation was high. Based on findings from statistical tests, McKay concludes that there is a relatively low overall rate of agreement on which items are regarded as necessities. He also found marked variation between social classes with some classes expressing much stronger support than others for particular items to be regarded as necessities. McKay (2004, 214) appears to support Halleröd (1994) and Halleröd, Bradshaw and Holmes (1997) who proposed either abandoning the majority-view method for short-listing necessities from a longer-list of candidate items and simply using all of the candidate items, or using all candidate items but weighting each item by the share of respondents regarding it to be a necessity. Halleröd (1995) used this weighting system for his direct measure of poverty in Sweden. However, measuring material deprivation using the longer list of items faces the same criticism levelled at Townsend’s approach as it relies on experts’ judgements on which items to include on the list. An alternative is to combine these judgements with qualitative research but it is hard to see what objective basis could be used to select items and if a ‘consensus’ approach is sought, for example in focus groups, whether this produces a ‘better’ outcome. In addition, a much longer list of items leads to a more complex assessment of deprivation.
McKay (2004, 214) also questions whether necessities are really being identified due to what appears to be inconsistent expenditure decisions. The underlying assumption is that people first spend limited resources on securing necessities before paying for luxuries. As we saw earlier, the concept of material deprivation in relation to living standards is that it is positioned somewhere between destitution and living comfortably (being able to afford some luxuries and having more choice). McKay (2004) finds that 99.8% of respondents to the Millennium Survey of Poverty and Social Exclusion (PSE) who reported that they are unable to afford two or more items classified as necessities, had one or more of the 19 items that had not met the criteria to be classified as necessities (i.e. non-necessities).
What appears to be contradictory behaviour could, in part, be due to differences in assessments of what is and what is not a necessity. For example, car ownership was deemed not to be a necessity because less than 50% of respondents perceived it to be so. However, a car is clearly a necessity for some people, such as those living in rural areas lacking good public transport links, or people who need a car for work, or because they or a family member has limited mobility, or some other factor which makes owning a car essential. Indeed, McKay finds that there is a strong correlation between car ownership and cars being regarded as essential and a strong relationship overall between having an item on the longer list of candidate necessities and rating the item a necessity (McKay, 2004; 216). This means that owning a car while not being able to afford two or more of the items deemed by a simple majority to be necessities cannot be seen as proof that people are ranking luxuries before necessities.
It is also important to understand that items in the longer list of candidate necessities which did not meet the 50% support criteria, can hardly be described as luxuries. Perhaps the best way to describe these items is ‘near-necessities’ as they had met criteria used by analysts to be regarded as candidate necessities. We should be more concerned about people having items which are objectively luxuries, such as a new top of the range car, multiple holidays abroad every year, the latest top brand mobile phone, a heated swimming pool, a second home, etc., while reporting that they are unable to afford items classified as necessities.
It might also be better, or at least less contentious, to refer to necessities identified using these methods as ‘socially established necessities’ (Mack and Lansley, 1985; 59, use this description but also describe the method they use as a consensus based approach) or ‘socially perceived necessities’ (used by Bradshaw, 2008; Hirsch, 2015 and others) rather than ‘consensus based necessities’ which risks over-claiming a clear consensus.
Some measures, such as the official UK material deprivation measures, weight deprivation of items by prevalence of people possessing them; thus giving a higher weight to items which are commonly owned (DWP, 2023a). The assumption is that lacking something more people have, indicates a higher level of deprivation (and vice versa) (Halleröd, 1994). Using such a method helps to address concerns about giving all necessities equal weight and addresses some of McKay’s concerns.
Weighting items by prevalence can also help to reflect changes in preferences or needs particularly in material deprivation measures for which component necessities are updated infrequently. Weights increase over time for items which become more commonly held, reflecting an assumption that deprivation associated with lacking these items also increases. For example, not being able to afford a mobile phone when virtually everyone else has one leads to a higher deprivation score than when having a mobile phone was less common. A more questionable feature of using prevalence scores as weights is that during economic recessions when living standards fall, the prevalence of certain items is also likely to fall, leading to lower weights and lower deprivation scores.
Material deprivation is a relative measure and it is therefore right that reference is made to typical living standards, which can fall, but people’s views on what is a minimum acceptable standard of living might not change. Therefore, putting lower weight on, for example, not being able to afford to replace or repair domestic appliances just because more people cannot afford to do so can be considered a flaw.
Another option is to weight each item according to the share of people who consider it to be a necessity. Giuo (2009) calls these consensual weights with higher weights for items given greater social importance. Using European data, Guio (2009) shows that applying national prevalence weights or consensual weights leads to a reduction in estimates of material deprivation relative to unweighted estimates. Prevalence weights were found to reduce material deprivation estimates as the lowest weights are given to the items which people are most likely to lack.
The share of people wanting items (‘degree of importance’), has been used in the development of material deprivation measures to identify necessities where information on perceptions of which items should be considered necessities has not been available (Guio and others, 2017). For example, this method was recently used in the revision of the EU measure of material deprivation where a 70% threshold was used to determine item suitability (Guio and others, 2017). The share of people wanting items was estimated using survey data based on the share of people reporting they owned an item added to the share of people reporting that they would like to have the item but lacked it because they could not afford it.
Although Mack and Lansley (1985) introduced a method for improving the selection of items included in material deprivation measures through directly asking the public to help identify necessities, there remained questions regarding the arbitrary nature of constructing the longer list of candidate items to choose from. As outlined above, Townsend chose a long list of items to reflect a number of key dimensions which were considered to be important but beyond this judgement no specific criteria was used.
For the Poor Britain study, Mack and Lansley selected 35 items representing a ‘cross-section of household’s social and personal lives, including food, heating, household durables, clothing, housing conditions, transport and leisure and social activities’ (Mack and Lansley, 1985, 50). Items included heating to warm living areas of the home if it is cold, public transport for one’s needs, a refrigerator, two hot meals a day (for adults), a garden, children’s friends round for tea or a snack once a fortnight and a packet of cigarettes every other day. It is not clear what selection criteria they used to decide which items to include on this list which is crucial as items not included cannot be identified as necessities, and cannot feature in the final list of items used to determine who is materially deprived. Halleröd criticised the arbitrary nature of the long list “…it was Mack and Lansley who made the initial selection of those items which might be regarded as necessities. The respondents did decide which items from the list were necessary but they did not decide the range of items from which they could choose.” (Halleröd, 1994, 3).
In recent years qualitative research has been used to improve the selection of items to include on the longer list of candidate necessities. For example, Hirsch and Smith (2010) used qualitative research to help inform the revision of the UK child material deprivation measure. Qualitative research with focus groups which bring together people from a range of backgrounds (including those with direct experience of poverty) to deliberate on what items might be regarded as necessities has been used to help inform candidate necessities.
Participants can be provided with briefing material in advance including the definition of material deprivation, illustrative examples of necessities, guidance on how the focus group will be conducted, and the purpose and aims of the focus group. For example, this can include how the information will be used, whether the aim is to reach a consensus or simply to gather a range of views, etc. The advantage of this approach is that the final list of candidate policies is not limited by the items which experts have identified as it can include additional items suggested by focus group participants. In addition, if there is no, or relatively little, support for some items these can be excluded from the list of candidate items included on the survey.
One issue is that a small number of studies have become very influential, leading to researchers and statisticians using the same points of reference for informing lists of necessities. For example, findings from the 2012 Poverty and Social Exclusion study have been used to inform the revised EU material deprivation measure (Guio and others, 2016, 2017), the new EU child material deprivation measure and a measure for Canada (Notten and Kaplan, 2021). Very similar lists of necessities could be due to studies establishing universally perceived necessities in high and middle income countries but qualitative research could help ensure that candidate lists are kept up-to-date and reflect different contexts which can change over time.
2.3. Dimensions of deprivation
Existing material deprivation measures make reference to different dimensions of living standards or different types of consumption. In this section we review how these dimensions have been identified and evolved between different measures.
There is a rich literature focused on understanding the structure of deprivation, often linked to the development of specific measurement instruments. Identifying the importance of different dimensions has often involved the use of statistical methods such as factor analysis. Factor analysis involves applying statistical methods to identify sets of correlated variables (items) related by common factors which are usually unobserved. This literature is helpful to ground and justify the use of distinct indicators. Townsend considered relative deprivation to relate to the “conditions, obligations, expectations and customs of today” in the different “spheres of social life” (Townsend, 1993, 37). This means that material deprivation “arises in different social settings and needs to be understood and explained in relation to these settings” (Townsend, 1979, 433).
As a result, Townsend sought to include all the major areas of personal, household and social life in a survey of standards of living in the UK carried out in 1968/69, covering work to school and home life, community and neighbourhood environment. He used 60 indicators which, outlined in Section 2.2, were structured around diet, clothing, fuel and light, home amenities, housing and housing facilities, the immediate environment of the home, the general conditions and security of work, family support, social relations, recreation, education and health. Some of these dimensions of deprivation encompassed a greater number of indicators compared to others, for instance twelve indicators related to conditions at work, nine to household facilities, while only one indicator related to education and two to recreational activities. This breadth of dimensions of deprivation, however, was significantly reduced in the summary deprivation index. In fact, Townsend’s summary index only covered three dimensions and twelve items, six of which related to social and recreational activities (including two alternative versions for adults and children), four food items and two items related to household facilities and amenities.
As discussed in Section 2.2, subsequent work by Mack and Lansley (1985) questioned Townsend’s summary list, noting that the process by which the twelve items were chosen was not clear. In face of this lack of clarity, the inclusion of items such as “having a cooked breakfast” over, say, “being able to buy new clothes” appeared arbitrary. Mack and Lansley’s ‘consensus based approach’ in the first Breadline Britain study, led to a list of necessities which expanded the dimensions covered compared to Townsend’s summary index, while seeking to focus solely on those aspects of social life “facilitated by access to money” (Mack and Lansley, 1985; 44). This meant, with reference to Townsend’s initial longer list of indicators, that Mack and Lansley included areas such as food, heating, clothing, consumer durables, entertainment, leisure and social activities, as well as services provided at least in part by the public sector such as housing and transport. They did not, however, include public services which they considered “not in the main paid for” such as health and education, and they excluded any indicator related to conditions at work, as this “is not an aspect of life that could readily be improved by higher pay” (Mack and Lansley, 1985; 45).
Following a similar approach, research in other countries such as Ireland also stressed the importance of focusing on items with a monetary value – again excluding items related to universally, publicly provided services such as health and education, and specifying in relation to social activities that these pertained to “something that costs money” (Callan, Nolan and Whelan, 1993). Overall, subsequent measures have largely retained the focus of the dimensions chosen by Mack and Lansley.
Mack and Lansley’s work informed the Poverty and Social Exclusion (PSE) surveys conducted in 1999 and 2012. The PSE surveys explored both people’s perceptions of necessities and their living standards. In the 2012 iteration, the PSE survey included more questions and encompassed more dimensions than the Breadline Britain surveys or the Townsend deprivation index. After testing 76 items (30 for children and 46 for adults), 25 items and activities for adults and 24 for children were identified as essential by a majority of people and 44 were included in the final PSE deprivation index (Gordon, 2017). Figure 2.2 gives a summary of the dimensions included in the main measures covered thus far (excluding items and activities related to children) as well as those relevant to the UK material deprivation measures based on questions included in the Family Resources Survey (FRS), and the EU measure based on the material deprivation module in EU-SILC (discussed below). The items and activities included in the UK and EU measures can be found in Appendix 1.
Figure 2.2. Dimensions of deprivation used in a selection of material deprivation measures
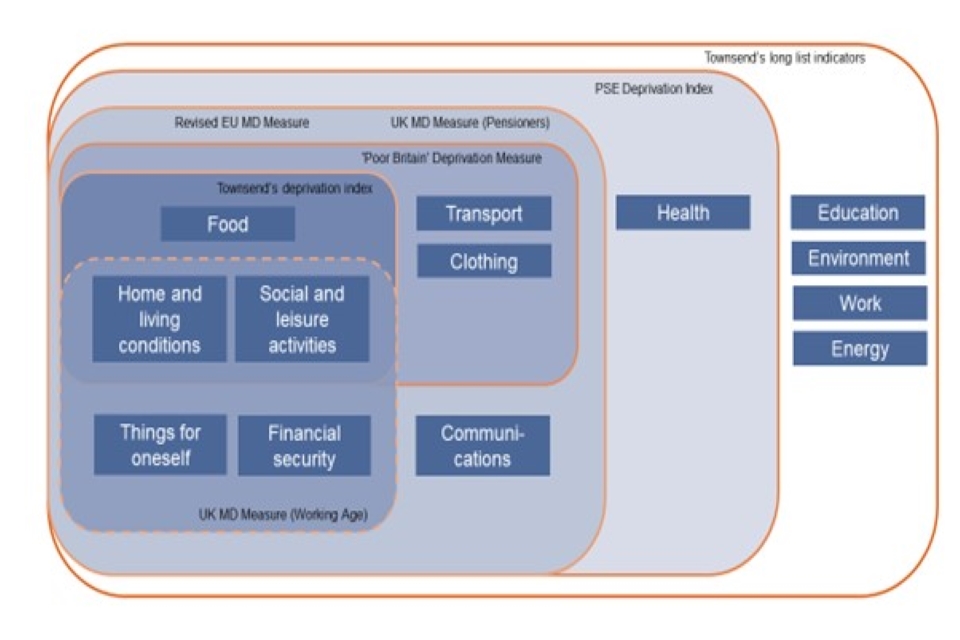
Source: prepared by the authors
Information from the PSE 1999 survey informed the development of the material deprivation questions to include in the Family Resources Survey (FRS) (McKay and Collard, 2004, McKay, 2008). McKay and Collard (2004) drew on the adult and child questions included in the PSE survey and tested them to identify a shorter list which could feasibly be incorporated in the FRS to inform a UK measure, while maintaining the ability to identify most of the same people as deprived. They used factor analysis to study the underlying structure of the data in the PSE 1999, the ONS Omnibus Survey (1999), the Families and Children Study (1999 to 2002) and the British Household Panel Survey (2001, wave 10). The authors identified some common dimensions, such as family and social life (for example, having an evening out, going to the pub, having a meal out, visiting family or friends), having sufficient disposable income (for example, including for holidays or to spend on oneself, savings, to use for repairs), food and clothes, durable goods and financial difficulties (for example, related to debt problems or the ability to keep up with financial commitments).
Material deprivation questions included in the FRS from 2004/2005, spanned four dimensions for working-age adults, namely financial security (savings, keeping up with bills and regular debts, household content insurance), social and leisure activities (holidays), things for oneself (money to spend on oneself) and home and living conditions (keeping the house warm, in a good state of decoration and replacing furniture and major electrical goods). A question related to clothing (two pairs of all-weather shoes) was dropped in 2010/2011 following a review of the child material deprivation measure. A separate suite of questions was introduced for pensioners in 2008 (Legard and others, 2008, McKay, 2008), and covered a range of dimensions with questions related to food, clothing, transport and communications. Items related to health (e.g. going to dentists, opticians, purchasing over the counter medicines) were considered but ultimately not included.
The development of the EU material deprivation measures also built on Mack and Lansley’s work. The key challenge for any measure of material deprivation at the EU level is that what is regarded as acceptable living standards depends largely on the general level of social and economic development, and this tends to vary across EU countries. Cultural differences can further complicate the exercise of understanding what is ‘the norm’ across different societies. This means that items selected for EU indicators need to reflect ordinary living patterns common to a majority or large part of the population in the European Union and most of its Member States (Guio and Engsted Maquet, 2007). Guio and others, (2016, 2017) reviewed the items included in the original 9-item EU material deprivation measure and using data from a special module included in the 2013 wave of EU-SILC, they recommended a revised measure made up of 13 items; six were retained from the original measure and seven were new. Of these items two each relate respectively to clothing, food, financial security, home and living conditions and social and leisure activities, one to communications (computer and internet), transport (car) and things for oneself (some money for oneself). Items tested included some outside these dimensions, for instance in relation to the neighbourhood environment, but these were ultimately excluded.
The final selection of items was informed by a series of statistical tests on item(s) suitability, validity, reliability and additivity. Items related to access to services (bank/postal services, transport), housing (darkness, housing costs, overcrowding), environment (pollution, crime, noise, litter, vandalism) and some consumer durables (TV, telephone and washing machine) failed on reliability grounds (with TV and telephone also failing on validity grounds).
Cross-country reviews of material deprivation measures (Boarini and D’Ercole, 2006, Kenworthy, 2007) covering OECD countries including Australia, Canada, Japan, EU countries, New Zealand, United Kingdom, United States in the early 2000s are helpful as they show how some core dimensions have long been included in material deprivation measures. For instance, food and housing conditions are areas most measures covered. Owning certain durables was also widely included with items such as a telephone or a car largely being the sole indicators for transport and communication dimensions.
As already noted, recent updates of some of the measures, such as the EU measure, have included a wider set of items pertaining to internet access and computer use than in earlier studies. Aspects of financial security (for example, not being in arrears with utility bills, rents or mortgages and being able to save) have also been long used in most countries. Questions referring to subjective experiences are less frequently used, for instance in relation to food insecurity or the ability to make ends meet. Measures of reliance on social networks to cover essential expenses or debts are also less common, but can be found as indicators in countries such as the US, Australia and New Zealand (Boarini and d’Ercole, 2006). Leisure and social activities have been covered widely, with some exceptions in the US and Canada: items such as a holiday away from home can be found in most country measures, and to a lesser extent items such as visiting or having around family and friends.
Based on these reviews, health-related items are not included in material deprivation measures in many countries but in those that do, the focus is on postponing appointments or not undergoing regular check-ups and treatments (for example, in relation to dentists or opticians) due to inability to afford costs, as well as problems in keeping up with medical and hospital bills (Boarini and D’Ercole, 2006, Kenworthy, 2007).
In the UK, the list of items in the PSE Deprivation Index using the 2012 PSE survey includes a question on accessing dental services. Subsequent reforms to NHS dentistry in the past decades have posed challenges in terms of both access to and affordability of services, with many who qualify for free NHS dental services having to turn to private providers for routine treatments and regular appointments (Garratt and others, 2022). This suggests that there might be a good case for including access to dental services within measures of material deprivation where access and cost is an issue. As noted, the exclusion of health care services from material deprivation indicators has been traced back to Mack and Lansley’s research in the Breadline Britain series who chose to exclude these items due to the fact that they are largely publicly funded and provided and households did not need to bear their main costs (at least at the point of use).
This discussion of the different dimensions of material deprivation should also recognise differences in the items included under these broad categories. For instance, while several indices include specific durable goods (such as, a refrigerator or a washing machine), the recent revision of the EU deprivation measure led to a reduction in the number of these items. No household consumer durable goods are included in the current UK material deprivation measures. McKay and Collard (2004) note that excluding specific consumer durables makes the measure less sensitive to product life cycles. Relatedly, Ferragina and others (2013) note that the range of consumer durables that people possess is less important to assess material deprivation than many other necessities, as they may have been acquired before people fell on hard times, or they may not be in a good condition. It would therefore seem more appropriate to focus on households’ ability to sustain costs of repairs or replacement rather than on ownership of these items, as in the UK measures.
Ownership of certain items or engagement in certain activities can have multiple significance and the lists considered here do not, by and large, distinguish or make explicit the different rationales for inclusion. For instance, a telephone has a social function, besides being a durable good; a television or a holiday are respectively a means to enjoy entertainment and a source of leisure but can also represent social status and material prosperity. Similarly, a car is a durable good (and a big ticket item that requires regular expense), a means to access services and participate in activities, but it has also long been representative of social status (Johnson and others, 2010). Change occurs across all these different aspects – besides the product life cycle, some items’ social significance, status and acceptability can change, such as car ownership in face of environmental concerns, or use of second-hand clothes to reduce waste.
Car ownership is included in all the measures examined here which cover transport. Hardship and limitations experienced by households without cars depend on factors such as rurality, availability of public transport, population density and society orientation towards car-ownership, for example, in countries such as the US (Kawabata and Shen, 2007). High correlation between car ownership and income can further justify the inclusion in material deprivation measures, but this should be evaluated in specific contexts as inclusion of car ownership can also create distortions in the resulting picture of disadvantage (Johnson and others, 2010). An exception to the inclusion of car ownership among the measures examined here is the UK material deprivation measure for pensioners, which instead includes “access to car or taxi, whenever needed”. This suggests a shift towards considering access to transport and fulfilment of mobility needs as relevant to material deprivation, rather than ownership per se (and recognises that not all older people drive). Not having a car can affect access to services and employment opportunities as well as the prices paid for other items such groceries or housing. These effects, however, are mediated by context and would be more adequately assessed by also considering public transport supply and accessibility of goods and services (Johnson and others, 2010).
Considering different dimensions can help to inform the selection of necessities in a material deprivation measure. However, if people give up consumption in certain domains before others (for example, if they give up social activities first), a domain-driven approach to item identification can lead to a weaker measure (Bailey, 2020; 896). In a domain-driven approach, priority is given to ensuring that an agreed set of domains (dimensions) are represented in the final selection of items rather than using an analytical framework (testing for suitability, validity, reliability and additivity) to identify an optimum set of items irrespective of their distribution across domains.
2.4. Relationship between minimum income standards and material deprivation measures
As we saw earlier, the minimum income standard (MIS) is a related concept to material deprivation. The building blocks of the MIS are the goods, amenities and services different types of households need if they are to achieve a socially acceptable standard of living (Bradshaw and others, 2008). The focus is on items which are considered to be essential according to ‘needs’, not ‘wants’ (Bradshaw and others, 2008; Hirsch, 2015, 8). An important difference between MIS and material deprivation measures is that the MIS approach seeks to identify, as far as possible, a comprehensive list of items needed to meet a socially acceptable standard of living, while material deprivation measures seek to find a representative set of items for which a lack of can be taken as a strong indicator of deprivation (a standard of living below a socially acceptable level). In addition, material deprivation measurement is based on establishing if people are deprived of necessities due to financial constraints. In contrast, measuring a MIS does not involve establishing whether people have, or even want, identified necessities but estimates the cost of these items to calculate the level of income required to meet a socially perceived minimum living standard (for example, establishing whether or not people can afford to pay for all items deemed to be necessities out of their current income).
To identify the full basket of necessities (or baskets as a number of threshold MIS levels are calculated for different household types), expert assessments have been combined with qualitative research with people from a cross-section of the population. The original MIS exercise involved combining views of experts with qualitative data gathered from 39 focus groups (Bradshaw and others, 2008). Candidate baskets of goods and services were then checked with specialists. For example, food baskets were checked with nutritionists (Bradshaw and others, 2008). Price information was gathered from various sources to calculate overall costs using relatively low cost suppliers for the majority of goods and services, included discounts where available (see Bradshaw and others (2008) for details on how goods and services were priced and Davis and others (2022) for detail for a recent pricing exercise).
Much like material deprivation, the MIS concept is based on a minimum standard of living to “include, but is more than just food, clothes and shelter. It is about having what you need in order to have the opportunities and choices necessary to participate in society” (Hirsch, 2015, 8). Given the closeness of the two concepts in terms of their underlying principle, it is not surprising that similar categories and items tend to appear in both measures. The first MIS budgets included items within the following categories:
- food
- clothes
- accommodation
- utilities
- fuel
- household goods
- personal goods and services
- transport
- social and cultural activities
Similar categories are used in the most recent MIS assessment (Davis and others, 2022):
- housing
- domestic fuel
- food and drink
- clothing
- household goods and services
- health and personal care
- transport and travel
- social and cultural participation
Changes in categories and items occur due to periodic reassessments of necessities (referred to as rebasing).
2.5. Analytical framework to aid the development of material deprivation measures
Statistical tests to aid the selection of items and activities to include in material deprivation measures, usually involve a first stage of assessing the suitability of candidate items and activities, sometimes referred to as face validity. The next stage involves testing for construct validity, reliability and additivity (Gordon and others, 2000, Pantazis and others, 2006, Guio and others, 2012, Guio and others, 2016, Guio and others, 2017). This analytical framework has been developed for identifying an ‘optimal sub-set of deprivation items from the initial list of available items’ (Guio and others, 2017, 7). The tests assess individual items and aspects of an overall scale constructed by combining responses to each item. While the tests seek to introduce statistical criteria for the final selection of items, it is important to acknowledge that selection criteria based on these tests often involves using ‘rules-of-thumb’ or analysts’ judgements. This means that it is important not to over-claim that these tests provide an objective criteria for the selection of items. Given known weaknesses with the tests, analysts usually perform a battery of tests rather than relying on results from a single test before considering omitting an item.
2.5.1. Suitability test
Once a short-list of candidate necessities has been agreed, surveys can be used to collect information on perceptions of which items and activities are regarded as necessities. This information can be used to assess whether candidate necessities can be considered suitable indicators of deprivation in terms of attracting sufficient support from a cross-section of the population.
The suitability of items and activities can be established through estimating the share of survey respondents who agree that an item or activity should be regarded as a necessity. As discussed in Section 2.1, Mack and Lansley used a cut-off of 50% to establish suitability. Items and activities supported by a simple majority of respondents were considered to be suitable indicators of deprivation and candidates for inclusion in a material deprivation measure (Mack and Lansley, 1985, 88).
2.5.2. Validity tests
The validity of candidate items (whether they are valid indicators of material deprivation) is generally assessed by measuring the correlation between lacking an item and a series of independent variables which are known to be correlated with material deprivation (Guio and others, 2016, 221). These variables have typically included poor general health, low household income and subjective measures of financial strain. Items which are not found to be statistically significantly correlated with these variables are candidates for omission as they are considered to be weak at discriminating between people with low living standards and people who are better-off.
Although validity testing using income measures has become a fairly standard approach, it is not without challenge. A key argument made in favour of direct measures of poverty such as material deprivation is concern about flaws in indirect measures based on income variables (concerns about measurement error etc.). Using income to validate necessities for a material deprivation measure seems to contradict these concerns.
Material deprivation measures are believed to capture other aspects of financial constraints. For example, if debts or other financial commitments mean that income levels do not reflect the true standard of living. Likewise, benefits-in-kind (non-wage compensation such as childcare vouchers) and assets can mean that the true standard of living is not reflected accurately in an income measure. Other widely used variables in validation tests can also be problematic. Poor health in older people has been found to have an impact on material deprivation through limiting people’s ability to be independent, as well as contributing to additional costs of living (Kotecha, Arthur and Coutinho, 2013). Variables covering subjective assessments of financial strain arguably could belong in a material deprivation measure in their own right and measures of poor health will be correlated with age and are likely to lead to constrained lack of some items due to other factors (for example, mobility constraints) rather than, or in addition to, financial constraints.
This means that care must be taken in interpreting findings from validity tests. Due to weaknesses with available variables, it is preferable to use a range of variables to validate items rather than relying on a single variable such as income.
2.5.3. Reliability tests
To translate information on whether or not people lack individual items to a measure of material deprivation, the short-list of necessities are combined to create a multi-item scale or index and reliability tests are used to assess the internal consistency of the scale. This amounts to testing if the items included in the scale or index capture the same underlying concept. Reliability tests assess how closely related the items are as a group. Classical Test Theory and Item Response Theory have typically been used to assess the internal consistency of a set of items in a scale.
Cronbach’s coefficient alpha is an estimate of the amount of shared variance, or covariance[footnote 1], among items in a scale relative to the overall variance of the scale. It is often used in psychometric analysis to assess the reliability of questions included in a test through assessing whether each test question is measuring an important aspect of competence in the subject being examined. For material deprivation, Cronbach’s alpha has been used to assess the internal consistency of a short-listed set of necessities (see, for example, McKay, 2011, Guio and others, 2016). Alpha provides an estimate of how closely related the items are as a group, with a high correlation indicating that they are probably measuring the same thing. Although, importantly, it is not a test for a single latent trait or construct (the unobservable variable). Internal consistency is a necessary but not a sufficient condition for a set of items to measure a single latent trait or construct (Tavakol and Dennick, 2011). This is because alpha is based on what is known as the ‘tau equivalent model’ which assumes that each item measures the same latent trait on the same scale (Tavakol and Dennick, 2011). In other words, if all items measure the same latent trait, alpha estimates how well the items measure the latent variable. It is more accurate to refer to this test as a ‘tau-equivalent reliability test’.
Alpha can also be used to assess if each item provides additional information from other items included in a scale. Alpha is expressed as a number between 0 and 1 and the minimum acceptable value is generally regarded to be between 0.7 and 0.8 but this is a ‘rule of thumb’ and not based on any scientifically established objective criteria. The test usually involves estimating Cronbach’s alpha for the overall scale and if alpha is at least 0.7 or 0.8, then the reliability of every item is assessed by dropping each in turn and re-estimating alpha. If the estimate of alpha increases after dropping an item, this item is a candidate for omission from the final measure. However, alpha is sensitive to the number of items included in a scale with a larger number of items leading to higher alpha values, and this can lead to misleading results. A larger number of items increases the estimated reliability of a scale measured by alpha, regardless of whether the items measure a single latent construct or not. Very high values, for example, greater than 0.9, can suggest that the items are ‘too similar’ and a reliable scale could be obtained with fewer items without any loss of information. Overall, the number of items, item inter-relatedness and dimensionality all affect the value of alpha but it remains a useful test of reliability.
Item Response Theory provides a second commonly used reliability test which uses statistical models to assess the characteristics of the individual items included in a scale, rather than focusing on the properties of the overall scale as is the case for Classical Test Theory (Szeles and Fusco, 2013). These models seek to establish a link between the properties of items, individuals reporting on these items and the underlying latent trait being measured. Tests include one-parameter Item Response Theory models which assess item difficulty (deprivation severity) through estimating the probability that an individual who is deprived of an item is also deprived of other items in the scale.
Two-parameter Item Response Theory models can be used to assess the severity and discrimination of each of the items included in a material deprivation scale (Guio and others, 2017). Ideally a material deprivation scale will include items with different degrees of severity as the extent of deprivation will differ between people and a scale made up of items with high severity scores will only identify the extremely deprived. Items which are associated with very high severity (lack of these items is more likely to be associated with destitution than deprivation) can be omitted without any loss of information. As these items are only lacked by a small number of people, sample sizes in household surveys are usually too small for meaningful analysis (Guio and others, 2016). Similarly, items with very low severity scores can generally be omitted without any loss of information as they contribute little additional information to the overall measure.
Item characteristic curves, also referred to as trace lines or item response functions, are a useful visual tool for assessing severity and discrimination using the results from Item Response Theory models. The item response function gives the probability that a person experiencing a given level of deprivation will report that they lack an item because they cannot afford it. Severity can be assessed by comparing each curve’s inflexion point (the point at which the probability of reporting that an item is lacked due to a financial constraint is 0.5; the steepest point of the slope), the item’s severity score. The inflexion points of item characteristic curves for items associated with the lowest degrees of severity are closest to the y-axis. Severity scores are measured in units of standard deviation from the average. Guio, Gordon and Marlier (2012) set a severity criterion of three standard deviations from the mean to identify items with ‘too high’ or ‘too low’ severity which is now widely used as a basis for considering the omission of items from a scale.
Steeper item characteristic curves represent items which are good at discriminating between the deprived and the non-deprived and items with poor discriminatory power have shallow curves. In the case of an item with poor discriminatory power, the shallow curve shows that the probability of not being able to afford an item varies little between people with different degrees of deprivation. These can be items which the deprived are more likely to report that they do not want or need rather than cannot afford. This may be due to differences in tastes and preferences between the deprived and non-deprived. In addition, items for which there are very low or no cost options available are not good at discriminating between the deprived and non-deprived. For example, meeting with a friend once a week could be cost free. Low discriminatory power could also be due to relatively low levels of support for classifying the item as a necessity in the first place. If items only gained a little over the 50% threshold to be classed a necessity, they are unlikely to be prioritised by a large share of people and, therefore, lacking these items is less likely to discriminate than items with high levels of support.
Differential item functioning can be used to assess if the probability of not being able to afford items varies by deprivation level (the latent trait) for different groups. Comparing item characteristic curves for different groups (for example, between ethnic groups, gender or social class) can help inform if there are inequalities in severity and discrimination power of items.
2.5.4. Additivity tests
These tests assess whether deprivation of short-listed necessities is additive; that is, the degree of deprivation increases in line with the number of items lacked. For example, if an individual lacking four items is more deprived than someone lacking three or fewer. Testing is challenging due to the fact that material deprivation is not directly observable or measurable (it is a latent construct) and, therefore, tests need to be based on proxies for material deprivation.
Income is often used to test for additivity (see, for example, Guio and others, 2016; Notten and Kaplan, 2021). However, the use of income can be criticised, as discussed in Section 2.5.3, as a key motivation for developing and using direct measures of low living standards, such as material deprivation, is concern about flaws in income measures and differences in concepts. Halleröd (2006) notes that using income is a peculiar choice but it is usually the only accessible alternative and the notion that there should be a strong relationship between material deprivation and income is usually not questioned.
Guio and others (2017) highlight that one of the challenges of assessing additivity is that items with very small shares of people reporting that they lack them due to financial constraints lead to small sample sizes in most datasets. This results in imprecise estimates of additivity, making it difficult to accept or reject items based on these tests.
2.6. Simple absence versus financially constrained lack of necessities
Townsend (1979) simply measured whether or not individuals lacked items included in his summary index. This approach is called measuring simple absence and can be justified on the basis that as items are deemed to be necessities, individuals are deprived if they do not have them. Piachaud (1981) argued that judging deprivation on simple absence is wrong as it ignores the possibility that people may choose not to have such items. There is also a risk of misclassification of better-off households. For example, people may choose not to have carpets, a television or a car for a variety of reasons (they might have polished wood floors, prefer to listen to the radio and live in a city with good access to affordable public transport), and it would be wrong to classify these people as deprived. Piachaud made the case that it is important to distinguish between people who lack items because they cannot afford them (financially constrained lack) from people who lack items because they do not want them.
Piachaud’s persuasive argument is widely acknowledged to have led to the now common practice of only considering people to be materially deprived of an item if they indicate that they lack it because they cannot afford it. It has also been influential in terms of how material deprivation is defined. Mack and Lansley (1985, 39) in Poor Britain, part of the Breadline Britain series, define ‘poverty’ in terms of ‘an enforced lack of socially perceived necessities’. To establish enforced lack, it is now common for survey respondents to be asked why they lack any of the necessities included in a material deprivation measure. In the first Breadline Britain survey respondents were presented with a series of showcards, one for each of the 35 candidate necessities. They were asked to place the cards into one of four boxes, labelled: (1) Have and couldn’t do without, (2) Have and could do without, (3) Don’t have but don’t want, (4) Don’t have and can’t afford. This allowed the researchers to identify individuals who lacked necessities because they could not afford them. For the UK material deprivation measures, a representative adult in working-age households is asked: Do you (and your family/and your partner) have … [an item included in the measure]. They can respond:
-
We/I have this
-
We/I would like to have this but cannot afford this at the moment
-
We/I do not want/need this at the moment
-
(Does not apply)
In working-age households with children, parents are asked: Does your child have/do your children have … (an item included in the measure). They can respond:
-
Child(ren) has/have this
-
Child(ren) would like to have this but we cannot afford this at the moment
-
Child(ren) do not want/need this at the moment
-
(Does not apply)
For pensioners (adults who have reached State Pension Age), a wider list of options for why items might be lacking are provided and wider constraint is considered in the definition of material deprivation (more on this in Section 4.3).
For the EU deprivation measure, information is collected in EU-SILC. For each item, respondents are asked if they:
-
Have item
-
Do not have item because cannot afford it
-
Do not have item for any other reason
In both the UK and EU measures, respondents indicating that they do not have an item because they cannot afford it are considered to be deprived of that item. Exceptions are made for a limited number of items for which simple absence is considered to be sufficient to indicate material deprivation. Simple absence is used to determine deprivation status for three items in the current UK measures: being able to keep up with bills and regular debt repayments (child and working-age adult measures), outdoor space or facilities nearby where children can play safely (child measure) and being able to pay an unexpected expense of £200 (pensioner measure). In the EU measure, the simple absence criteria is used for: one week annual holiday away from home, able to face unexpected expenses, keep home adequately warm, able to avoid arrears, a meal with meat, chicken or fish every second day.
McKay (2004) expressed concern that asking survey respondents to indicate that they lack an item because they cannot afford it requires them to self-identify as poor and there is strong evidence that people are reluctant to do so. In addition, adaptive expectations (or adaptive preferences), where people adjust their expectations or preferences in light of changing economic circumstances and constraints, increases the tendency for people on low incomes to say that they do not want or need items deemed to be necessities. For example, people struggling to buy food or to afford to heat their homes in cold weather, might be more likely to say that they do not want or need an annual holiday away from home, or home contents insurance, or for their child(ren) to have a birthday party. There is, therefore, a risk that applying this criteria to estimating material deprivation will lead to misclassification and an underestimate of material deprivation. However, despite these concerns McKay and Collard (2004) recommended that, for the UK measure, information should be collected on whether people don’t have an item because they can’t afford it or because they don’t want or need it as this allows for measuring simple absence as well as financially constrained lack.
The three response category approach (have/can’t afford/don’t want) might also underestimate constrained lack due to the indirect impact of low living standards. For example, someone living in furnished rental accommodation might respond by saying that they do not want or need to replace worn out furniture as it is not their responsibility, but in reality they couldn’t afford to even if it was. However, they are not considered to be deprived of this item because they don’t report being without it because they cannot afford it.
The implicit assumption is that preference formation is independent of individuals’ economic situation (Halleröd, 2006, 387). However, expectations increase with income and decrease with the duration of poverty spells (Guio, 2009). Preferences adapt to economic circumstances, with preferences adapting to both poverty and wealth (Halleröd, 2006). The consequence of which is that people are more likely to report that they do not want things which are out of their reach. Shame can be another factor leading to a reluctance to admit that items are lacked because they are unaffordable. From a measurement perspective, one of the problems is that both age and poverty duration are associated with adaptive preferences; older people and people in long-term poverty are more likely to say they do not want or need items and, consequently, are less likely to be classified as deprived. This means that measurement error is not random and estimates will be biased.
McKnight (2013a) found not only an income gradient in European households going without items because they could not afford them (as you would expect), but also an income gradient in going without items ‘for another reason’. Overall, lower income households were more likely than higher income households to report that they went without necessities for a reason other than not being able to afford them. It could be the case that preferences vary across the income distribution but it would not make much sense to include in a material deprivation measure items which are less likely to be considered necessities by lower income households than higher income households. In fact, as discussed earlier, a key part of the analytical framework used to test which items to include in a measure looks specifically at validity in terms of discriminating between less advantaged and more advantaged. She also found evidence that the share of respondents reporting that they did not have items for a reason other than the fact that they could not afford them, increased after the 2007/2008 financial crisis as real incomes fell, suggesting that there was some evidence of adaptive expectations.
The relationship between reporting not wanting items deemed to be necessities and income, has been noted previously. Guio and others (2012, 34) outline three possible explanations for why such a relationship may be observed: (1) tastes and preferences can be different in low-income households due to differences in priorities, (2) the presence of adaptive preferences where individuals’ expectations tend to decrease with long-term poverty and social exclusion. The consequence of which is that individuals may report that they do not want things that they simply cannot afford, (3) shame at not being able to afford items results in individuals preferring to respond that they do not want these items rather than not being able to afford them.
Another potential problem arises when measuring child material deprivation based on responses given by parents, as parents may have different views to their children on whether an item is wanted or needed. A financially constrained parent may view certain child-related items as luxuries, or at least non-necessities, as they have other priorities (such as heating the home or paying household bills) even though the child may have wanted the item and feels deprived without it. Parents may also be reluctant to say that their children go without items because they cannot provide for them.
McKnight (2013b) found a strong income gradient in relation to parents responding that their children do not want or need many of the child-related items in the UK child material deprivation measure. Parents in lower income households were more likely to say that their children did not want or need: leisure or sports equipment, hobby or leisure activity, swimming once a month, have friends round for tea or snack fortnightly, and go on school trips.
2.7. Deprivation thresholds
Deprivation thresholds, used to determine who is materially deprived, are set in terms of the number of items which are lacked (simple absence or enforced lack) or by a deprivation score, which can be based on a simple count or a weighted sum. Although a case can be made for considering a person to be deprived if they lack any of the items included in a material deprivation measure as they have all been defined as necessities, generally thresholds are set at a number greater than one. The EU measure uses a threshold defined in terms of the number of items which are lacked due to financial constraints (a simple count threshold). The original EU measure set a threshold of lacking three items out of a possible nine items to determine who is materially deprived and a threshold of four items was used to define severe material deprivation. The revised EU measure sets the material deprivation threshold at five items out of a possible 13 items and seven items for severe material deprivation.
Where thresholds are set is somewhat arbitrary but can be informed by results from statistical models, such as Analysis of Variance (ANOVA) models, logistic regression models and discriminant analysis. The aim is to establish a threshold that statistically maximises the difference between ‘poor’ and ‘non-poor’ groups and minimises differences within these groups (Gordon and others, 2002). Notten and Kaplan (2021), in relation to their material deprivation measure for Canada, found that setting a more or less stringent deprivation threshold had a large effect on estimated rates of material deprivation (18.6% using a two-item threshold, 12.9% using a three-item threshold, 9.1% using a four-item threshold, out of a possible 17 items).
The advantage of using a deprivation score over a simple count measure is that items can be weighted. As discussed earlier, these weights can reflect prevalence or consensus. The usefulness of weighting varies between measures. Greater internal consistency of a scale decreases the need for weighting (Guio, 2009). The higher items are correlated (for example, measured by Cronbach’s Alpha), the more equal will be the size of the weights and the less impact weighting will have. Some experts have questioned the usefulness of prevalence weights (see, for example, Bailey, 2020).
One disadvantage of applying weights is that material deprivation status is less straightforward to communicate (less transparent) and can appear to have less meaning. Whether someone exceeds the threshold depends on the number of items they lack and the prevalence of these items. What it means to have a prevalence weighted score greater than a given threshold, say 25, is harder to understand than lacking a set number of items, say 5, from a list of items. This is because non-specialists can easily assess their own circumstances against the simple count measure but not a prevalence weighted score, as this would not be possible for them to compute. McKay (2008; 44) concludes: “The greater sophistication of the weighted approach delivers a final variable with many different values, rather than simple units, which may allow for finer distinctions between those facing, or not, different levels of material deprivation. The evidence to date, however, finds that the apparent sophistication of a weighted approach adds something, but not much, to measures based on simple sums, at least in terms of correlations with income and so on.”
2.8. Measures combining material deprivation with low income
A number of studies have highlighted a mismatch between poverty status determined by material deprivation and poverty status determined by a low-income threshold. Although people on lower incomes are more likely to be materially deprived than people on higher incomes, by no means are all people on lower incomes materially deprived and some on higher incomes are materially deprived. Notten and Kaplan (2021) found that 18.6 percent of Canadians were materially deprived (could not afford two or more necessities) but only 43% of the materially deprived also had a low-income. In addition, among Canadians on a low-income, only 50% were also classified as materially deprived. Perry (2002) also found significant mismatch between income poverty and material deprivation in New Zealand. Around half of those classified as materially deprived were found to be above a 60% median income poverty line and half of those whose income was below this poverty line were classified as materially deprived.
There are a number of reasons why such a mismatch might be found. These include measurement error in income, access to other financial resources (for example, savings), other financial constraints (for example, debts), atypical preferences, differences in financial capability and income dynamics. Research by Kotecha, Arthur and Coutinho (2013), based on a qualitative study in the UK, found evidence that although income levels do influence material circumstances, a wide range of other factors influence the extent to which pensioners living on relatively low incomes are materially deprived. McKay and Collard (2004), using data from the Families and Children Study, found a higher rate of imputation for missing income data among a low-income group who were not classified as materially deprived. In addition, people in the non-deprived group often had higher savings than those in the deprived group and were more likely to be owner-occupiers.
Income poverty dynamics can also be an important factor, with people in long-term income poverty more likely to be materially deprived (Berthoud, Bryan and Bardasi, 2004). Recent entrants to income poverty are likely to have a stock of durable goods which takes some time to need to be replaced or repaired and recent income poverty leavers can take the legacy of poverty with them, at least in the short-term. Berthoud, Bryan and Bardasi (2004) found that recent leavers from income poverty continued to have a higher risk of being deprived. When someone’s income increases, their deprivation reduces, but not enough to make them as well-off as someone who had had the higher level of income all along (Berthoud, Bryan and Bardasi, 2004, 6). They also found elevated risks of deprivation for people who cycled in and out of income poverty related to the number of years they were income poor.
As discussed in Section 2.5, Ringen argues that income is not a reliable measure of poverty defined in terms of low consumption. He illustrated this point through showing that not all members of the low-income group have consumption deprivation and people with consumption deprivation are not all in the low-income group (Ringen, 1988, 359). Despite Ringen’s reservations about income measures, he (tentatively) proposes a measure of general deprivation characterised by both a low standard of consumption and a low level of income: “If poverty means, in any sense, exclusion from one’s society, it must be visible in the way the poor live. This is covered by the criterion of low consumption. By including, in addition, the criterion of low income, we exclude from the poverty category those who have a low standard of consumption for reasons other than low income, for example, because of eccentric preferences. Also excluded are those who have a low income (as we are able to measure it) but still do not suffer deprivations in consumption because they have other sources of consumption (or because our income measure is inaccurate)” (Ringen, 1988, 361).
Callan, Nolan and Whelan (1993), drawing on Ringen (1988), proposed a measure for Ireland which combined deprivation with income: “exclusion is to be measured directly, together with an income criterion to exclude those who have a low standard of living for reasons other than low income” (Callan, Nolan and Whelan, 1993, 142). This was subsequently developed into a ‘consistent poverty’ measure for Ireland (Whelan, Nolan and Maître, 2006).
Combining income poverty with material deprivation is also a potential solution for dealing with a group of people who are more likely to be classified as materially deprived because they prioritise non-essential items over items deemed to be necessities and, as a result, are not able to afford necessities (Halleröd, 2006). This group may legitimately be materially deprived if they had the same set of preferences as the majority but excluding individuals who are not on a low-income reduces the possibility of counting better-off individuals from being classed as materially deprived due to differences in preferences.
The conclusion to a 2002 consultation on how to measure child poverty in the UK was that one of the official measures should include a deprivation measure: ‘deprivation measures resonate well with the public perception of poverty and the view that a poverty measure should encompass some idea of the practical effects that result from living in low-income’ (DWP, 2003, 13). Based on evidence that some people classified as materially deprived are not on a low-income, it was concluded that the measure should combine material deprivation with a low-income threshold. In deciding which income threshold to use, it was noted that although some households below a low income threshold of 60% of median income are not materially deprived, other households just above this threshold are materially deprived. Taking these factors into account it was decided that the measure should use a low income threshold of 70% median income (‘low-income and material deprivation’).
Callen and others (1993) also proposed a 70% income threshold for Ireland’s ‘consistent poverty’ measure on the basis of sensitivity tests using a number of low income thresholds (50%, 60% and 70% median) which found that the lower income thresholds did not differentiate better than the 70% threshold, although they recognised that the setting of any threshold was in some sense arbitrary.
A further UK child measure was added later using a lower income threshold set at 50% median income, referred to as ‘severe low-income and material deprivation’. In the three measures initially adopted to monitor progress towards meeting the Labour Government’s 1999 pledge to eradicate child poverty by 2020 and halve it by 2010, all measures used a measure of before housing costs income but a case can be made for using after housing costs income. After housing costs (AHC) income provides a better measure of the financial resources households have available to cover the cost of necessities. Although the target to eradicate child poverty by 2020 was initially enshrined in law (Child Poverty Act 2010), it was formally repealed in 2015 by the Conservative government. However, there remains a legal requirement to publish annual statistics on low-income and material deprivation for children (Welfare Reform and Work Act 2016) and the Department for Work and Pensions annually publishes statistics on material deprivation as part of the Households Below Average Income (HBAI) series.
Although a case has been made for combining material deprivation with low-income status, there are also some disadvantages. At the core of the development of deprivation measures (direct measures of poverty) is a concern about flaws in income-based measures (indirect measures of poverty). This is not just due to concerns about measurement error, although these are important, but because a focus on resources (inputs) fails to ascertain how standard of living is affected by differences in needs (for example, covering the extra costs of some disabilities) and other constraints which affect how inputs are converted into outcomes. It also calls into question the point of asking people whether they lack an item because they cannot afford it, which was largely introduced to exclude better-off individuals choosing to go without identified necessities, if a financial constraint is imposed by combining material deprivation status with a low-income threshold. It effectively means that respondents reporting that they lack items because they cannot afford them is not being taken at face-value. Given these concerns, it can be seen as rather contradictory to combine a material deprivation measure with a low-income measure. Some combined measures have been adopted (Ireland and the UK child and working-age measures) but this is not the case for all measures; notably the EU material deprivation measure which is based solely on social and material deprivation.
2.9. Whole population versus age-group specific measures
Some material deprivation measures have been designed to cover all age groups and can be thought of as universal measures, while other measures have been designed for specific age groups. Age-group specific measures have been developed to reflect how needs, necessities and preferences vary at different life stages. These differences can be incorporated into the measures through the selection of items, how constrained lack is defined (and measured) and the setting of deprivation thresholds.
Townsend (1979) took a ‘whole population’ approach but two of the items in his summary index had alternative versions for adults and children (aged 3 to 14 years). Mack and Lansley (1985, 51) acknowledged that perceived needs can vary between younger and older people and families with children, with the main differences expected to be between the elderly and others. However, with the exception of the telephone, which people felt was particularly important for older people, they found minimal differences in majority views on necessities between different groups, but there were differences in emphasis. For example, they found a greater than ten percentage point difference in the share who thought a washing machine, beds for everyone, three meals a day for children, toys for children, a garden, a television, a telephone, a dressing gown, having friends round and a car were necessities, between the 25 to 34 age group and the 65+ age group. A telephone (supported by 60% of the 65+ age group but only 35% of the 25 to 34 age group) was not included in Mack and Lansley’s final list of 26 socially perceived necessities as it did not gain majority support (43%). However, a number of child specific items were included (three meals a day for children, sufficient bedrooms for children, toys for children, leisure equipment for children).
The UK has tailored measures for working-age adults, children and pensioners (adults who have reached State Pension Age) (see Appendix 1). The original set of questions included in the 2004/2005 Family Resources Survey was designed to measure material deprivation among adults and children (although the main focus was on families with children), based on research by McKay and Collard (2004). But a review revealed that the measure did not work well for older people, particularly the oldest age group (McKay, 2008). There were concerns about the relevance of a number of the items for older people, some being prone to misunderstanding, and a reluctance among older people to say that they could not afford items which, together, led to underestimates of material deprivation in this age group (McKay, 2008; Berthoud and others, 2006, Dominy and Kempson, 2006).
Previous research had highlighted age-effects in adaptive preferences leading to older people being more likely to say that they do not want or need items which they lack (Halleröd, 2006, 378). The outcome of the review was a new set of tailored items for people over State Pension Age, and a new approach which avoided using a direct question on affordability (McKay, 2008). In addition, cognitive testing of survey questions found that it was better to start with a simple ‘yes/no’ question to ascertain which items older people have before moving onto establishing why any items were lacked (Legard, Gray and Blake, 2008).
For the EU measure, Guio, Gordon and Marlier (2012) recommended keeping a uniform list of necessities for all age groups although they accepted that some items would be less relevant for older age groups. The review of the EU measure found that higher shares of older people (aged 65 or older) reported ‘other reasons’ (non-financial reasons) for why they lack items (Guio and others, 2017; 26). This could be due to some items being less relevant, adaptive preferences or a greater reluctance to say that they could not afford items, but the revised EU measure continued to be applied to all age groups (at least initially). Guio and others (2018) developed and proposed an EU child deprivation measure containing 17 items (5 household level items and 12 child items) which has recently been adopted.
A problem with including items which are not relevant for particular groups of people is that they lower the risk of these groups being classified as materially deprived. This is because it means that a smaller number of items can contribute to a material deprivation score or count towards meeting a threshold. This issue can also apply to child-specific material deprivation measures which include age specific items.
Most child material deprivation measures are based on adult responses to questions included in social surveys. This approach assumes that parents are adequate representatives of children’s wants and needs (Main and Bradshaw, 2012, 504). In the UK measure for children, parents respond to questions on adult and household items in addition to child-specific items. It is parents who decide whether their child(ren) lack an item because they cannot afford it or because the child(ren) do not want or do not need it. Children may have a different view from their parents and this approach excludes children’s voices and perceptions (Main and Bradshaw, 2012, 505).
Main and Bradshaw (2012) developed a child-centric measure of material deprivation. Focus groups were used to inform the development of a set of 20 necessities and results from a pilot survey led to a deprivation scale containing 10 items (pocket money, saving money, branded trainers, iPod or similar, cable or satellite TV, garden or similar, access to family car, clothes to fit in, annual family holiday, monthly day trips). Children aged 8 to 16 years were asked in two surveys if they lacked any of these items. The results were used to produce estimates of child material deprivation. Main and Bradshaw’s research highlighted how focusing on poverty measures based on adult reports of household income or material deprivation provides only a partial picture. They found deprived children living in families which were not income poor and non-deprived children living in families which were income poor.
A measure which focuses solely on child-related items can underestimate deprivation if parents seek to protect their children from poverty by prioritising their children’s needs over their own. However, despite parents ensuring that their children have necessities, if they live in a household which lacks household-level or adult necessities, they can still be deprived. Research shows that children also try to protect their parents by hiding their feelings of deprivation despite experiencing distress and stigma resulting from poverty (Ridge, 2002). Children can say they don’t want or need items which they know their parents cannot afford, and their own expectations and preferences can adapt to their living standards.
2.10. The need for periodic updating
Inspecting the list of items Townsend included in his summary deprivation index more than 40 years on illustrates why it is essential to periodically review which items are considered to be necessities, as living standards, norms and needs change. Material deprivation is a relative measure and therefore contemporary living standards, tastes, preferences and needs should be reflected in the measure. The amenities for sole use included in Townsend’s summary index are now considered standard and so basic they are not included in contemporary measures (flush WC, sink or washbasin and cold water tap, fixed bath or shower, gas or electric cooker), although some renters will not have sole use of these amenities. Very few people today have a cooked breakfast most mornings and nor would they be considered deprived for not doing so. When Townsend devised his list, a personal computer, a broadband connection at home or a mobile phone would not have been available but today we might consider that people are deprived if they are not able to afford them. Labour-saving household goods (such as refrigerators and washing machines) in the 1980s were regarded by the majority of people as necessities; items which had been unknown in Victorian Britain and considered luxuries just two decades earlier (Mack and Lansley, 1985, 55).
The baskets of necessities included in the minimum income standard are periodically revised (rebased) to reflecting changing perceptions of the necessities required to meet minimum acceptable standards of living for different types of households. Annual updates alternate between rebasing items and incorporating price changes. Material deprivation measures such as the EU or UK measures are updated much less frequently. Not only is this because it is a large exercise but there is a trade-off between updating the items frequently and continuity. Frequent breaks in the series when items are updated mean that it is not possible to measure trends in material deprivation on a consistent basis. This loss of information has to be traded-off against including items in the scale which no longer reflect contemporary living standards. In the context of rising living standards, if the measure does not reflect contemporary standards of living it can appear that material deprivation is falling.
When the UK material deprivation measure was first introduced, the need for periodically updating the set of necessities included in the measure was acknowledged: “Perceptions of deprivation change over time in parallel with rising living standards, and so we will need to periodically re-assess the deprivation measure to ensure that it captures this evolution” (DWP, 2003, 12).
It is also worth considering how recent economic events might impact any updating exercise, particularly if revised measures are likely to remain in place for a fairly long period of time (a decade or more). Changing economic circumstances can affect perceptions of necessities and the share of people who say they are without an item because they don’t want or need rather than cannot afford. The 2007/2008 financial crisis, subsequent economic recession and austerity measures led to significant falls in living standards. A comparison of findings from the Poverty and Social Exclusion Surveys conducted in 1999 and 2012 suggests that people became ‘less generous’ in their views of minimum standards of living after the financial crisis (Fahmy, 2014, Gordon and others, 2013). This could be seen in terms of the falling shares of PSE survey respondents considering items as necessary (Fahmy, 2014). There were dramatic declines in support for home decoration, two pairs of all-weather shoes, regular savings, presents for family, and weekly money to spend on oneself (Fahmy, 2014, Gordon and others, 2013).
This review of the UK material deprivation measures follows the Covid-19 pandemic and it is fair to assume that the pandemic will have made people reconsider which items are really necessary for a minimum acceptable standard of living. There is also the backdrop of high and rising inflation (the, so-called, cost of living crisis) and this may also have made people re-evaluate necessities. Given the infrequent revisions to the items included in the measures, care must be taken not to ‘programme in’ less generous, temporary, views of what is required to meet a minimum acceptable standard of living in the UK.
2.11. Summary
Material deprivation is now a widely recognised concept and the measurement of material deprivation is well-established, offering a direct measure of poverty to complement indirect measures based on income. This review of existing evidence traces back how contemporary measures have been informed by the seminal work of Townsend (1979) which proposed basing a measure of relative deprivation on a selection of indicators (necessities). Piachaud (1981) highlighted the need to distinguish between simple absence, which can be due to choice, from financially constrained lack of necessities. Mack and Lansley (1985) established a method for identifying socially-perceived necessities and Gordon, Guio and colleagues (see, for example, Gordon and others, 2000, Guio and others, 2016) helped to establish an analytical framework for testing and improving the qualities of deprivation scales and the selection of items to include in a scale. Qualitative research has helped address the arbitrary nature of initial lists of candidate necessities and ensure that a small number of highly influential studies don’t dominate the development of new measures.
The evidence review has revealed concerns about the level of consensus for some necessities and how differences in preferences can lead to different risks of being defined as materially deprived. Moving from simple absence to financially constrained lack of necessities means that it is possible to take into account differences in tastes and preferences but asking people if they lack items because they cannot afford them requires people to self-identify as poor. A reluctance to do so will lead to underestimates of material deprivation. In addition, adaptive preferences mean that people are more likely to say that they don’t want or need items the longer they are in poverty, which will also lead to underestimates of deprivation.
Some poverty measures combine material deprivation with low-income status, with the combined measure excluding people who meet the threshold to be defined as materially deprived but are not estimated to be on a low-income. However, the combined measure rules out the possibility that these people may still be deprived due to additional needs or other constraints or as a result of measurement error in income. It also ignores the voice of respondents who indicate that they lack items because they cannot afford them and can be seen to contradict the basis for directly measuring low living standards.
The evidence reviewed highlighted the need to periodically update items included in a measure but also the need to understand how economic shocks can influence what people consider to be necessities, particularly for measures which are updated infrequently.
3. Qualitative research with focus groups and short-listing test items
This Chapter summarises the qualitative methods used, the analysis of the qualitative data collected in the focus groups, the criteria used for short-listing items and activities, and the short-listed items and activities. The Chapter covers:
-
focus group methods, details of the sample and ethical considerations
-
findings in relation to an initial long-list of 103 items and activities which were identified prior to the focus groups and classified by ten main categories: (1) Financial security, (2) Food, (3) Clothing, (4) Health, (5) Communications, (6) Mobility, (7) Home and living conditions, (8) Social and leisure activities, (9) Things for oneself, (10) Items and activities related to children
-
findings from the focus groups are summarised and it is shown how these findings were combined with information from other sources and the selection criteria used to short-list candidate items and activities.
3.1. Focus group methods
Updating the items and activities included in any deprivation measure requires an understanding of contemporary public perceptions of necessities in a society. To capture these views, consultative and deliberative methods involving focus groups have been employed in the UK and in the rest of Europe (Chapter 2). While consultation could simply involve asking people whether or not they agree with a selection of items, deliberation involves the group engaging in a wider-ranging discussion with greater input from participants and more opportunities for contributing to the research.
Because this exercise seeks to reflect public perceptions of necessities, not just the perceptions of people with direct experience of deprivation, people from a range of income groups were recruited to take part in a series of focus groups. This is in line with the MIS methodology, which also uses mixed-income groups (Davies and others, 2015). Whether or not the same items and activities should be used to measure deprivation for different demographic groups (children, working-age adults and pensioners) is a key question for this research. For this reason some specific demographic groups and some mixed demographic groups were planned, to allow us to explore possible variation, but also commonalities, in preferences, needs and constraints across the life cycle and across household types.
For adult participants, eight focus groups were conducted using online video conferencing software, with each focus group lasting up to two hours. The focus groups comprised one group of working-age adults with no dependent children, two groups of working-age adults with children, two groups of pensioners, and three mixed demographic groups. Three further mixed demographic focus groups were organised to test a set of proposed survey questions related to a short-list of necessities, each of these focus groups lasted up to one hour. In addition, three focus groups were conducted with young people aged between 12 and 18 years. Previous research has shown that children’s direct experience of deprivation differs from that of adults (Main and Bradshaw, 2012, Ridge, 2011) and young people can have a different view from their parents on which items and activities are necessities.
In advance of the focus group sessions an initial long-list of items and activities was prepared. This list was informed by an assessment of 252 items and activities drawn from various sources. These included: the existing UK material deprivation measures with questions included in the FRS; items and activities included in the EU measure with questions included in EU-SILC (both based on EU-SILC 2009 and Guio and others (2016, 2017)), material deprivation items and activities included in the Poverty and Social Exclusion surveys (1999 and 2012), items included in the MIS (2020), items and activities included in the Equality Measurement Framework (Alkire and others, 2009) and the Multidimensional Inequality Framework (McKnight and others, 2019). In addition, findings from a rapid evidence review and suggestions made by the project’s Steering Group were taken on board. From this initial long-list, 103 items and activities were selected by the research team to inform discussions within the focus groups. These can be classified into ten main categories:
- financial security
- food
- clothing
- health
- communications
- mobility
- home and living conditions
- social and leisure activities
- things for oneself
- items and activities related to children
The definition of material deprivation itself was not the main focus of the discussions but it was vital that focus group participants were clear about this key concept. The working definition used in the project considers material deprivation as relating not just to lacking certain goods but also being unable to participate in a range of activities. Before discussing items and activities within the ten categories, each focus group was introduced to the concept of necessities: things and activities that are typical in the UK today and are necessary for an acceptable standard of living. These items and activities should have a monetary value and everyone should have or be able to afford them and no one should have to go without due to lack of money. Figure 3.1 was used as a visual aid to help focus group participants understand the position of material deprivation in the context of living standards. It distinguishes material deprivation from destitution – lacking what is needed to survive – from living comfortably – which includes satisfying ‘wants’ as well as ‘needs’. This distinction was discussed with participants, giving them a chance to articulate whether this definition resonated with their understanding of the concept and whether they had any questions or doubts. It was found that participants grasped the concept readily and during the focus groups, some referred back to the distinction between deprivation and destitution, on the one hand, or acceptable versus luxury standard of living on the other.
Figure 3.1: Illustrating the position of material deprivation on a standard of living scale
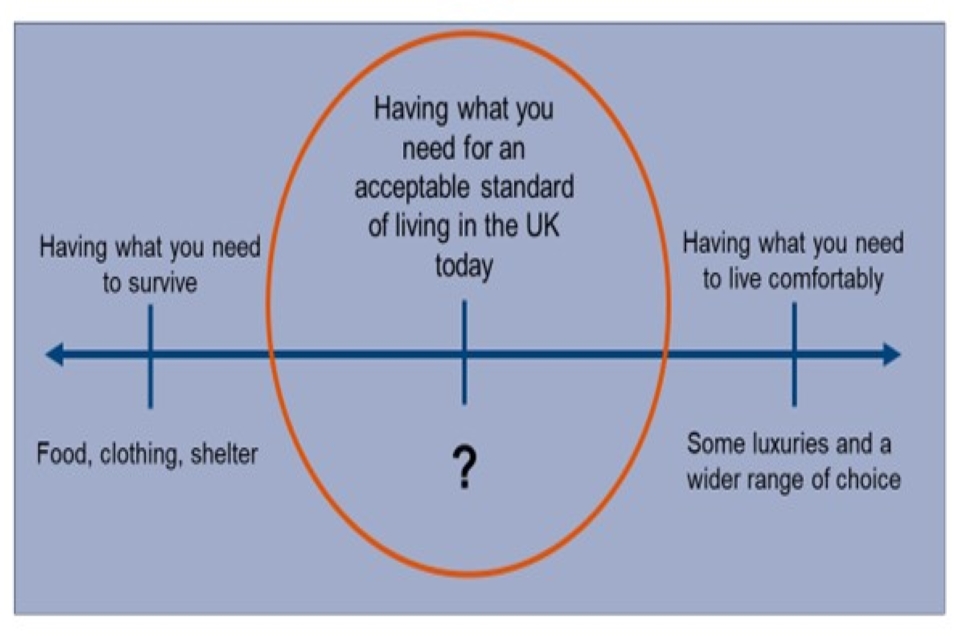
Source: prepared by the authors
Following this discussion, each focus group was structured around a series of polls covering items and activities included within the ten categories. Focus group participants were invited to indicate which items (if any) included in a poll they thought were necessities which people should be able to afford for an acceptable standard of living in the UK today. Results from the polls were then shared and used as a starting point for in-depth discussions. 5 or 6 polls were used as prompts during each focus group session. To avoid the potential for fatigue to influence the detail of discussion for categories covered towards the end of focus group sessions, or for quieter members to gain confidence and engage more in discussions happening further into these sessions, the order in which categories were discussed was changed between focus groups. It was not possible to cover all categories in each of the focus groups but each category was covered a minimum of five times. The polls and wording used to describe items and activities evolved as the fieldwork progressed and clear patterns arose, with some items omitted where a clear consensus emerged. The polls also allowed the research team to probe the wording of potential survey questions which could be included in the FRS.
Participants were encouraged to articulate how they understood the meaning of questions and prompted to make suggestions for improving the clarity of the wording. The full list of items used in the polls can be found in Appendix 2. Throughout the focus groups, participants were also asked to make additional suggestions for items or activities which they felt were necessities but had not been included in any of the polls.
It was made clear to participants that the aim was not to establish a consensus on which items and activities should be regarded as necessities, as the research team was interested in hearing a variety of opinions and that there was no right or wrong opinion.
Focus group participants were also advised that the focus of the discussion was not on how or why people could or could not afford certain things, nor on what should be done (for example, by the government) to ensure that everyone gets everything that they need, but solely on whether people should be able to afford these items and activities if they are to have an acceptable standard of living in the UK today. At the end of each focus group, participants were invited to reflect on the definition of material deprivation introduced at the start, and consider whether and how the subsequent discussion had changed their understanding of the concept.
3.1. Focus group sample
Overall, 49 adults and 12 young people took part in the focus groups. A summary of the sample characteristics can be found in Table 3.1. Participants were recruited by a social survey organisation from across the four UK nations, with Wales over-represented largely because one mixed-demographic group comprised Welsh participants allowing for the use of the Welsh language. Besides income level, which was based on self-reported annual household income, a range of characteristics (for example, ethnicity, disability status) were also considered in recruiting the sample to ensure a range of different views and experiences could be covered.
Table 3.1: Demographic characteristics of focus group participants
| Adults | Young people | Total | |||
|---|---|---|---|---|---|
| Total number of participants | 49 | 12 | 61 | ||
| Gender | Female | 60% (29) | Female | 41% (5) | 56% (34) |
| Gender | Male | 40% (20) | Male | 59% (7) | 44% (27) |
| Ethnicity | Ethnic minority background | 14% (7) | Ethnic minority background | 16% (2) | 15% (9) |
| Nationality | English | 65% (32) | English | 75% (9) | 67% (41) |
| Nationality | Scottish | 8% (4) | Scottish | 16% (2) | 10% (6) |
| Nationality | Welsh | 24% (12) | Welsh | 0 | 20% (12) |
| Nationality | Northern Irish | 2% (1) | Northern Irish | 8% (1) | 3% (2) |
| Lower income | Below £20,000 | 10% (5) | Below £20,000 | 16% (2) | 11% (7) |
| Lower income | £20,000 to £25,000 | 6% (3) | £20,000 to £25,000 | 16% (2) | 8% (5) |
| Age | Over 65 | 29% (14) | 12 to 15 years old | 67% (8) | - |
| Age | 16 to 18 years old | 33% (4) | |||
| Disability | Considered themselves disabled | 10% (5) | Considered themselves disabled | n/a | - |
| Household type | Dependent children in the household | 37% (18) | Living in a family with 3 + children | 41% (5) | - |
3.2. Ethical considerations
As some of the research involved participants under the age of 16, a group considered vulnerable, a full ethics review of the proposed research and methods by the LSE Research Ethics Committee was undertaken and approval was given.
Information about the research and the aims of the focus groups were provided to potential participants by the social survey recruitment organisation. Upon confirming a decision to participate, participants received further information about the research and contact details of the lead focus group researcher to enable them to ask any questions prior to attending a group session. Participants were informed they could withdraw at any point. Prior to the focus group sessions, agreement to participate forms were circulated, explaining participants’ rights and how data would be stored and processed. Participants were asked to complete and return these forms prior to attending the focus group. At the beginning of each focus group, facilitators checked that all participants had returned their forms and participants were given a further opportunity to raise questions.
Incentives were used to aid recruitment and presented as a ‘token of thanks’ which participants received via the recruiter. They could choose between an e-voucher, bank transfer or charity donation. Participants were informed they would receive a ‘token of thanks’ even if they decided to withdraw during a focus group session.
As the association of the research with the Department for Work and Pensions (DWP) could have led some participants to believe they were compelled to take part or under pressure to participate (for example, if they were in receipt of social security benefits), all material provided reassurance that neither participation nor non-participation would have any bearing on participants’ dealings with DWP or any other government agencies. The independence of the research and the research team was stressed and participants were reassured that at no point would their details be shared with anyone outside the research team.
Young people were recruited from a pool of 55,000 children whose parents had given consent to the recruiter for them be offered this type of research. Young people themselves were then asked to agree to participate using a specially adapted form which was designed to make information about the research accessible to a younger age group. A potential issue in involving young people in research which offers financial incentives to participate concerns possible parental pressure on children to participate. At the start of the focus groups with young people, researchers stressed that participation was the young person’s own decision and that it was possible to withdraw at any point without it affecting receipt of the ‘token of thanks’.
The researcher leading the young people’s focus groups had an Enhanced Disclosure and Barring Service (DBS) certificate, and other members of the team also had prior experience in conducting qualitative research with this age group. Researchers worked to ensure inclusive facilitation so that participants could engage in the discussion and voice their opinions comfortably and freely. Focus groups can avoid some of the power imbalances that may develop between an adult researcher and a young person in a one-on-one interview, but this depends on the focus group successfully creating a safe peer environment for young people.
In line with data security protocols, personal information was stored on a secure server accessible only to the project team. Transcripts were anonymised to ensure participants could not be identified either directly or indirectly. Recruitment criteria were not shared with participants and no reference was made to these criteria during the course of the focus groups.
Reflecting on items which can be deemed necessities in the UK today for an acceptable standard of living in a group session may cause unease among some participants. This is because it involves discussing with others items deemed by some to be “necessities” which participants may lack. To mitigate the risk of this, in advance of participating participants were provided with information about the aims of the research and a list of the items likely to be discussed. It was explained to participants that they were not going to be asked whether they owned these items nor would they be asked to disclose any experience they would not feel comfortable sharing. Participants were also informed that they could decide not to take part in a poll if they felt uncomfortable doing so. This was reiterated during the focus groups, together with a set of ground rules inviting participants to respect differences of opinion. As the method chosen involved mixed-income groups, adhering to these rules was important to ensure participants on low incomes were not made to feel uncomfortable. In the event, it was found that participants were comfortable to volunteer observations based on their own experiences, some of which included deprivation and exclusion, especially in childhood but also as adults. Finally, after the focus groups, participants were sent links to information sources on support with debt, benefits advice and mental health.
3.3. Criteria used to short-list items and activities
A lead researcher was supported by a second researcher in each focus group. A short debrief took place after each focus group and at least one researcher prepared a brief write-up shortly afterwards. Analysis of the first focus group was conducted immediately to ensure any issues with the topic guide could be addressed for subsequent groups. Polling results were recorded and audio recordings transcribed. Given time constraints, analysis focused on insights for the development of an initial longer-list of items and activities, to inform a short-list which would be tested in the FRS. In particular, the analysis took into consideration any emerging consensus across groups, any issues arising in relation to the wording of items and associated survey questions and the relationship between items and activities. The data were analysed through thematic analysis, albeit rapidly due to time constraints, to explore cross-cutting emerging themes. Indexing and coding key ideas emerging from the focus groups took place as an iterative process of constant comparison, in an exercise that saw the involvement of the whole research team, to increase transparency and reliability and safeguard against risks of selective interpretation.
After the focus groups were completed, a research team member took responsibility for one of the following four groups: households, working-age adults, pensioners, children. Using an agreed set of criteria, the lead researcher for each group rated the initial long-list of items and activities and developed an initial short-list of items and activities, aiming to identify around ten necessities for each group. The criteria for selection was based on:
-
focus group poll ratings
-
qualitative data collected in the focus groups
-
information from existing sources on % agreeing item or activity a necessities
-
existing evidence on prevalence of items and activities
-
whether variation in taste is likely to affect views on whether an item or activity is a necessity
-
whether an item or activity is likely to be specialist for a particular sub-group of the population
-
whether an item or activity (or similar) is included in one of the existing UK material deprivation measures
-
whether items or activities were high or low value in terms of cost
-
the relationship to other short-listed items or activities
-
other relevant existing evidence from the rapid evidence review
Initial short-lists for the four groups were circulated within the research team. Each team member then voted on the other short-lists and the team held a series of long meetings to discuss each group in turn, reviewing the voting results and selection criteria. This process led to agreed short-lists for the four groups which were then jointly reviewed to produce final short-lists. There was a limit to how many items could be short-listed and ultimately tested in the FRS (this was set in terms of a maximum time limit for the FRS test question module). This meant that hard decisions had to be made about which items to include in the short-list.
3.4. Challenges and limitations
At planning stage, the research aimed to recruit 63 adults and 8 to 10 young people. Despite partnering with a well-established social survey recruiter, only 49 adults and 2 young people took part in the qualitative work within the tight fieldwork period required to inform the development of the FRS test questions[footnote 2]. This was due to a conversion rate from agreeing to participate to actual participation being lower than the social survey recruiter had predicted. Because the time available for this stage of the research was tight[footnote 3], it was not possible to extend the fieldwork period prior to developing the final short-list of FRS test questions. For adults, the team was satisfied with the information collected and saw clear patterns and consensus emerging around certain items and activities despite the number of participants being lower than planned. For young people, two further focus groups were organised. The research team judged that gaining greater insights into the views and perspectives of this age group would still be valuable at a later stage of the research. Understanding which items and activities are considered necessities by this age group could be taken into consideration when deciding upon the final set of recommended items and activities in the revised material deprivation measures.
A limitation of conducting focus groups online is the under-representation of the digitally-excluded. Particular effort was made to capture insights on digital exclusion as a form of deprivation in the evidence review, and to give space to discussion of digital exclusion in the focus group topic guides. There are different levels at which digital exclusion can manifest itself, from lack of access to devices and data poverty, including limitations in terms of the number and type of devices and connectivity available, to lack of skills, confidence and disparities in use (Scheerder, van Deursen and van Dijk, 2017, van Deursen and van Dijk, 2019). This makes digital exclusion a complex and multifaceted phenomenon, and while those at present experiencing deprivation in terms of access will be hard to reach given the methods of the research, online focus groups can still illuminate the past and present experiences of participants, and people known to them.
3.5. Findings from the focus groups
This section outlines the insights gained from the focus groups across the ten main categories, connecting these to proposed test questions for inclusion in the FRS. Beyond helping with the development of the questions, the qualitative research also highlighted some cross-cutting findings. These cross-cutting findings are discussed first before the findings for each of the ten main categories and the items and activities which were short-listed within each of these categories.
3.5.1. Cross-cutting findings
‘Necessities’, framing and adaptation
Firstly, as noted at the start of this chapter, the definition of material deprivation was discussed and appeared seemingly intuitive across all focus groups. However, throughout the discussions, the concepts that underpinned participants’ judgements and the way in which they framed their answers revealed some ambiguity. The very framing of items and activities discussed as ‘necessities’ often led to participants thinking about whether ‘they could do without’ them and drew on previous experiences of ‘having done without’. This often resulted in judgements that considered necessities primarily as those things that are needed to survive, like food, basic clothing and shelter, shifting the focus on destitution rather than material deprivation.
The issue of how people interpret the term ‘necessity’ is discussed in the literature on consensual methods used in relation to poverty and material deprivation (Fahmy and others, 2015). This literature stresses the ambiguity of the concept of ‘necessity’, which researchers in this field often associate with those items which ‘no-one should have to do without’ or that ‘everyone should be able to afford’, while participants often adopt a more restrictive interpretation of need, referring to items and activities people ‘simply cannot live without’. This difference could also be seen in relation to items some judged no one should have to do without but that others thought so many people, often including themselves, were doing without and hence could not be necessities. This was reflected in remarks around experiences such as ‘not having money worries at the end of every week or every month’. While many participants considered this a necessity because of its negative impact on wellbeing and mental health, others considered this unrealistic based on their own experiences. Similarly, while many thought that savings were important to cope with possible financial shocks, the idea of having enough money left over to put into savings was considered by many unrealistic and hardly possible to achieve, making them judge the item as ‘not a necessity’.
This suggests, in line with what is consistently found in the literature, there is a degree of adaptation, by which people who experience disadvantage often tailor their expectations and discount their own experiences of deprivation (Flaherty, 2008). This phenomenon of adaptation could be seen at work in relation to a number of items some participants had done without: from adequate flooring, to central heating, holidays or savings.
Different group dynamics emerged. In some focus groups when a participant shared experiences of having done without a certain item, others in the group appeared inclined not to argue for such item to be considered a necessity. This was possibly because it would associate the experience shared with deprivation. In other groups, however, people appeared more comfortable in sustaining opposing views.
It was also clear that people did find the initial discussion on the definition of material deprivation helpful and some referred to this throughout the focus group. For example, when some participants discounted particular items as necessities based on their reasoning ‘that many do without’, others refocused the discussion on Review of UK Material Deprivation Measures 61 whether having to do without would make for an ‘acceptable standard of living’.
Others pointed to how, while it was possible to do without items such as ‘a table and chairs’, having these items could not be considered a luxury. At the same time, contrasting ‘luxuries’ and ‘needs’ sometimes led people to consider necessities items and activities which they saw required little to no expenditure (for example, access to outdoor space or facilities for children, visiting friends, going out socially (such as meeting in a park)). As participants judged that there were ways of obtaining these items which were ‘inexpensive’ or even free, they were more inclined to consider them as necessities. This can create tensions with the definition of material deprivation, since it explicitly relates to items and activities with a monetary value and insufficient resources as the reason for lacking them. In these instances, the focus group facilitators steered the conversation back to reflecting on whether these items were necessary for an acceptable standard of living and the need to consider items and activities which incur expenditure.
Overall, it was clear that a certain level of ambiguity in the term ‘necessity’ led some participants to drift towards more severe forms of deprivation close to destitution, while others navigated the discussions thinking of the contrast between ‘having what is necessary for an adequate standard of living’ and ‘living comfortably’. Some declared themselves surprised, reflecting at the end of the discussion, of how many things they “actually considered necessities, beyond basic ones related to food, clothing, and shelter”.
The influence of the Covid-19 pandemic
The qualitative research was undertaken at a time when people were slowly getting back to activities which have been radically disrupted by the Covid-19 pandemic and subsequent policy responses. The changes to people’s lives imposed by the crisis had led people to appreciate some items such as access to green spaces, which have made a difference for people’s wellbeing during lockdowns. Missing normal social interactions led participants to value items linked to visiting friends and family, while habits developed during this time meant that many participants mentioned that going out socially could simply entail going to parks or meeting outdoors. At the same time, having ‘done without’ certain items and activities such as holidays or professional haircuts, meant that several participants considered these as luxuries. In relation to holidays, they often saw these as necessary only if associated with visiting family (disliking the existing definition in the UK measure which only counts holidays that don’t involve staying with family). Items linked to information and communication technologies (ICT) emerged as a clear priority. While people noted that this was a trend already in place before the pandemic, due to how closely linked ICT is for people’s work or education, they also reflected on how the pandemic had accelerated their reliance on the internet for a whole range of activities, including social activities, shopping and access to online services.
‘Cultural shifts’
In relation to some items and activities participants spoke of what they thought were cultural shifts. An example was in relation to second-hand clothing, for which some participants expressed a preference for environmental reasons even if they could afford to buy new clothes, to reduce waste and landfill. They remarked that there was increasing societal recognition of the importance of reducing waste, and that good quality clothing could easily be found in charity shops. For other home items, they noted that there are now online platforms, including on social media, where “people are constantly giving things away” and that this is a good and less expensive option instead of buying new items.
People also often cited health as a key reason to consider certain things as necessities. They noted that awareness of the importance of a healthy life-style is greater today than in the past, something that was reflected in attitudes towards eating healthily. They also remarked on growing awareness of the importance of mental health and this was reflected in attributing importance to items that bear this. For example, concerns with mental health led participants to consider as priorities items that protected people from indebtedness and financial insecurity, as well as items that allowed people to feel comfortable in their living conditions.
Generational shifts emerged too, as older participants consistently expressed that in the past it had been acceptable to just heat the main living room but today this is not the case. Participants also remarked that the widespread use of central heating has changed norms around keeping the whole house at a comfortable temperature, at least between certain hours.
3.5.2. Food
Food items included in the polls were widely considered necessities, and even when not included in the list of items discussed, participants mentioned food security as necessary for an acceptable standard of living. Participants didn’t make distinctions between people living in the same household, noting that everyone should be able to afford three meals a day, with some noting that “it’s an essential human right, really, to have three meals a day, that is a minimum”. There was consensus across age groups and in all focus groups but one, 100% of participants thought three meals a day was a necessity. These meals need not all be ‘filling’, with participants noting that one filling meal could be preceded by ‘a bowl of porridge for breakfast and a sandwich for lunch’ and this would be enough for an acceptable standard of living.
There was also widespread agreement that everyone should be able to afford fresh fruit and vegetables every day, and that “if you can’t afford to eat fruit and vegetables, then you’re in serious trouble”. People also noted that these items can be quite expensive, especially when compared to less nutritious and healthy food.
The wording of some food items used in other material deprivation measures – for instance, related to having a meal including protein in the form of meat, chicken, fish or vegetarian equivalent every second day (included in the EU measure) – created some confusion with participants. For example, how a plant-based diet would meet this criteria. Overall, this item did not find similar levels of support as three meals a day and daily fresh fruit and vegetables. Similarly, ‘eating the food that you would like to eat or that is culturally important to you’ did not attract much support, and even when the item was rephrased to just include ‘food that is culturally important to you’, less than half of all participants in focus groups this item was discussed considered this a necessity.
Participants were very clear that being able to feed one’s family without the need to visit a foodbank or rely on friends and extended family was an absolute minimum for an acceptable standard of living. They considered that “it’s very embarrassing and humiliating and demoralising to have to do that”, noting that this is the case for both using foodbanks and having to rely on friends. In both cases, they thought this was akin to “begging” and that it entailed a sense of humiliation, of “feeling like you failed your family”, and that especially for a parent “that is the worst thing you could experience”. In relation to foodbanks, they also noted that visiting foodbanks, as opposed to receiving a foodbank parcel at home, is especially damaging because of the shame attached to this. This item was not included in the final short-list of items. The FRS includes a separate section on food insecurity, and it was judged that this item was more appropriately subsumed under ‘destitution’ rather than ‘deprivation’.
Existing items or activities included in UK material deprivation measures:
- at least one filling meal a day (pensioner measure)
- fresh fruit and/or vegetables every day (child measure)
Short-listed items or activities:
- three meals a day
- fresh fruit and/or vegetables every day
3.5.3. Clothing
Clothing was also considered a basic necessity and lacking adequate clothing was associated with severe deprivation. Items such as a ‘warm waterproof coat’ were considered a necessity by all participants. Both this item and ‘two pairs of shoes’ were eventually excluded from the final short-list of items, in light of analysis of the current UK measures which shows that only 1-in-1000 of the cases identified as materially deprived in 2017/2018 would be missed by dropping the ‘warm coat’ item from the child material deprivation measure (Bailey, 2020). It was thus judged that these items, which are likely to be at the more severe end of the material deprivation spectrum, could be omitted without any loss of information.
Participants generally did not consider ‘replacing worn out clothes with new, not second-hand, clothes’ and ‘having clothes for special occasions’ necessities. In relation to the former, while reliance on charity for food was deemed damaging for people’s self-worth and self-esteem, making use of clothing provided by charitable sources was not seen as shameful. Indeed, across a number of focus groups several people expressed that second-hand clothes were more ethical and not necessarily linked to lack of material resources. Good quality second-hand clothing was thus considered acceptable for an adequate standard of living. In relation to clothing for special occasions, people noted that “there is much pressure from society to turn out to some events and look a certain way, but it is not really necessary”. As for other items discussed below, participants recognised societal pressure but thought this unjustified and felt strongly that it should be resisted.
Societal expectations around appropriate clothing for job interviews or work were instead considered legitimate, at least in the sense that it is necessary for people not to be penalised in the labour market. While some noted that “in an ideal world it shouldn’t matter” and it should not affect your chances to get a job, some noted that “it is a way to show that you take the job seriously” and mentioned that Jobcentres provided advice which specifically emphasised the importance of dressing appropriately for job interviews. Others noted that “you don’t need fancy clothes, you just need to look smart enough” and that second-hand clothes were acceptable.
Existing items or activities included in UK material deprivation measures:
- warm waterproof coat (pensioner measure)
- warm winter coat (child measure)
Short-listed items or activities:
- appropriate clothes for work or job interview (if working-age)
3.5.4. Financial security
It was unanimously agreed that keeping up with bills (for example, electricity, gas, Council Tax) and avoiding mortgage and rent arrears without cutting back on other essentials, was a necessity. Participants thought that failing to do so would push people into destitution, putting them at risk of eviction and having a “knock-on effect on everything else”.
Access to banking services was also widely regarded as a necessity across focus groups. Participants noted “that people can’t function without a bank account” especially as the use of cash is progressively limited. They shared their experiences on how banking had changed, how digitalisation and the closure of physical bank branches had posed challenges. People had learnt to use online banking, but not all felt comfortable about this. Participants noted that knowing how to navigate this new, online world of banking services could lead the savviest to secure good deals but put others at a disadvantage.
Other items, such as home contents insurance and pensions, were considered necessities by many but participants also noted that the need attached to these may not be widely understood. For example, the need for home contents insurance “becomes clear when you actually need it” and pensions are “something that people realise is essential only as they grow older”. Participants thought these are things that “take a backseat when you are focused on providing other essentials”.
Some items elicited illuminating discussions across focus groups. Many participants thought that having “regular savings for rainy days” could not be considered a necessity, in part because the expression “rainy days” didn’t suggest money allocated to necessities, and in part because they thought that having savings is “not something that many people can have – it is a luxury really, given how many [people] on low salaries can reasonably save anything at the end of the month”. At the same time, several participants were very knowledgeable and their experiences with financial advice services prompted them to see “emergency funds” and “having three to six months of income saved” as good practice. There was more support for the idea that the ability to cope with unexpected expenses is essential and there was agreement that one should not have to rely on taking out a loan or falling into debt to cover unexpected expenses. These reflections informed the final wording of this item “having money aside to cover unexpected expenses”. Participants were clear that no exact value should be attached to this, because of the wide range of possible essential expenses to cover as well as the changing circumstances that allowed people to put anything aside.
The item ‘making minimum payments on your credit card to avoid extra charges’ prompted in-depth discussions about debt. Some were unsure about how credit cards work (for example, distinguishing between extra charges and interest), and many saw ‘minimum payments’ as problematic as people “need to pay off more than the minimum or you get deeper into debt”. There was more agreement around the rephrasing of the item to include making ‘more than minimum payments’ but, at the same time, participants noted that it was not realistic to require to pay off all credit card debt every month or that frequently. Most saw having a credit card in itself not a necessity, while some noted that “a credit card helps with your credit score if you want a mortgage”. Often participants noted that “if you can’t afford it, you should not have it” but also that for those on low-income sometimes getting into debt was the only choice, which they saw bearing the risk of a vicious cycle because high-interest products are often the only option available to those with financial difficulties.
Related to these discussions, people debated whether ‘not having money worries at the end of every week or every month’ could be considered a necessity. For some, this seemed simply unrealistic, “impossible to achieve”, “that this is a normal part of life”. Others noted that the reasons people have money worries matter, as “many rich people may have money worries too”, but these may relate to acquiring luxury goods. However, several participants were adamant that it should be considered a necessity because of the impact on mental wellbeing, which they noted could be especially problematic over a prolonged period of time. Participants also carefully considered the wording. A few remarked that people are paid sometimes monthly sometimes weekly or bi-weekly, most however agreed that the majority of large expenses are born monthly, which was eventually reflected in the final formulation of the item wording.
Existing items or activities included in UK material deprivation measures:
- regular savings of £10 a month or more for rainy days or retirement (working age and child measures)
- household contents insurance (working age and child measures)
- keep up with bills and regular debt repayments (working age and child measures)
- able to pay regular bills like electricity, gas or Council Tax (Rates in Northern Ireland), without cutting back on essentials (pensioner measure)
- able to pay an unexpected expense of £200 (pensioner measure)
Short-listed items or activities:
- keep up with regular bills like rent, mortgage, electricity or Council Tax/Rates without cutting back on essentials
- have money aside to cover unexpected expenses
- access to banking services
- home contents insurance
- not have money worries at the end of the month
- regular payments to a workplace or private pension (if working-age)
3.5.5. Health
As noted earlier, impact on health was a key reason why participants considered certain items as necessities. It is thus not surprising that many of the items specifically related to health found strong support across participants in being considered necessities. Dental treatments (including dental charges for check-ups and consultations) and optician consultations (covering charges for eye tests, glasses/contact lenses if needed) emerged as the most highly-rated, with all participants across focus groups agreeing these items are necessities. Participants especially remarked that dental costs were increasingly a concern and accessing timely dental care could prove a struggle. The increasing need to rely on private dental services was seen as unfair and problematic because of the high costs involved (“I don’t know how private dentists can sleep at night!”).
Some items were highly rated but recognised as too vaguely phrased and open to subjective interpretation. This was the case for ‘buying or doing what you feel is necessary to keep yourself healthy in body and mind’. People largely considered this a necessity and remarked on the importance of considering both mental and physical health but also recognised the wording as leading and noted that it could apply to too wide a range of possible things people may consider necessary.
Some specialist items were also discussed, such as podiatry, but support was mixed. Participants remarked that the inclusion of these services was puzzling in face of others which were not included, such as physiotherapists or hearing specialists. They also noted that attaching a specific time-frame for accessing these services (‘every two months’) was unhelpful as some people may require greater frequency while others may not require these at all.
Items related to care were also discussed, including “help in the home with personal care, if needed” and “occasionally have a break for a few days from caring responsibilities”. Participants noted that the expression “if needed” already entailed a sense of necessity, making the question somewhat leading, but also possibly too specific. This was not unlike items that were ultimately judged too specific (for example, grab rails and wheelchair ramps) even though highly necessary for the portion of the population they are relevant to. Some participants suggested that this item should be considered in the future as privately funded personal care at home “is going to become a major issue in the next 50 years”, linking this to a perceived lack of alternatives as services offered in care homes were described as “under-funded and under-staffed”. The item referring to breaks from caring responsibility was not highly rated in the polls. Despite this, some participants recognised the heavy toll that caring responsibilities take on personal wellbeing. They referred to their own circumstances, mentioning having to take care of elderly relatives, and emphasised the constant worry and stress that they experienced.
The lowest rated items were gym membership and sportswear, which nearly all participants did not consider necessities. For many, these were outright luxuries, despite recognising that keeping fit and exercising is an important aspect of looking after one’s health. People thought that this did not require a costly gym membership, nor special clothing. Some remarked that the pandemic had pushed many to exercise at home or outdoors, making these items stand out as unnecessary.
Finally, some items had strong support but were ultimately excluded from the final short-list of items based on the fact that they were likely to apply to just a small number of individuals and capture particularly severe deprivation. This was the case for over the counter medicines such as painkillers, with around two thirds of participants noting that these are necessities, with some remarking their importance because “you need to try and fix yourself first before using the health service”. The cost of many of these items, such as paracetamol, is so low that not being able to afford them is more closely associated with destitution than material deprivation. Agreement was even stronger for prescription medicines, in relation to which participants also discussed differences between UK nations, as prescription charges have been abolished in Wales, Scotland and Northern Ireland. Sanitary products also had near universal support, with some participants noting that the issue of ‘period poverty’ had been brought to public attention in recent years.
Existing items or activities included in UK material deprivation measures:
- no specific health items or activities are included in the existing measures
Short-listed items or activities:
- regular dental appointments
3.5.6. Communication
There was near universal agreement that a mobile phone is a necessity today. Some participants remarked that it was a good idea not to include landline phones as these are close to “become obsolete”. Participants debated about whether a mobile phone needs to be a smart phone or a basic phone. Some adult participants thought a basic phone would be enough while others remarked that “pretty much any phone nowadays is a smart phone”. Young people were very clear that a smart phone is a necessity and that they didn’t know “any young people who use a basic phone”. They also remarked on the importance of smart phones for social life, noting a preference for contacting others through social media.
Across the board participants thought the mobile phone does not need to be the latest, most expensive phone, but the importance of having a cheap smart phone is connected to the necessity of accessing the internet. There was a remarkable difference between adults and young people in relation to whether it is a necessity for children over the age of 11 to have their own phone. Most adult participants were resistant to the idea, while young people thought it was necessary for children to have their own phone from the first year of secondary school, citing safety, better communication with parents, school, or friends and support with transport as main reasons.
Across all groups, including pensioners, access to the internet was considered a necessity (perhaps not surprising given the focus groups were conducted online). The test item was phrased to include ‘access to the internet (at home or elsewhere)’, but participants overall agreed that it is a necessity to have internet access at home. Some remarked how the pandemic had made this necessity especially vivid in their experience, but more generally, they thought that nowadays “if you’re not on the internet, then it limits your chances, basically”. Many spoke of their experiences with the digitalisation of services – from benefit claims, to banking or healthcare. This was also a reason why they thought it was important to have access at home, which was both because they would not have felt comfortable accessing these services in public spaces and because they would otherwise be limited to access during opening hours (for instance at a public library).
While home schooling during the pandemic had made the need to access the internet at home especially salient for families with children and young people, they also recognised that this need extends to normal everyday schooling as most communications and educational assignments require a reliable internet connection. Some, including older participants and participants with disabilities, remarked that the internet and online services (for example, food shopping) had removed some barriers, for instance related to transport, and they often felt that overall, such was the importance of the internet in their lives that, without it, they “would be dead in the water”.
The necessity to own certain computing devices (for example, desktop computers, laptops or tablets) was also explored. The literature on digital exclusion stresses that as internet penetration grows, disparities remain in terms of the type and number of devices people have access to (van Deursen and van Dijk, 2019, Correa and others, 2022). Opinion on this item was divided. In some focus groups all or the majority of participants thought that having access to a range of different computing devices was a necessity, as a phone was not sufficient for certain educational or work needs. In other groups only a minority thought this was the case: they considered that any device would do, “as long as you have access”, and that having a phone was “enough”. These differences in opinion reflect similar differences found in the literature, which stresses the way in which use shapes digital needs (van Dijk, 2020).
There was less agreement about having minimum high-speed internet at home and mobile (‘data’) subscriptions. Overall, these items were not thought to be necessities, especially when associated with leisure activities such as streaming or gaming. However, participants also noted that internet speed is important for certain jobs and for some educational assignments and that if “a service continually crashes and freezes you are going to abandon it”. Participants were also aware of policy efforts to increase broadband penetration and speed and thought that high-speed broadband will be “the norm” in the future, thus making affordable high-speed internet a necessity. The items eventually selected tried to capture the need for internet access to be sufficiently reliable and adequate for people’s needs.
Existing items or activities included in UK material deprivation measures:
- telephone (landline) to use, whenever you need it (pensioner measure)
Short-listed items or activities:
- reliable access to the internet at home
- computer or tablet at home suitable for work, education or accessing services
- own mobile phone
3.5.7. Mobility
Almost unanimously across focus groups participants were clear that ownership of a vehicle, such as a van or a car, was not necessary for an adequate standard of living. Instead, they thought that adequate access to transport, thus including public transport, was a necessity. They spoke of challenges with public transport, as they thought services had been cut, making them less able to meet their needs. Challenges experienced in rural areas made owning a car more important, but participants largely saw this as a failure in providing an adequate public transport network. Many noted that culturally “there is debate, about whether private ownership will have to phase out in the next two or three decades”. They remarked that “older generations have grown up with cars but what matters is really accessing what you need to access, no matter how”.
Some participants mentioned specific challenges related to accessing transport. These included affordability, ease, safety, and timeliness, which was particularly important in relation to keeping appointments and work or school commitments. These aspects were included in the item’s final wording, which was probed further in the last three focus groups to ensure that the item was not referring to access to transport too vaguely but captured the need for adequate access. This resonates with the definition of accessibility poverty discussed in the literature on transport disadvantage (Lucas and others, 2016).
These items were discussed with some of the young participants, who seemed more inclined to consider having a family car a necessity. Their responses were overall consistent with the idea that access to transport more generally is a necessity and indeed that access to public transport may be considered necessary because of its value in making young people feel independent, “so they can go on their own, more like grown-ups and not like children”.
Existing items or activities included in UK material deprivation measures:
- access to a car or taxi, whenever needed (pensioner measure)
Short-listed items or activities:
- access to reliable transport at reasonable time, ease, safety and cost
3.5.8. Home and living conditions
The home and living conditions category contained the greatest number of items. Two were unanimously considered necessities across groups. These were a damp-free home and keeping the home adequately warm in cold weather. In relation to both, participants cited health as the main reason why they are necessities. Lacking these items would mean not having an acceptable standard of living and if “having a roof over one’s head” is a basic need, ensuring that one’s home meets these basic conditions is a priority. In relation to what it means to keep a home adequately warm, participants expressed an array of views. People struggled to identify what ‘adequately warm’ meant in practice or if a specific temperature should be included. For some, ensuring that the main living areas and possibly the bedrooms were adequately warm was sufficient. A few pensioners noted that “back in the day” it was more common to have one main room kept warm but that this may not be acceptable nowadays as with central heating having the whole house kept at a comfortable temperature, at least for certain hours, was the norm. Some noted the relationship with other items, sometimes highlighting tensions. For example, if only the living room is kept warm, this affects where children are able to do their homework.
The way in which times have changed and remarks about how “things were back in the day” emerged on a few occasions. For example, in relation to washing machines, which were largely considered necessities and a need which had grown due to alternatives now being scarce in many places (for example, due to laundrettes closing). Similarly, out of all types of furniture considered, beds were the one item that the majority of participants considered most important for every member of the household to have. Contrasting with how things had been in the past, some noted that it was fine for siblings to share a bed, but all agreed that this is no longer the case (although some still thought that this is fine for very young siblings). Not having enough beds and bedding for everyone suggested conditions of over-crowding that participants associated with deprivation.
Eventually no individual furniture item or appliance (washing machines, dryers, dish washers, beds, tables, TVs, freezers, microwaves) was included in the short-list of necessities. These items largely did not attract support with the exception of washing machines and beds. Indeed, beds appeared to be the only item the prompted people to consider ‘replacing any worn out or broken furniture’ a necessity. Eventually, beds were not included in the final short-list of items, as lacking a bed was considered to be at the severe end of deprivation, close to destitution, and likely to be relevant to a very small minority of people. Items such as tables and chairs elicited spirited debates, as many appear to do without as a choice, while others valued their role in family life. Many noted that tables and chairs cannot be considered luxuries and everyone should be able to afford these items regardless of whether they want them. Overall, it was decided that the short-list should include items that better capture a household’s ability to maintain adequate living conditions rather than focusing on having specific items. This led to preferring to include the ability to replace or repair domestic appliances such as washing machines, cookers or fridges, and to keep the house electrics, plumbing, heating and drains in good working order.
Other items participants thought were essentials were adequate flooring (because of the hazard that bad flooring can cause, impacts on health, but also because bad insulation leads to more expensive energy bills) and good quality windows and door locks (which relate to safety as well as health and prevents other expenses). What participants understood as ‘keeping home in a good state of decoration and repair’ was probed with participants, and flooring, windows and locks were commonly identified under this description. Due to constraints on the total number of items that could be tested, this more general item was included in the final short-list and the need to keep FRS questions short meant a full description was not included.
An item that largely relates to where people live is ‘green space within walking distance’. This item is likely to reflect differences between living in rural and urban settings but also where people can afford to live. There was no widespread agreement on this item, which was sometimes considered a necessity by a majority, but in other focus groups only a minority of participants identified it as a necessity, with no clear demographic pattern. Some participants noted that experiences during the pandemic had made the need for this item very salient. Overall, participants thought that access to green spaces was more essential than having access to outdoor space (private or communal) within the premises of their home.
Finally, an item considered important by the majority of participants was being ‘able to afford to avoid living with someone you don’t want to live with (for example, being able to leave domestic abuse or undesired co-residence). Participants thought that ‘safe’ living arrangements were of vital importance for both physical and mental health. They were less inclined to consider this a necessity for young people simply wanting to leave their family home. Overall their reflections pointed to the importance of understanding the different dimensions subsumed under the idea of “being comfortable” where this does not refer solely to structural features of a home or impacts on physical health, but also to adequacy in relation to emotional needs. Eventually, the item was not included in the final short-list for ethical reasons, namely because of the potential risks faced by FRS respondents being asked to reveal sensitive information about their living arrangements, especially in contexts of domestic abuse.
Existing items or activities included in UK material deprivation measures:
- keep home adequately warm in winter (working age and child measures)
- replace worn out furniture (working age and child measures)
- replace or repair major electrical goods such as a refrigerator or a washing machine, when broken (working age and child measures)
- home kept in a decent state of decoration (working age and child measures)
- damp-free home (pensioner measure)
- home kept adequately warm (pensioner measure)
- home kept in a good state of repair (pensioner measure)
- heating, electrics, plumbing and drains kept in good working order (pensioner measure)
- able to replace your cooker if it broke down (pensioner measure)
Short-listed items or activities:
- home kept adequately warm in cold weather
- damp free home
- replace or repair appliances such as a washing machine, fridge or cooker when broken
- home kept in a good state of decoration and repair
- heating, electrics, plumbing, drains kept in a good working order
- green space within walking distance
3.5.9. Social and leisure activities
Several social activities were considered essential for an acceptable standard of living. In particular, a majority of focus group participants thought that visiting family and friends and celebrating special occasions such as birthdays, Christmas or other religious festivals, were necessities everyone should be able to afford. Going out socially was also something that the majority of participants thought necessary, agreeing that once a month should be the minimum and more than twice a month possibly a luxury. In some cases, as for celebrating children’s birthdays, participants felt strongly that this was “a right for every child”. A challenging aspect in analysing these responses pertains to the fact that participants often interpreted these items as entailing spending “no money at all”, as people “can meet in the park” or celebrate “on a small scale”. This was reflected in the fact that a minority of participants thought that gifts to family and friends or having friends around for a snack or a meal was a necessity, or that “eating out” was often spontaneously mentioned as a luxury. Similarly, ‘doing a hobby or leisure activity (for example, sports, cinema)’ found some support among participants considering it a necessity. However, it was often discussed with qualifiers: “some things are expensive and other things cheap or even free, for instance hobbies can be free”, suggesting to exclude leisure activities such as going to the cinema as they were regarded as luxuries.
Eventually, celebrations were not included in the short-list on the basis of findings from previous analysis showing that this item has very little impact on estimated deprivation rates, and that omitting it would lead to a loss of less than 1% of people classified as materially deprived (Bailey, 2020). Seeing friends and family and going out socially were activities included in the short-list including the frequency most often suggested in the focus groups – once a month.
Other items also did not attract sufficient support to be included in the final selection. For example, ‘attending weddings and funerals’ found participants divided. There was overall resistance to the societal expectations around weddings and how this led to very significant expenses, in terms of gifts, travel, outfits, etc. There was more agreement that attending funerals is a necessity, both because “some funerals you just have to attend” and because of their usual greater proximity, and lower expenses associated with attending funerals in comparison to weddings.
Finally, across most focus groups ‘having a holiday away from home once a year’ was largely considered a luxury. Often participants based this judgement on their own experiences of not having had holidays for several years, and opinions were also influenced by the pandemic. One example of the types of opinions expressed is: “everybody would probably like a holiday, but I think we’ve all learned as well, particularly with what’s happened [with the pandemic] is that we don’t need holidays, they’re not a necessity for everybody”. Existing evidence shows that adult holidays are often among the first thing households give up as incomes fall (Bailey, 2020). It is also an item with low prevalence. There was more support for short, simple family holidays as necessities as these are “good for children, you don’t want children to feel like second class citizens”. Similarly, participants didn’t discount staying with relatives as a holiday and indeed visiting family was a key reason why people thought holidays were a necessity. This also resonated with young people with family abroad who saw holidays as essential for remaining connected to them. Participants often thought that ‘a break’ rather than ‘a holiday’ may be all people need and this formulation was eventually included in the short-listed item.
Existing items or activities included in UK material deprivation measures:
- a holiday away from home for at least one week a year, whilst not staying with relatives at their home (working age and child measures)
- take a holiday away from home for at least a week, once a year (pensioner measure)
- see friends or family at least once a month (pensioner measure)
- go out socially, either alone or with other people, at least once a month (pensioner measure)
Short-listed items or activities:
- go out socially at least once a month
- see friends and family at least once a month
- a break away from home once a year
3.5.10. Things for oneself
Several items in this category gained little support from focus group participants. An example included one of the items in the current UK pensioner material deprivation measure: ‘having your hair done or cut regularly’. People reflected on their experiences during the pandemic to explain why they considered professional haircuts a luxury, and generally struggled to define what should count as ‘regularly’. Another contentious item was ‘a small amount of money to spend each week on yourself (not on your family)’, which is included in the current working-age adult and child material deprivation measures (relating to a parent in the child measure). This item was interpreted by participants as related to financial security and to having resources left at the end of a week, something that as we have seen above was considered not realistic by many. Others noted that ‘having money for oneself’ can relate to small treats everyone should be able to afford: “I was thinking of maybe a cup of coffee for myself every week, I should be able to afford that”, “it doesn’t need to be a lot, just every once in a while, to have a little chocolate to yourself”.
There were connections made between some items in this category and those discussed in other categories, which attracted similar levels of support, such as ‘separate beds for every person or couple’. Participants also thought that children of age 10 or over of a different sex should have their own bedroom, some thought that this is recognised in the allocation of social housing[footnote 4]. Agreement on this item also resonated with the opinions of young people. There was also good support for the idea that having ‘personal space (for example, a bed, drawer or box etc. that is yours and you know will be respected by others)’ is a necessity. Sometimes participants referred back to their answers about other items. For example, in relation to having separate beds, sometimes they just thought of the need of having “some breathing space”, going to a room of the house where they could be alone. Eventually, the item was not short-listed because of constraints on the number of items that could be included but also because it was judged that the item was ill-defined and unlikely to capture a significant dimension of material deprivation.
Existing items or activities included in UK material deprivation measures:
- a small amount of money to spend each week on yourself (not on your family) (working age and child measures)
- have hair done or cut regularly (pensioner measure)
- enough bedrooms for every child of 10 or over of a different sex to have their own bedroom (child measure)
Short-listed items or activities:
- a small amount of money to spend on self each week (not on your family)
- enough bedrooms for every child of 10 or over of a different sex to have their own bedroom
3.5.11. Items and activities related to children
School trips were a contentious item that divided opinions both among adults and young people. Those who did not think school trips a necessity often thought of long residential trips or expensive trips abroad, while educational trips were widely considered necessary. Young people also stressed that school trips can be connected to assessments and are an integral part of their education. Several participants thought that, for those trips that are not educational, “if people can’t afford for their children to go, it is not the end of the world”. At the same time some participants thought that school trips with a social element should also be valued. Such trips can be a reward and function as “positive reinforcement” and for some children it may be the only opportunity to visit new places, if they cannot afford holidays or family trips.
Participants in several groups also stressed concerns about how missing school trips that the majority of children go on can affect children’s mental health and wellbeing, leading to feelings of exclusion and stigma. In light of these findings, the wording of the short-listed item was intentionally left general, ‘school trips’, rather than placing a restriction on the type of school trip. These considerations contrast with those articulated by participants on family day trips, an item which received less support because participants saw it as less directly affecting children’s education and less likely to produce stigma if lacked.
Some other items that participants considered especially necessary were connected to children’s education. For example, there was near universal agreement about the need for a place to do homework, with several participants remarking that this should be at home, to avoid being tied to opening hours of schools and libraries and to make it easier to revise especially during busy exam periods. The wording of this item was assessed in later focus groups and eventually the qualifier of a place to do homework ‘at home’ was incorporated in the short-listed item.
School uniform and school equipment were also largely considered a necessity by both adults and young people. Some mentioned that school uniforms “make everyone equal and sort of level the playing field by not making someone stand out”. Some thought school uniforms were cheaper now than they used to, while others stressed that having every item, including PE kits, can be expensive. Some young people expressed doubts that a school uniform was altogether necessary, as they saw it as an old-fashioned tradition that could be done without. Examples of school equipment that were discussed included text books and a calculator, and these were generally considered necessities. Some participants went on to discuss whether having a laptop was also necessary equipment, but it was explained that separate questions on computing equipment were being considered. Eventually it was decided to include both school uniform (including PE kit) and equipment in one question, because the underlying concept is the same.
For some items there was a discrepancy between the views of adults and the views of young people. Adults were more likely to consider out-of-school activities such as sports or youth clubs as necessities, while young people were almost unanimous in considering ‘enough clothes you feel ok wearing’ necessary, something that adults did not greatly value (note that this was differently phrased for adult focus groups ‘clothes to fit in with friends’). Adults recognised the pressure on young people to conform to fashion: “They have to dress like their friends which is wrong really but there you go”, and “They could spend a fortune kids these days”. However, in general, despite this recognition adults struggled to classify clothes that enable you to fit in as a necessity. Perhaps this was because of their ambivalence towards whether it should be a necessity.
Young people, however, commented on the importance of having clothes that are comfortable in a literal sense, because they fit well, but also that make you feel comfortable, contributing to confidence and self-esteem in a way that “affects what you do and how you go about doing it”. They felt that “if you don’t like what you’re wearing, then it might, like, affect how you feel on that day or make you feel like you’re overwhelmed”.
In short-listing items consideration was given to including items relevant to different age children. This led to including items such as baby equipment and taking part in toddler and play groups, which many participants considered necessities, in order to include some items relevant to children not yet at school. Suitable books, indoor games and toys (eventually rephrased to include outdoor equipment) also saw a good level of agreement in being considered necessities. Leisure equipment (included in the current child measure) divided some participants, but previous evidence suggests it could be useful in helping to differentiate deprived from non-deprived children (Main and Bradshaw, 2014). Combining what is needed for indoor and outdoor play and activities in a single item allowed it to cover the full age range, and attracted more support in being considered a necessity.
A few items included in the current child material deprivation measure were retained in a slightly modified form. For example, ‘having friends round’, was widely valued by young people and resonated with reflections in adult focus groups. Adults recognised its social importance, but they were resistant to considering having someone round for a meal a necessity (as opposed to tea or a snack). For young people, rephrasing this item to place emphasis on the activity rather than the consumption seemed a good solution: ‘Friends round to play, have a snack or hang out once a month’. Similarly, outdoor space or facilities nearby where they can play safely was rephrased to expand the age range which it relates, by including ‘play or hang out safely’. This item was widely considered a necessity and many remarked that it was “especially important”, noting that it is influenced by where you can afford to live.
A few items attracted divided opinion both among adult participants and young people. For instance, only a minority thought that ‘attending and taking a gift to a friend’s party’ was a necessity, but a few noted a strong element of reciprocity (as the host “is spending money to invite you”) and some young people remarked that “this is “normal” and makes you happy doing it”. Pocket money was also largely not considered a necessity by adults, while young people were more divided, with some noting that this has an educational value, teaching young people to handle money.
Existing items or activities included in UK material deprivation measures:
- go on school trips (child measure)
- go to a toddler or nursery group at least once a week (child measure)
- outdoor space or facilities nearby where children can play safely (child measure)
- leisure equipment such as sports equipment or a bicycle (child measure)
- have friends round for tea or a snack once a fortnight (child measure)
- a family holiday away from home for at least one week a year (child measure)
- celebrations on special occasions such as birthdays, Christmas or other religious festivals (child measure)
- attend at least one regular organized activity a week outside school, such as sport or a youth group (child measure)
- do a hobby or leisure activity (child measure)
Short-listed items or activities:
- go on school trips
- all items of school uniform and equipment required by the school including sports kit
- a suitable place to do homework at home
- enough clothes that children feel comfortable to wear
- at least one regular organized activity a week outside school, such as sport or a youth group
- enough toys, games and outdoor equipment suitable for age
- baby equipment such as cot, highchair and pram or pushchair (for babies)
- outdoor space or facilities nearby where children can play or hang out safely
- a toddler group/nursery/play group at least once a week (for pre-school children)
- friends round to play, have a snack or hang-out once a month
4. Short-listed items and activities and FRS test questions
This chapter describes the short-listed items and activities and the test questions included in the FRS during April, May and June 2022. It covers:
-
the showcards used for the first set of questions which asked FRS respondents to identify necessities from the short-listed items and activities
-
the agreed material deprivation FRS test questions according to whether they were core household-level items or individual-level items for working-age adults, children or pensioners
-
the test questions for the 13 household-level items, 11 individual-level items for working age adults, 9 individual-level items for pensioners and 13 individual-level items for children
-
details on changes tested to the question routing and the follow-up question used to establish why respondents lack any of the candidate items and activities
Based on the evidence covered in Chapters 2 and 3, a short-list of items and activities was recommended to the project’s Steering Group. The Steering Group accepted the recommendations and it was agreed that these items could be tested in the FRS. To understand how the test questions were included in the FRS, and how respondents were selected, it is helpful to provide some detail on the structure of the FRS. The FRS is a UK household survey and a key source of information on social security and income. A household can be sub-divided into benefit units (BUs) based on standard groupings used by DWP for assessing benefit entitlement with some households made up of more than one BU (see Glossary of Terms). Some information is collected at the household level from a single respondent (known as the household representative person). In households with multiple BUs, this person is usually selected from the BU which contains the highest earner in the household – this BU is referred to as Benefit Unit One (BU1). In these households, some information is collected from each of the BUs from a representative adult (who might be chosen at random). Some information in the FRS can be collected from proxy respondents if the selected respondent is not available at the time of the interview.
4.1. Necessities
The first set of test questions asked respondents which of the short-listed items and activities they considered to be necessities for an acceptable standard of living in the UK today. These questions were put to a representative adult in each household who was chosen at random from BU1. Respondents were told: “We are first going to ask you about what items or activities are necessary for an acceptable standard of living in the UK today. There is no right or wrong answer. An acceptable standard of living means people being able to function well and take part in the world around them.” Respondents were then shown a series of six showcards containing the short-listed items, and asked “Which of the items on this card do you think are necessary for people to have an acceptable standard of living in the UK today? Please choose all items you think people should be able to afford.” The final two showcards contained items and activities related to children. In total, respondents were asked about 35 items and activities.
Showcard 1
-
Keeping up with regular bills like rent, mortgage, electricity or Council tax or rates without cutting back on essentials
-
Having money aside to cover unexpected expenses
-
Home kept adequately warm in cold weather
-
Damp free home
-
Replace or repair appliances such as a washing machine, fridge or cooker when broken
-
Home kept in a good state of decoration and repair
-
None of these
Showcard 2
-
Reliable access to the internet at home
-
Computer or tablet at home suitable for work, education or accessing services
-
Access to banking services
-
Access to reliable transport at reasonable time, ease, safety and cost
-
Heating, electrics, plumbing, drains in a good working order
-
Home contents insurance
-
None of these
Showcard 3
-
Not having money worries at the end of the month
-
A break away from home once a year
-
Three meals a day
-
Fresh fruit or vegetables every day
-
A small amount of money to spend each week on yourself (not on your family)
-
Green space within walking distance
-
None of these
Showcard 4
-
Appropriate clothes for work or job interview (if working age)
-
Regular payments to a workplace or private pension (if working age)
-
See friends and family at least once a month
-
Regular dental appointments
-
Mobile phone
-
Go out socially at least once a month
-
None of these
For the final two showcards, respondents were asked “Which of the items on this card do you think are necessary for children to have an acceptable standard of living in the UK today? Please choose all items you think people should be able to afford.” These questions were asked of all respondents and not limited to parents of dependent children.
Showcard 5
-
Go on school trips
-
All items of school uniform and equipment required by the school including sports kit
-
A suitable place at home to do homework
-
Enough clothes that they feel comfortable to wear
-
At least one regular organized activity a week outside school, such as sport or a youth group
-
Enough bedrooms for every child of 10 or over of a different sex to have their own bedroom
-
None of these
Showcard 6
-
Enough toys, games and outdoor equipment suitable for their age
-
Baby equipment such as cot, highchair and pram or pushchair (for babies)
-
Outdoor space or facilities nearby where they can play or hang out safely
-
A toddler group, nursery or playgroup at least once a week (for pre-school children)
-
Friends round to play, have a snack or hang out once a month
-
None of these
4.2. Material deprivation test questions
The material deprivation test questions were organised across four blocks: household-level (HH), working-age adults (WA), pensioners (SPA) and children (CHILD). Only the selected adult in BU1 answered the household-level questions. The WA, SPA and CHILD questions are addressed to an adult in each relevant BU. Pensioners are defined as having reached State Pension Age (SPA).
Household-level items were chosen to reflect the household context relevant to all members of a household and, therefore, it is fair to assume that deprivation of an item affects all members in the household. For example, a damp free home. This information only needs to be collected once for each household, reducing the survey burden on households with multiple BUs or mixed age adults within BUs. In addition, the development of a core set of questions at the household-level was designed to help aid the potential development of a whole population or household-level material deprivation measure. For four of the household-level items (indicated by an asterisk in Table 4.1), test questions were only asked of working-age respondents (adults below State Pension Age). The same, or very similar questions, were included in the current set of FRS pensioner material deprivation questions. The decision not to repeat these questions in the test question block for pensioners was made to reduce the survey burden on pensioners as responses can be derived from existing questions. This was possible due to the same question routing for the test questions already in use for pensioners and the possibility to derive the new categories for the follow-up question establishing why any of the items are lacked from the existing question (explained further in Section 4.3).
Table 4.1: Material deprivation test questions: household-level
| Number | Test question |
|---|---|
| 1 | Without cutting back on essentials, are you able to pay regular bills like rent, mortgage, electricity or Council tax (if GB) or Rates (if NI)? |
| 2 | Are you able to put money aside to cover unexpected expenses? |
| 3 | Could you cover the cost of replacing or repairing appliances such as a washing machine, fridge or cooker if they broke? |
| 4* | Is your home kept in a good state of decoration and repair? |
| 5* | In cold weather, is your home kept adequately warm? |
| 6* | Is your home damp free? |
| 7 | Do you have reliable access to the internet at home? |
| 8 | Does everyone in your household have use of a computer or tablet for work, education or accessing services? |
| 9 | Does everyone in your household have access to transport that is reliable, timely, safe and affordable? |
| 10 | Are your heating, electrics, plumbing, drains in good working order? |
| 11 | Do you have adequate access to banking services? |
| 12 | Do you have access to green space within walking distance? |
| 13 | Do you have home contents insurance? |
Notes: * These test questions were only asked if the household representative adult respondent in BU1 was working-age (aged 65 and under).
For the individual-level items, an adult from each BU was asked to respond to either the working-age or the pensioner question blocks depending on their age. Questions related to two individual-level items, indicated by an asterisk in Table 4.2, were not asked of respondents over State Pension Age as very similar questions were present in the existing material deprivation questions for this age group (this was possible due to the reasons outlined above). The questions relating to children were answered by a parent in each BU containing at least one dependent child. As is the case with the existing child material deprivation questions, parents were asked to consider all their dependent children when answering these questions (some of which relate to children of specific ages). If the parent reports that one of their children does an activity or has an item but another does not it is the lack of the activity or item that is recorded.
Table 4.2: Material deprivation test questions: individual-level
| Number | Test question | WA | SPA | CHILD |
|---|---|---|---|---|
| 1 | Do you regularly have money worries at the end of the month? | Yes | Yes | |
| 2 | Do you make regular payments to a workplace or private pension? | Yes | ||
| 3 | Do you eat three meals a day?* | Yes | Yes | Yes |
| 4 | Do you eat fresh fruit or vegetables every day?* | Yes | Yes | Yes |
| 5 | Do you have appropriate clothes for work or job interview? | Yes | ||
| 6 | Do you attend regular dental appointments? | Yes | Yes | |
| 7 | Do you have your own mobile phone? | Yes | Yes | |
| 8 | Do you (your partner and your dependent children) have a break away from home at least once a year? | Yes | Yes | |
| 9 | Do you go out socially at least once a month? | Yes | No | |
| 10 | Do you see friends and family at least once a month? | Yes | No | |
| 11 | Do you have a small amount of money to spend each week on yourself (not on your family)? | Yes | Yes | |
| 12 | Does your child/do your children go on school trips? | Yes | ||
| 13 | Does your child or do your children have all items of school uniform and equipment required by the school, including sports kit? | Yes | ||
| 14 | Does your child or do your children have enough clothes that they feel comfortable to wear? | Yes | ||
| 15 | Does your child or do your children have outdoor space or facilities nearby where they can play or hang out safely? | Yes | ||
| 16 | Does your child or do your children attend at least one regular organized activity a week outside school, such as sport or a youth group? | Yes | ||
| 17 | Does your child or do your children have friends round to play, have a snack or hang out once a month? | Yes | ||
| 18 | Does your child have enough toys, games and outdoor equipment suitable for their age? | Yes | ||
| 19 | Does your child or do your children have a place to do homework at home? | Yes | ||
| 20 | Are there enough bedrooms for every child of 10 or over of a different sex to have their own bedroom? | Yes | ||
| 21 | Does your child or do your children go to toddler group, nursery or playgroup at least once a week? | Yes | ||
| 22 | Do you have enough baby equipment such as cot, highchair and pram or pushchair? | Yes |
Notes: *Phrased “Does your child or do your children…” for the CHILD block. Two items in the SPA block, indicated by ‘No’, were shortlisted but were not included in the test question block as they replicated existing questions in the FRS for pensioners.
4.3 Methodological changes
Two key methodological changes were also introduced in the test question blocks:
1) Standardised question routing
Respondents were first asked whether or not they lacked any of the items or activities before being asked a set of follow-up questions to establish why they lacked any item or activity. This was the question routing already in use in the FRS for material deprivation questions for pensioners. The reason why this routing was introduced was that research informing the development of the UK material deprivation measure for pensioners found evidence that pensioners were reluctant to report that they lack an item due to a financial constraint (McKay, 2008).
Splitting the question into two parts – first simply asking whether or not respondents lack an item before asking the reason why they lack it – was introduced to reduce under-reporting and informed by cognitive testing of survey questions to establish the best approach (Legard, Gray and Blake, 2008). Only asking the follow-up questions on the reason why respondents lack any of the items after establishing if any of the items are lacked, was introduced because evidence suggests that survey respondents will try and look for short-cuts when responding to surveys (McKay, 2008). When it becomes apparent that follow-up questions are asked only when a respondent indicates that they lack items, this creates an incentive for respondents to say that they do not lack items. Standardising the question routing across all age groups should improve comparability between groups and aid the development of a potential whole population material deprivation measure.
2) Reasons for lacking an item or activity
In the existing FRS material deprivation questions, for pensioners and working-age adults reporting that they lack an item or activity, there is an inconsistency in the number of reasons respondents can choose between on why they lack an item or activity. Working-age adults are presented with a narrow range of options. For each item or activity, they were asked whether or not they have it, whether they would like to have it but can’t afford it at the moment, or if they don’t want or don’t need it at the moment. Only respondents indicating that they would like an item or activity but can’t afford it are classified as deprived of that item or activity. In contrast, pensioners are asked to choose between the following set of reasons why they lack an item or activity:
a) I do not have the money for this
b) This is not a priority for me on my current income
c) My health or disability prevents me
d) It is too much trouble or too tiring
e) There is no one to do this with or help me
f) This is not something I want
g) It is not relevant to me
h) Other reason
In the existing measures, pensioners are classified as materially deprived of an item or activity if they indicate that they don’t have it for any reasons except f) this is not something I want, or g) it is not relevant to me. The inclusion of a wider set of constraints used in the definition of deprivation means that concept of the existing measure of material deprivation for pensioners extends beyond financial constraint.
The tailored material deprivation measure for pensioners was introduced after it was found that the adult and household level items and activities introduced in 2004/2005 were particularly poor at identifying material deprivation among older people (McKay, 2008). A pensioner specific measure, introduced from 2008/2009, included bespoke items and activities, the question routing outlined above (establishing whether an item or activity is lacked before asking why) and the wider set of valid constraints leading to the assessment of deprivation of an item or activity (McKay, 2010). The basis for expanding the list of reasons for lacking was that a review concluded that pensioners were more reluctant to say that they lacked an item or activity because they could not afford it (McKay, 2010).
However, reluctance to report lack of an item or activity due to not being able to afford it is not exclusive to older people. Previous research has highlighted an income gradient with higher shares of lower income households more likely to report that they, or their children, lack an item or activity because they don’t want or need it or for some other reason (McKnight, 2013a, McKnight, 2013b). This suggests that providing all respondents with a wider range of reasons for why they might lack an item or activity to choose from, could improve the measurement of material deprivation.
It was recommended that a standardised list of reasons for lacking items or activities should be used for the test questions. The standardised set expands the options available for working-age adults and parents of dependent children, but a slightly shorter list of reasons for pensioners than had previously been used. The recommendation to shorten the list of reasons for pensioners was informed by research showing that two of the options were very rarely used and could be captured within the shorter list. This standardised approach had the potential to improve the measurement of material deprivation, improve comparability between age groups and aid the development of a potential whole population measure. It was also flexible enough to allow different types of constraint to be identified: financial constraint and a broader definition of constraint consistent with the current pensioner material deprivation measure.
The standardised set of options used to establish why working-age adults or pensioners lack an item or activity in the FRS test questions:
-
We or I do not have the money for this
-
This is not a priority on my or our current income
-
Health or disability prevents this
-
We or I do not want or need this
-
It is not relevant to me or us
-
Other reason
The standardised set of options used to establish why children lack an item or activity in the FRS test questions:
-
Child(ren) would like to have this but I or we don’t have the money for this
-
This is not a priority on my or our current income
-
Child(ren) health or disability prevents this
-
Child(ren) do not want or need this
-
It is not relevant to child(ren)
-
Other reason
FRS respondents are asked to indicate all the reasons that apply and respondents indicating either option 1 or option 2 are defined as lacking the item or activity due to a financial constraint. If respondents select option 1, option 2, option 3 or option 6, they are defined as lacking the item or activity due to a wider constraint (consistent with the definition used in the current measure for pensioners).
For a number of the test items and activities a respondent reporting that they, or their children, lack the item or activity, irrespective of the reason why, is used to indicate material deprivation (sometimes referred to as simple absence). They are:
Do you have access to green space within walking distance?
Does your child or do your children have outdoor space or facilities nearby where they can play or hang out safely?
Without cutting back on essentials, are you able to pay regular bills like rent, mortgage, electricity or Council tax (if GB) or Rates (if NI)?
Are you able to put money aside to cover unexpected expenses?
Are there enough bedrooms for every child of 10 or over of a different sex to have their own bedroom?
In addition, if a respondent answered yes to the question on money worries they are regarded as materially deprived of this item:
Do you regularly have money worries at the end of the month?
5. Assessment of candidate necessities and test items and activities
Analysis of the FRS test question data was conducted to inform a set of recommendations on which items and activities should be included in revised material deprivation measures. This involved adopting the analytical framework described in the evidence review (Chapter 2). This Chapter:
-
begins by describing the FRS test question dataset
-
presents test results on the suitability of candidate necessities through establishing current support for the test items. It is shown that all candidate test items achieved support from at least 60% of respondents
-
findings from an assessment of whether candidate items are valid indicators of material deprivation using low-income and low savings. Validity test results are shown for working-age adults, children and pensioners
-
an assessment of the reliability of candidate items and derived composite scales
-
results from an assessment on whether candidate items are additive whereby greater numbers of items lacked is associated with increasingly poorer standards of living
-
items with weak validity and reliability test results are assessed
-
finally, the analysis concludes that six test items should be omitted and not included in the revised material deprivation measures. These are: adequate access to banking services, access to green space within walking distance, own mobile phone, all items of school equipment required by the school, including sports kit, outdoor space or facilities nearby where child(ren) can play or hang out safely, enough baby equipment such as cot, highchair and pram or pushchair.
The testing framework seeks to introduce a statistical criteria for the selection of items. However, it is important to acknowledge that assessing whether or not candidate items or composite scales pass the tests often involves using rules-of-thumb or judgement. This means that it is important not to over-claim the objective nature of these tests or the outcome of this testing strategy. Given known weaknesses with the tests, assessing the strength or weakness of individual items or composite measures is based on results from a series of tests rather than relying on results from a single test.
5.1. FRS test question dataset
The test questions were included in the FRS during April, May and June 2022, with the test question module positioned at the end of the survey.
The LSE research team was supplied with a copy of the FRS test question dataset at the end of October 2022. The dataset includes responses to the test questions on necessities and the material deprivation items, a range of individual and household characteristics, standard FRS/HBAI derived variables such as household income, variables related to the existing material deprivation measures and cross-sectional weights.
The FRS test question dataset included a sample of 12,955 individuals (Table 5.1). FRS respondents could choose whether or not to respond to the material deprivation test question module or to any of the questions within the module[footnote 5]. For the analysis of the material deprivation test items, the samples are restricted to individuals in each age-group with non-missing data for relevant items. This allows the analysis of responses to be conducted for the same sample of individuals for the individual-level items and for analysis of composite measures which combine responses across select groups of items. This restriction led to a reduction in the sample size from 12,955 to 10,532 individuals (Table 5.1). Some of the analysis requires information on household income. Restricting the sample to individuals with non-missing equivalised household income leads to a further reduction in the sample sizes. Overall, the FRS test question dataset offers a sample of 9,356 individuals with valid information on material deprivation items and non-missing household income.
Table 5.1: Unweighted sample sizes in the FRS test question dataset
| Working-age adults | Children | Pensioners | Total | |
|---|---|---|---|---|
| Sample size | 7,234 | 2,577 | 3,144 | 12,955 |
| Sample with non-missing data for the relevant material deprivation test items | 5,627 | 2,202 | 2,703 | 10,532 |
| Sample with non-missing data for the relevant material deprivation test items and non-missing equivalised household income | 5,003 | 1,916 | 2,437 | 9,356 |
Source: FRS test question dataset
As noted in Section 4.1, only one adult in each household (from BU1) was asked to answer the questions on necessities (identifying which, if any, of the short-listed items and activities are necessary for an acceptable standard of living in the UK today). For the analysis of responses to the necessities questions, no sample restrictions were applied other than the need to have a valid response to an item.
Between 5,417 and 5,445 individuals had valid responses to the questions on necessities (Table 5.2). This was out of a maximum of 6,054 possible respondents (the number of BU1s in the FRS test question dataset) and represents a response rate of 89-90%. Sample sizes are slightly smaller for the child items, suggesting that some respondents didn’t feel qualified to say whether the child items were necessities for children.
Table 5.2: Unweighted valid responses to the necessities questions in the FRS test question dataset
| Item description (child items) | Valid responses |
|---|---|
| School trips | 5,420 |
| School uniform or equipment | 5,420 |
| Enough clothes feel comfortable wearing | 5,420 |
| Outdoor space or facilities nearby | 5,417 |
| Organised weekly activity outside school | 5,420 |
| Friends round monthly | 5,417 |
| Age suitable toys or games | 5,417 |
| Enough bedrooms for children aged 10+ | 5,420 |
| Toddler, nursery or playgroup weekly | 5,417 |
| Enough baby equipment | 5,417 |
| Place at home to do homework | 5,420 |
| Item description (adult items) | Valid responses |
|---|---|
| Able to pay bills without cutting back on essentials | 5,444 |
| Having money aside for unexpected expenses | 5,444 |
| Replace or repair appliances | 5,444 |
| Home in good state of decoration and repair | 5,444 |
| Home adequately warm in cold weather | 5,444 |
| Home damp free | 5,444 |
| Reliable access to internet at home | 5,444 |
| Computer or tablet at home | 5,444 |
| Access to reliable transport | 5,444 |
| Heating, electrics or plumbing in good working order | 5,444 |
| Adequate access to banking services | 5,444 |
| Green space within walking distance | 5,445 |
| Home contents insurance | 5,444 |
| Without regular money worries | 5,445 |
| Regular pension payments | 5,442 |
| Three meals a day | 5,445 |
| Fresh fruit or vegetables every day | 5,445 |
| Appropriate clothes for work or job interview | 5,442 |
| Regular dental appointments | 5,442 |
| Own mobile phone | 5,442 |
| Annual break away from home | 5,445 |
| Go out socially monthly | 5,442 |
| See friends and family monthly | 5,442 |
| Small amount of money for self | 5,445 |
Source: FRS test question dataset.
5.2 Suitability testing
The set of questions on necessities included in the FRS, outlined in Section 4.1, was used to assess the suitability of individual items and activities by establishing current support for whether items should be regarded as necessities. This, in addition to evidence from the focus groups which informed the short-list of candidate items and activities, is used to identify socially perceived, or social established necessities.
A minimum level of support widely used in the literature to identify ‘socially perceived necessities’ is a simple majority of at least 50% (see, for example, Mack and Lansley, 1985). However, this can be considered a low threshold and items and activities which only achieve support from a little over 50% of respondents can be problematic. As discussed in the evidence review in Chapter 2, items and activities with limited support (in terms of the percentage of respondents agreeing that the item or activity is a necessity) can indicate that there isn’t a strong consensus and that lacking such items may be due to differences in tastes and preferences. Including items and activities with limited social recognition that they are necessities in a material deprivation measure, will limit its ability to distinguish between materially deprived and non-materially deprived groups. In this review, a higher threshold of at least 60% support was adopted but it is important to acknowledge that the choice of threshold is arbitrary and further tests are necessary to assess validity and reliability.
All test items and activities included in the FRS passed the simple majority support (at least 50%) and our preferred higher 60% support threshold (Figure 5.1). The lowest support was found for an annual break away from home (64%), home contents insurance (69%) and going out socially at least once a month (69%). The vast majority of the candidate necessities were supported by at least three-quarters of FRS respondents.
The weighted and unweighted series are included in Figure 5.1 which shows very little difference between the two series. For most candidate necessities, support is marginally higher in the weighted data series but the differences are unlikely to be statistically significant. In the rest of the analysis weighted data are used unless stated otherwise.
Figure 5.1: Percentage of respondents indicating that a test item or activity is a necessity
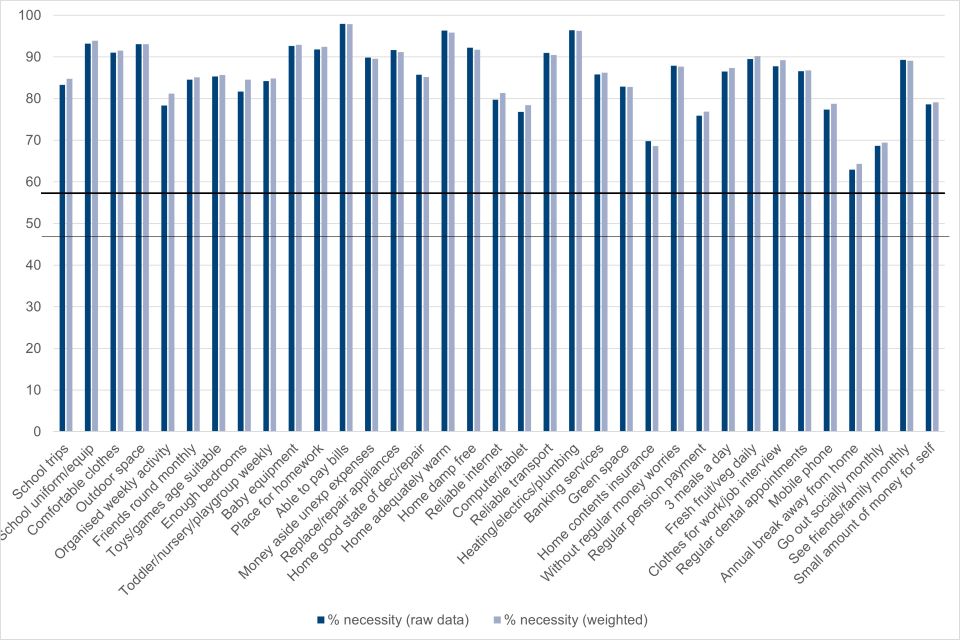
Source: Authors’ analysis of FRS test question dataset (April, May and June 2022)
Differences in support for test items and activities was examined by age group, sex and income quintiles. The broad findings were that older people were less likely to consider items necessities than younger people, but support was still strong and met the minimum threshold. Notable age gaps are shown in Table 5.3. Older age groups (aged 66 or older) were less likely to consider a reliable internet, access to a computer or tablet, three meals a day, suitable clothes for work/job interview, having a mobile phone or children going on school trips to be necessities than respondents aged 35 to 50 years. However, a marginally higher share of older people considered being without regular money worries to be a necessity than in the younger age groups. Very similar shares considered going out socially at least once a month and an annual break away from home to be a necessities; two of the items which were found to have the lowest support overall (see Figure 5.1). Although the share of respondents regarding an annual break away from home to be a necessity is lower among the older age group, it is still above the 60% support threshold.
Table 5.3: Percentage of respondents reporting selected items and activities are a necessity for two age groups
| Item or activity | 35 to 50 years | 66+ years |
|---|---|---|
| School trips | 87% | 80% |
| Reliable internet | 88% | 69% |
| Computer or tablet | 85% | 68% |
| 3 meals a day | 92% | 82% |
| Work or interview clothes | 92% | 80% |
| Own mobile phone | 82% | 70% |
| Be without regular money worries | 86% | 90% |
| Annual break | 66% | 61% |
| Monthly social | 69% | 68% |
Source: Authors’ analysis of FRS test question dataset (April, May and June 2022).
In general, either equal shares of women and men or slightly higher shares of women than men (around 2 to 3 percentage points) identified the test items and activities as necessities. Exceptions for which a higher share of men than women considered an item or activity to be a necessity were: having a small amount of money for oneself, adequate access to banking services, and access to computer or tablet at home, but these differences were small.
For some test items and activities, respondents in higher income households were more likely to indicate that they were necessities than respondents in lower income households, which can be expressed as an income gradient in support (Figure 5.2)[footnote 6]. For example, 94% of respondents in households with income in the highest income quintile indicated that living in a damp free home was a necessity, relative to 88% of respondents in households with income in the lowest income quintile. However, the vast majority of respondents from across the income distribution indicated that living in a damp free home was a necessity. Distinct income gradients were not found for all the candidate items and activities. For example, an annual break away from home (annual break) has a much shallower gradient which is not linear. For having enough bedrooms for every child aged 10 and over of a different sex to have their own bedroom (enough bedrooms), there is very little difference in support between individuals across income quintiles. Overall, even where lower support for items or activities was found in some income quintiles, the share was at least 60% support.
Figure 5.2: Percentage of respondents indicating that selected items are necessities by household income quintile (after housing costs)
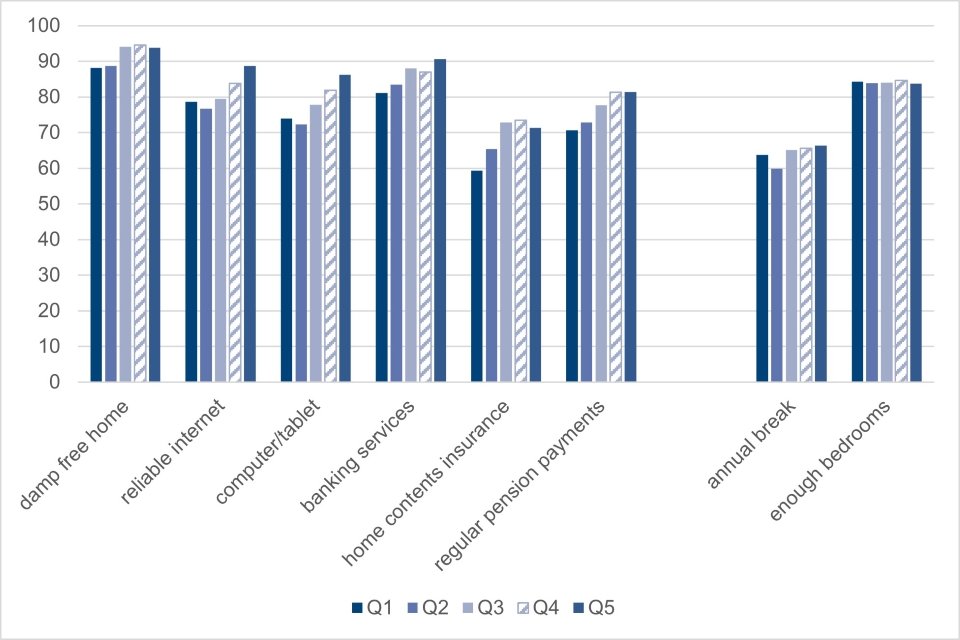
Source: Authors’ analysis of FRS test question dataset (April, May and June 2022).
The conclusion from the analysis of suitability based on the assessment of the share of respondents indicating that they regarded test items or activities necessary for an acceptable standard of living in the UK today, is that all 35 items and activities tested passed the suitability test based on a minimum of 60% support. This meant that all 35 candidate items and activities were included in the validity and reliability testing.
5.3. Validity testing
Validity tests were used to assess whether lack of items or activities is correlated with variables known to be associated with material deprivation. If so, they are considered to be valid indicators of material deprivation. These tests used a low income variable (less than 60% median equivalised household income after housing costs) and a low savings variable (less than £1,500) as indicators of material deprivation. Other candidate indicators tested were disability status and housing tenure (whether living in social housing) but these variables were found to be poor indicators.
Logistic regression models were estimated for each candidate item or activity. In these models a binary dependent variable indicating whether an item or activity is lacked due to a financial constraint[footnote 7] (additionally, wider constraint for older people[footnote 8] is regressed against an independent variable which is either a binary variable for low income or low savings. Each cell in tables 5.4 to 5.7 represents the results from a separate model estimation. The results are summarised by reporting statistical significance of the coefficient on the independent variable. For example, in the working-age group a statistically significant association is found between not having three meals a day due to a financial constraint and having low savings. The *** indicate that this association is estimated to be statistically significant at the 1% level (p>0.01). This means that we can be confident about this finding as only 1% of the time would we expect to obtain this result purely by chance.
For the working-age group (Table 5.4), a strong association is found between each of the test items and low income and low savings. This means we can be confident about the validity of the test items in capturing material deprivation.
Table 5.4 Summary of validity test results: working-age adults
| Household or individual | Item or activity | Low income | Low savings |
|---|---|---|---|
| Individual | No regular money worries | *** | *** |
| Individual | Regular pension payments | *** | *** |
| Individual | 3 meals a day | *** | *** |
| Individual | Fresh fruit or vegetables daily | *** | *** |
| Individual | Clothes for work or job interview | *** | *** |
| Individual | Regular dental appointments | *** | *** |
| Individual | Own mobile phone | *** | *** |
| Individual | Annual break away from home | *** | *** |
| Individual | Go out socially monthly | *** | *** |
| Individual | See friends and family monthly | *** | *** |
| Individual | Small amount of money for oneself | *** | *** |
| Household | Able to pay bills | *** | *** |
| Household | Money aside for unexpected expenses | *** | *** |
| Household | Replace or repair appliances | *** | *** |
Source: Authors’ analysis of FRS test question dataset (April, May and June 2022).
Notes: Statistical significance level: *** p<0.01; ** p<0.05; * p<0.10.
There is a more mixed set of results for individual-level items and activities for children (Table 5.5). For a number of candidate items and activities the models perfectly predict the outcome (indicated PP in the table). This means that all children in the FRS test question dataset who lacked these items or activities due to a financial constraint are living in low income households or households with low savings. For example, all children who lack three meals a day due to a financial constraint also live in households with low levels of savings. There are also some items where the association is not statistically significantly (based on a statistical significance threshold of 10%). For example, lacking access to outdoor space or facilities nearby where child(ren) can play or hang out safely due to a financial constraint is not significantly associated with either living in a household with low income or a household with low savings. This is the only item for which there is a lack of statistical significance with both low income and low savings.
Statistically insignificant findings can be due to a lack of association between the item or activity and low income/low savings, or because the sample size in the FRS test question dataset for children lacking an item due to a financial constraint is small. For the household-level items, lacking any due to a financial constraint is statistically significantly associated with low income and low savings. The relationship is predicted perfectly for adequate access to banking services.
Table 5.5: Summary of validity test results: children
| Household or individual | Item or activity | Low income | Low savings |
|---|---|---|---|
| Individual | School trips | *** | *** |
| Individual | School uniform or equipment | *** | NS |
| Individual | 3 meals a day | NS | PP |
| Individual | Fresh fruit or vegetables daily | *** | *** |
| Individual | Comfortable clothes | *** | *** |
| Individual | Outdoor space | NS | NS |
| Individual | Organised weekly activity | *** | *** |
| Individual | Friends round monthly | *** | *** |
| Individual | Toys or games age suitable | *** | *** |
| Individual | Enough bedrooms | *** | *** |
| Individual | Toddler, nursery or playgroup | ** | ** |
| Individual | Baby equipment | PP | PP |
| Individual | Place for homework | PP | PP |
| Individual | Annual break away from home | *** | *** |
| Household | Able to pay bills | *** | *** |
| Household | Money aside for unexpected expenses | *** | *** |
| Household | Replace or repair appliances | *** | *** |
| Household | Home in good state of decoration or repair | *** | *** |
| Household | Home adequately warm | *** | *** |
| Household | Home damp free | *** | *** |
| Household | Reliable internet | *** | *** |
| Household | Computer or tablet | *** | *** |
| Household | Reliable transport | *** | *** |
| Household | Heating, electrics and plumbing in good working order | *** | ** |
| Household | Banking services | PP | PP |
| Household | Green space | *** | *** |
| Household | Home contents insurance | *** | *** |
Source: Authors’ analysis of FRS test question dataset (April, May and June 2022).
Notes: PP predicts perfectly. Statistical significance level: *** p<0.01; ** p<0.05; * p<0.10; NS p>=0.10.
For pensioners, validity test results are presented for analysis based on financially constrained lack of items and activities (Table 5.6) and wider constrained lack (Table 5.7). All items and activities are statistically significantly associated with low-income and low-savings for financially constrained lack with the exception of ‘seeing friends and family at least monthly’ and ‘adequate access to banking services’ (low-income). For most items the level of statistical significance is 1% or higher. For two items, the association between financially constrained lack and low-income is only statistically significant at the 10% level (damp free home and heating, electrics and plumbing good working order).
Table 5.6: Summary of validity test results: pensioners (financially constrained lack)
| Individual or household | Item or activity | Low income | Low savings |
|---|---|---|---|
| Individual | Without regular money worries | *** | *** |
| Individual | Annual break away from home | *** | *** |
| Individual | Fresh fruit or vegetables daily | *** | *** |
| Individual | 3 meals a day | *** | *** |
| Individual | Regular dental appointments | *** | *** |
| Individual | Own mobile phone | *** | *** |
| Individual | Small amount of money for oneself | *** | *** |
| Individual | Go out socially monthly | *** | *** |
| Individual | See friends and family monthly | NS | NS |
| Household | Able to pay bills | *** | *** |
| Household | Money aside for unexpected expenses | *** | *** |
| Household | Replace or repair appliances | *** | *** |
| Household | Home in good state of decoration or repair | ** | *** |
| Household | Home adequately warm | *** | *** |
| Household | Home damp free | * | *** |
| Household | Reliable internet | *** | *** |
| Household | Computer or tablet | *** | *** |
| Household | Reliable transport | *** | *** |
| Household | Heating, electrics and plumbing in good working order | * | *** |
| Household | Banking services | NS | *** |
| Household | Green space | ** | *** |
| Household | Home contents insurance | *** | *** |
Source: Authors’ analysis of FRS test question dataset (April, May and June 2022).
Notes: Statistical significance level: *** p<0.01; ** p<0.05; * p<0.10; NS p>=0.10.
The validity test results using wider constrained lack to define deprivation of items for pensioners, show that the vast majority of candidate items and activities are highly statistically significantly associated with low-income and low savings (Table 5.7). The exceptions are ‘seeing friends and family monthly’ (low-income) and ‘adequate access to banking services’ (low savings). The level of statistical significance is 10% for ‘home in good state of decoration and repair’, ‘damp free home’ and ‘adequate access to banking services’ for the estimated association with low income.
Table 5.7: Summary of validity test results: pensioners (wider constrained lack)
| Individual or household | Item or activity | Low income | Low savings |
|---|---|---|---|
| Individual | Without regular money worries | *** | *** |
| Individual | Annual break away from home | *** | *** |
| Individual | Fresh fruit or vegetables daily | *** | *** |
| Individual | 3 meals a day | ** | *** |
| Individual | Regular dental appointments | *** | *** |
| Individual | Own mobile phone | ** | ** |
| Individual | Small amount of money for self | *** | *** |
| Individual | Go out socially monthly | *** | *** |
| Individual | See friends and family monthly | NS | *** |
| Household | Able to pay bills | *** | *** |
| Household | Money aside for unexpected expenses | *** | *** |
| Household | Replace or repair appliances | *** | *** |
| Household | Home in good state of decoration and repair | * | *** |
| Household | Home adequately warm | *** | *** |
| Household | Home damp free | * | *** |
| Household | Reliable internet | *** | *** |
| Household | Computer or tablet | *** | *** |
| Household | Reliable transport | *** | *** |
| Household | Heating, electrics and plumbing in good working order | *** | *** |
| Household | Banking services | * | NS |
| Household | Green space | *** | *** |
| Household | Home contents insurance | *** | *** |
Source: Authors’ analysis of FRS test question dataset (April, May and June 2022).
Notes: Statistical significance level: *** p<0.01; ** p<0.05; * p<0.10; NS p>=0.10.
5.4. Reliability testing
Reliability tests are used to assess the reliability (or consistency) of candidate items and derived composite scales for measuring material deprivation (discussed in Section 2.5.3 in the evidence review). The first set of reliability tests involve estimating Item Response Theory (IRT) models. The results from these models are used to test the reliability of each item by assessing estimates of severity and discrimination. The model estimates can be used to plot item characteristic curves (also known as item response functions) and model coefficients can be used to assess item discrimination and severity against pre-determined criteria. The aim is to identify a set of items which range in terms of degrees of severity and are good at discriminating between different degrees of deprivation.
Item severity is an estimate of the likely degree of material deprivation experienced by an individual who lacks that item due to a constraint (either financial constraint or wider constraint). Items with higher severity are associated with greater degrees of deprivation. Severity estimation in IRT models is based on estimating the probability that individuals who are deprived of a particular item, also lack other items included in the composite scale. Items with low severity scores are more likely to be lacked by people who lack few other items included in the scale. Conversely, items with high severity scores are more likely to be lacked by people who also lack many of the other items included in the scale. Items with very high or very low severity are considered candidates for omission as they add little additional information to the scale.
Item discrimination estimates in IRT models provide an assessment of how well constrained lack of an item discriminates between individuals with different degrees of material deprivation severity. For items with low discrimination, the probability of lacking the item due to a financial constraint varies little between people with different degrees of deprivation. Conversely, estimates of high discrimination identify items where the probability of lacking the item due to a financial constraints varies distinctly between people with low and high degrees of deprivation. Candidate items and activities which are poor at discriminating between the deprived and non-deprived should be considered for omission.
The second reliability test assesses the internal consistency of composite scales made up of all the items and activities. For this test, we estimate values of Cronbach’s coefficient alpha. Alpha values can be compared against minimum thresholds commonly used in the literature to assess whether a composite scale passes this test. Further tests are conducted to assess whether omitting each of the items in turn leads to an improvement in the internal consistency of the scales (leading to an increase in the estimated value of alpha).
5.4.1. Item characteristic curves
We begin by assessing the findings on item reliability through visual inspection of the item characteristic curves for working-age adults, children and pensioners before more formally assessing which items pass the statistical test against set criteria (these results are summarised in Tables 5.8 to 5.11 below).
The model results are presented for individual-level items and activities and household-level items and activities. The figures should be interpreted as follows: each item or activity is represented by a single item characteristic curve. The curves map the logistic function of the probability that a person experiencing a given level of deprivation will indicate that they lack an item due to a financial constraint (and wider constraint for pensioners). The steepness of a curve (the slope) represents how well an item discriminates between the deprived and non-deprived. The flatter the curve, the weaker an item is at discriminating between different degrees of deprivation.
The point at which a curve crosses 0.5 on the y-axis (where the probability of reporting that an item is lacked due to a financial constraint is 0.5) indicates the level of severity associated with that item (value of theta on the x-axis). The further to the right of the charts curves cross this point (the higher the value of theta), the greater degree of severity. Items with very high severity scores can be omitted from a material deprivation measure without any loss of information as they contribute very little to the measure. Items with low severity scores may be very low cost (only the most deprived individuals cannot afford to have these items) or other factors may affect the attainability of these items (for example, if there are costless options available). Items with very low severity scores can be omitted without any great loss of information. Ideally a composite material deprivation measure should include a mix of items and activities with varying degrees of severity.
Ideally we are looking for a set of items and activities with steep item characteristic curves distributed from left to right within acceptable bounds.
Beginning with working-age adults, individual-level (Figure 5.3) and household-level (Figure 5.4) items and activities which appear to be poor at discrimination include making regular payments to a workplace or private pension, having a mobile phone, access to green space and living in a damp free home. Items and activities associated with a high degree of severity (crossing the 0.5 point at high theta values) include having a mobile phone, access to green space and adequate access to banking services.
Next, assessing the reliability of items and activities for children (individual-level items Figure 5.5; household-level items Figure 5.6). A number of items appear to be poor at discriminating between different levels of severity. In particular, individual-level items include access to outdoor space or facilities nearby where children can play or hang out safely, school uniform and equipment, pre-school children attending toddler, nursery or playgroup on a weekly basis and having enough bedrooms so that children aged 10 years or older of a different sex don’t need to share. For household-level items and activities, they include adequate access to banking services, access to green space within walking distance and a damp free home. Items and activities associated with particularly high degrees of severity include access to outdoor space or facilities nearby where children can play or hang out safely and school uniform and equipment (both individual-level items), and adequate access to banking services and green space within walking distance (both household-level items).
Finally, for pensioners we assess reliability of items and activities based on financially constrained lack and wider constrained lack. For individual-level items and activities, poor levels of discrimination are found for not having regular money worries at the end of each month, seeing friends and family on a monthly basis and having a mobile phone, for both financially constrained lack and wider constrained lack (Figure 5.7 and Figure 5.9, respectively). Access to green space within walking distance and a damp-free home are household-level items with poor levels of discrimination for both financially constrained lack and wider constrained lack (Figure 5.8 and Figure 5.10, respectively). Additionally, for wider constrained lack, adequate access to banking services and access to adequate transport are also found to have poor levels of discrimination. A high degree of severity for both financially constrained lack and wider constrained lack is found for having a mobile phone and seeing friends and family on a monthly basis (both individual-level items), and adequate access to banking services and access to green space within walking distance (both household-level items).
Figure 5.3: Item characteristic curves: working-age adults – individual-level items
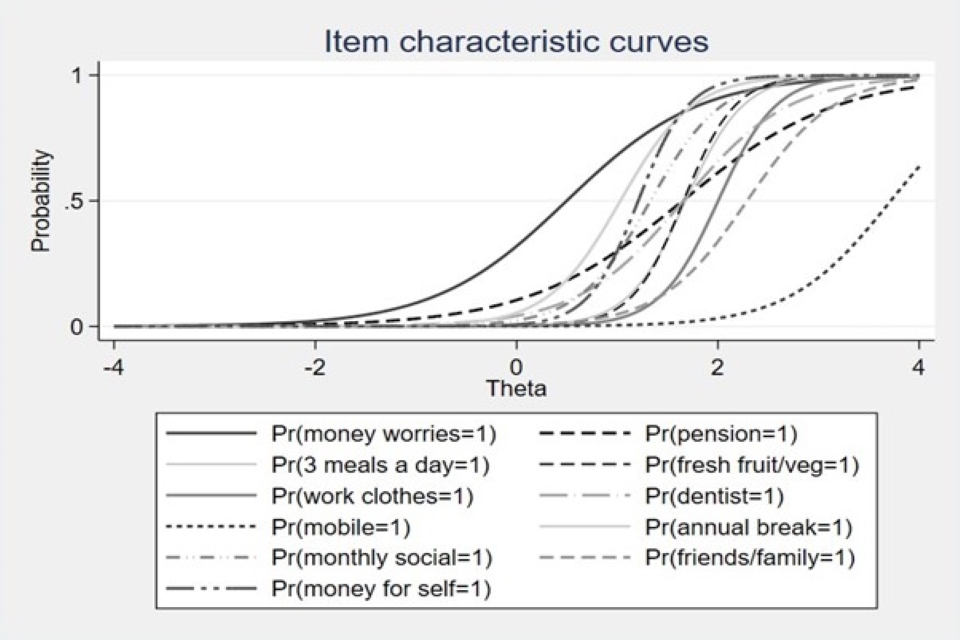
Figure 5.4: Item characteristic curves: working-age adults – household-level items
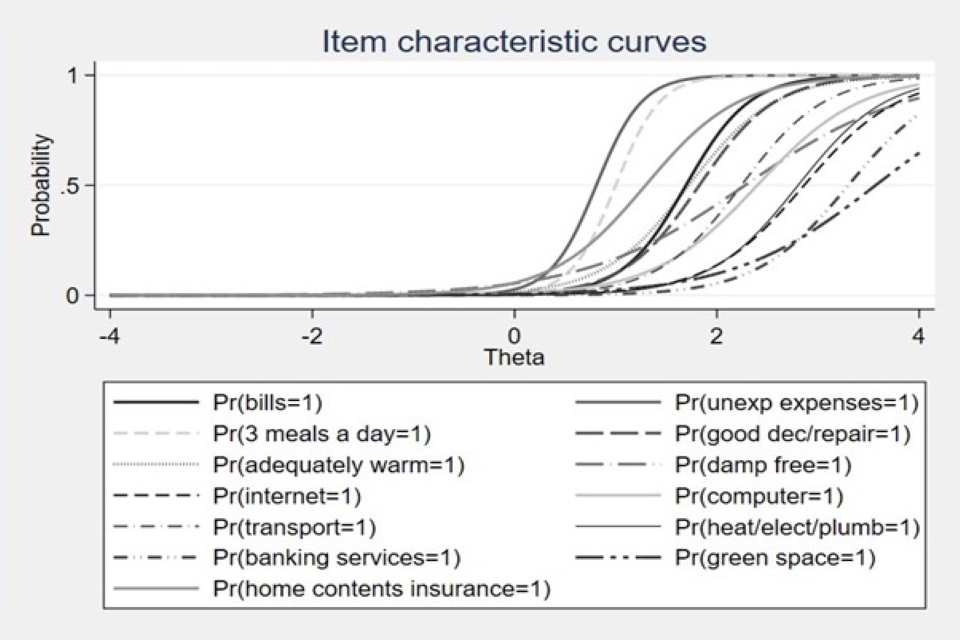
Figure 5.5: Item characteristic curves: children – individual-level items
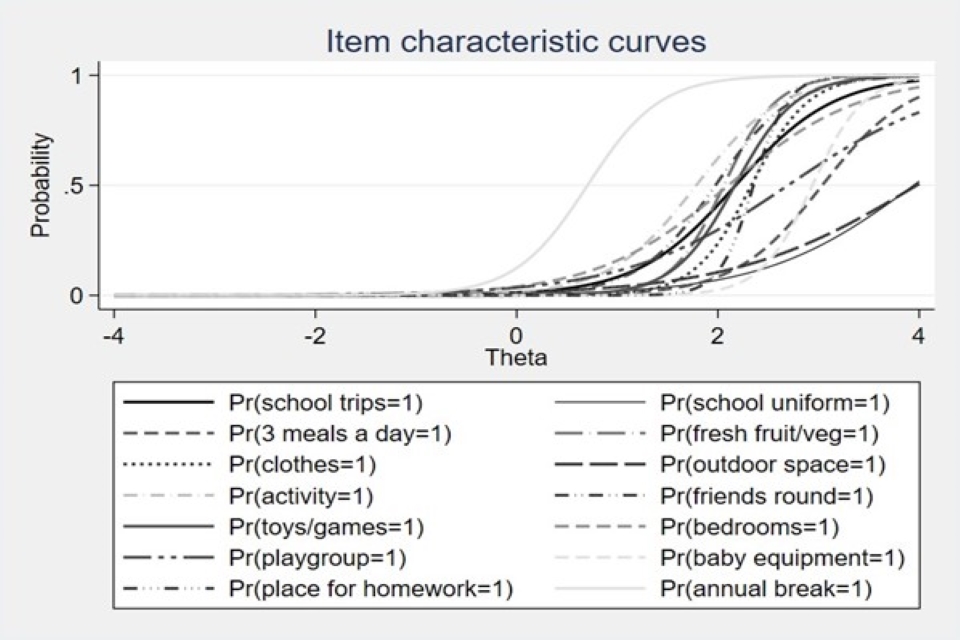
Figure 5.6: Item characteristic curves: children – household-level items
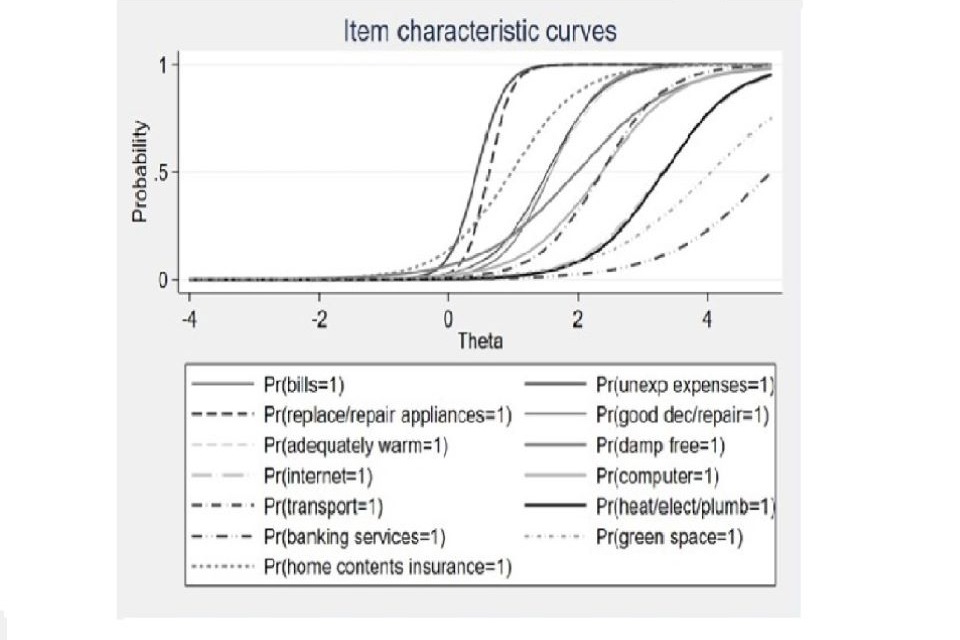
Figure 5.7: Item characteristic curves: pensioners (financial constraint) – individual-level items
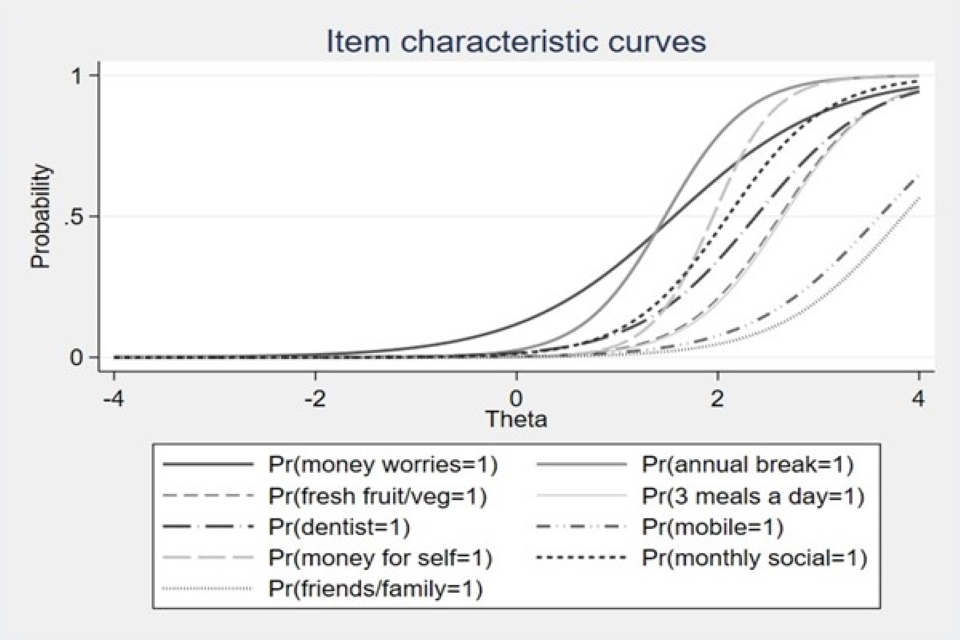
Figure 5.8: Item characteristic curves: pensioners (financial constraint) – household-level items
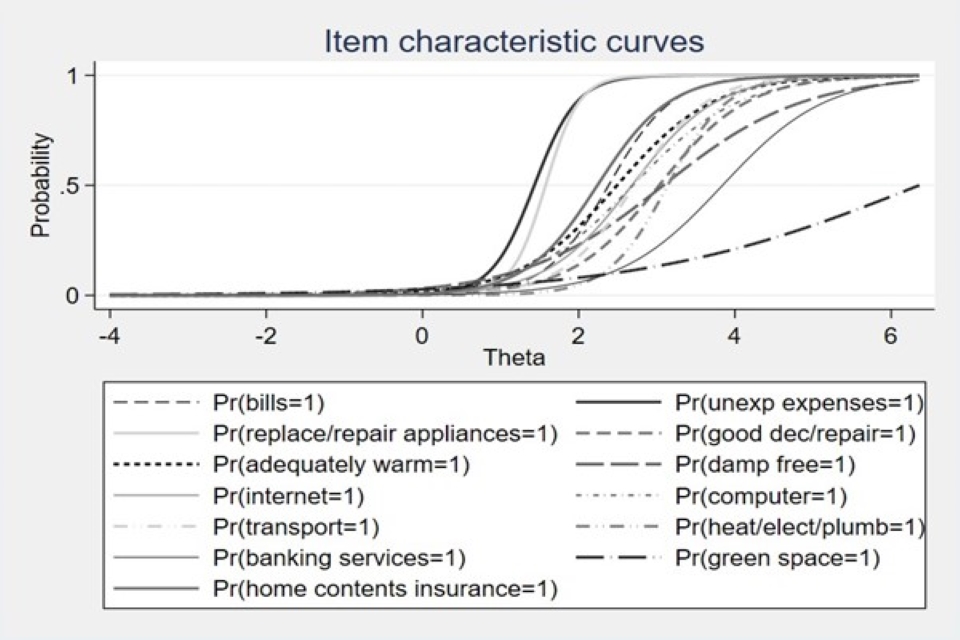
Figure 5.9: Item characteristic curves: pensioners (wider constraint) – individual-level items
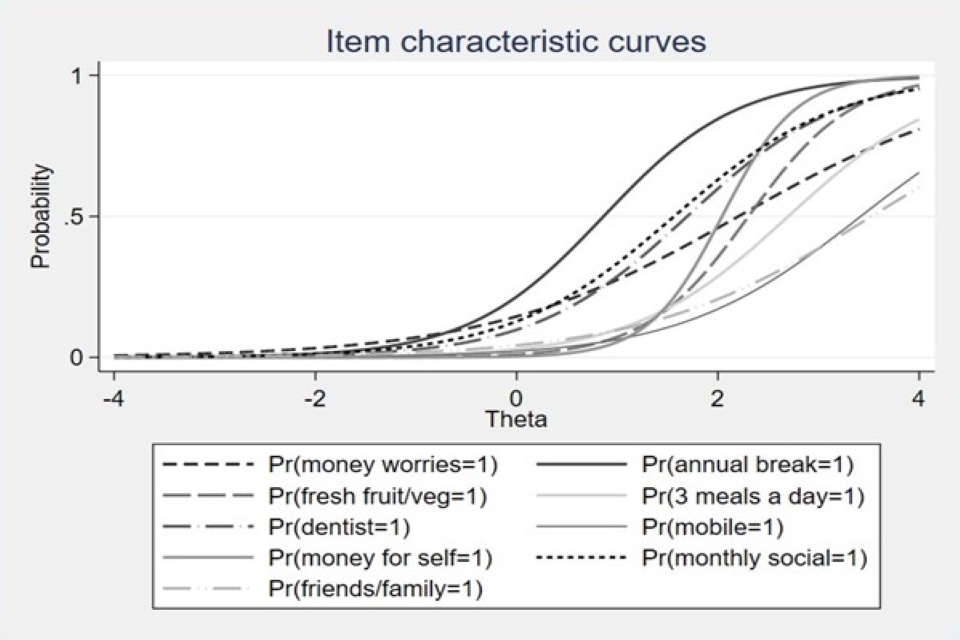
Figure 5.10: Item characteristic curves: pensioners (wider constraint) – household-level items
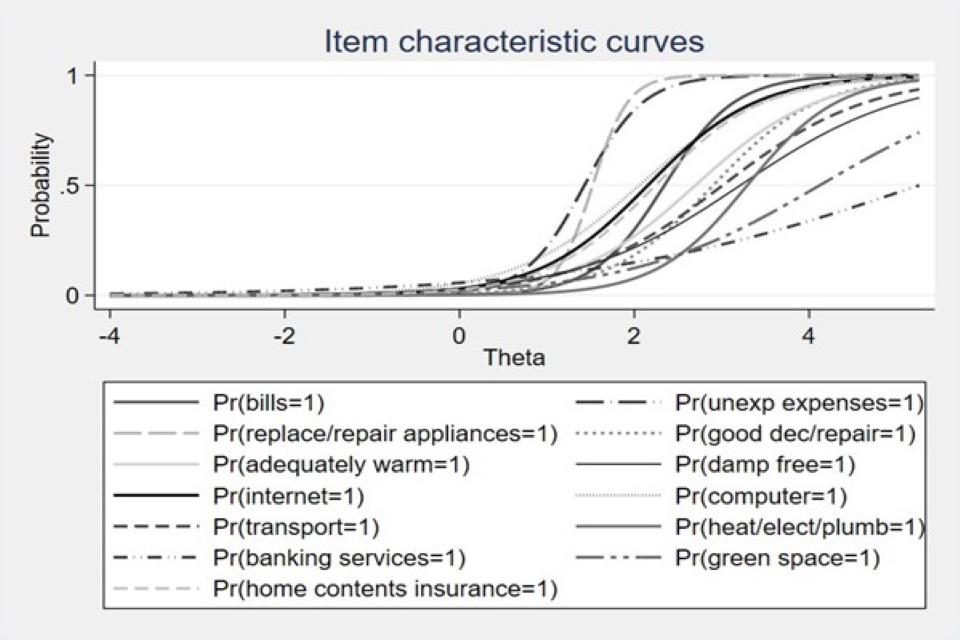
5.4.2. Reliability test results
More formally, we assess whether items and activities pass or fail reliability tests by comparing Item Response Theory model coefficients against pre-determined thresholds. Guio and others (2018) set a maximum severity threshold of 3 standard deviations from the mean to identify items which fail the severity test and severity levels between 3 and 3.5 to identify items with borderline fails. We adopt these thresholds to define three categories against which severity scores are assessed:
Pass = less than 3
Borderline fail = 3-3.5
Fail = greater than 3.5
Model estimates of discrimination scores indicate how well each item discriminates between the deprived and the non-deprived. We use three categories to assess discrimination scores:
Pass = greater than 1.8
Borderline fail = 1.5-1.8
Fail = less than 1.5
We assess overall material deprivation reliability for composite scales including all candidate items and activities for the three age groups and additionally for pensioners using the wider definition of constrained lack of items. Alpha estimates for overall material deprivation scale reliability are:
Working-age adults: Alpha = 0.883
Children: Alpha = 0.838
Pensioners: Alpha = 0.773
Pensioners (wider constrained lack): Alpha = 0.723
These estimates of internal consistency are within the acceptable range 0.7 to 0.9 (See Section 2.5.3). In the tables summarising results from the reliability tests (Tables 5.8 to 5.11), results for Alpha are based on the effect of omitting each item one at a time. An increase in Alpha suggests that the internal consistency of the scale improves if the item is left out, and this is shown as a test fail in the tables.
Starting with the results from the reliability tests for working-age adults (Table 5.8). The majority of items (individual-level and household-level) pass all three tests. There are a few exceptions. In relation to the household-level items, access to green space within walking distance fails the discrimination test, the severity test and the internal consistency test. Adequate access to banking services fails the internal consistency test and borderline fails the severity test. Damp free home fails the discrimination test. In relation to the individual-level items, mobile phone fails the severity test and the internal consistency test. Regular pension payments fails the discrimination test and no regular money worries borderline fails the discrimination test.
Table 5.8: Summary of reliability test results: working-age adults
| Individual or household | Item or activity | Severity | Discrimination | Alpha# |
|---|---|---|---|---|
| Individual | No regular money worries | B/Fail | ||
| Individual | Regular pension payments | Fail | ||
| Individual | 3 meals a day | |||
| Individual | Fresh fruit or vegetables daily | |||
| Individual | Clothes for work or job interview | |||
| Individual | Regular dental appointments | |||
| Individual | Own mobile phone | Fail | Fail | |
| Individual | Annual break away from home | |||
| Individual | Go out socially monthly | |||
| Individual | See friends and family monthly | |||
| Individual | Small amount of money for self | |||
| Household | Able to pay bills | |||
| Household | Money aside for unexpected expenses | |||
| Household | Replace or repair appliances | |||
| Household | Home in good state of decoration and repair | |||
| Household | Home adequately warm | |||
| Household | Home damp free | Fail | ||
| Household | Reliable internet | |||
| Household | Computer or tablet | |||
| Household | Reliable transport | |||
| Household | Heating, electrics and plumbing in good order | |||
| Household | Banking services | B/Fail | Fail | |
| Household | Green space | Fail | Fail | Fail |
| Household | Home contents insurance |
Source: Authors’ analysis of FRS test question dataset (April, May and June 2022).
Notes: Fail indicates an item failed the test; B/Fail indicates a borderline test result. # Alpha estimates are calculated using unweighted data.
For children, the majority of items and activities pass all three reliability tests with 15 out of 27 items passing these tests (Table 5.9). However, one individual-level item (school uniform and equipment) and two household-level items (adequate access to banking services and access to green space within walking distance) fail all three. Individual-level items which fail some of the tests are: access to outdoor space or facilities nearby where children can play or hang out safely which fails severity and discrimination tests, having enough bedrooms so that children over the age of 10 of a different sex don’t need to share and pre-school children attending weekly toddler, playgroup or nursery both fail the discrimination test and the internal consistency test. Baby equipment fails the internal consistency test. For household-level items, access to computer or tablet at home fails the discrimination test and heating, electrics and plumbing in good order fails the internal consistency test. Living in a damp-free home fails the discrimination test.
Table 5.9: Summary of reliability test results: children
| Individual or household | Item or activity | Severity | Discrimination | Alpha# |
|---|---|---|---|---|
| Individual | School trips | |||
| Individual | School uniform and equipment | Fail | Fail | Fail |
| Individual | 3 meals a day | B/Fail | ||
| Individual | Fresh fruit or vegetables daily | |||
| Individual | Comfortable clothes | |||
| Individual | Outdoor space | Fail | Fail | |
| Individual | Organised weekly activity | |||
| Individual | Friends round monthly | |||
| Individual | Toys or games age suitable | |||
| Individual | Enough bedrooms | B/Fail | Fail | Fail |
| Individual | Toddler, nursery or playgroup | B/Fail | Fail | Fail |
| Individual | Baby equipment | B/Fail | Fail | |
| Individual | Place for homework | |||
| Individual | Annual break away from home | |||
| Household | Able to pay bills | |||
| Household | Money aside for unexpected expenses | |||
| Household | Replace or repair appliances | |||
| Household | Home in good state of decoration and repair | |||
| Household | Home adequately warm | |||
| Household | Home damp free | Fail | ||
| Household | Reliable internet | B/Fail | B/Fail | |
| Household | Computer or tablet | Fail | ||
| Household | Reliable transport | |||
| Household | Heating, electrics and plumbing in good order | B/Fail | Fail | |
| Household | Banking services | Fail | Fail | Fail |
| Household | Green space | Fail | Fail | Fail |
| Household | Home contents insurance |
Source: Authors’ analysis of FRS test question dataset (April, May and June 2022).
Notes: Fail indicates an item failed the test; B/Fail indicates a borderline test result. # Alpha estimates are calculated using unweighted data.
Reliability tests for items and activities for pensioners were conducted for financially constrained lack (Table 5.10) and wider constrained lack (Table 5.11). More of the items and activities fail or borderline fail discrimination tests than for working-age adults or children. For financially constrained lack, seven items fail at least one reliability test. For wider constrained lack, 12 items fail at least one reliability test. A higher number of failed discrimination tests for constrained lack reflect the wider concept of deprivation which includes a greater range of possible reasons why pensioners might lack items (beyond financial constraint). It is, perhaps, not surprising that wider constrained lack of some of these items and activities is poorer at discriminating between deprived and non-deprived.
Notable reliability test results for financially constrained lack of individual-level items for pensioners are that seeing friends and family monthly fails the severity test and the internal consistency test, while mobile phone fails the severity test and being without regular money worries fails the discrimination test. For household-level items, access to green space within walking distance fails all three reliability tests and access to adequate banking services fails the severity test and the internal consistency test. Use of a computer or tablet at home and living in a damp-free home fail the discrimination test.
Table 5.10: Summary of reliability test results: pensioners (financial constraint)
| Individual or household | Item or activity | Severity | Discrimination | Alpha# |
|---|---|---|---|---|
| Individual | Without regular money worries | |||
| Individual | Annual break away from home | |||
| Individual | Fresh fruit or vegetables daily | |||
| Individual | 3 meals a day | |||
| Individual | Regular dental appointments | B/Fail | ||
| Individual | Own mobile phone | Fail | B/Fail | |
| Individual | Small amount of money for self | |||
| Individual | Go out socially monthly | |||
| Individual | See friends and family monthly | Fail | B/Fail | Fail |
| Household | Able to pay bills | |||
| Household | Money aside for unexpected expenses | |||
| Household | Replace or repair appliances | |||
| Household | Home in good state of decoration and repair | B/Fail | B/Fail | |
| Household | Home adequately warm | B/Fail | ||
| Household | Home damp free | B/Fail | Fail | |
| Household | Reliable internet | |||
| Household | Computer or tablet | Fail | ||
| Household | Reliable transport | |||
| Household | Heating, electrics and plumbing in good order | B/Fail | ||
| Household | Banking services | Fail | B/Fail | Fail |
| Household | Green space | Fail | Fail | Fail |
| Household | Home contents insurance |
Source: Authors’ analysis of FRS test question dataset (April, May and June 2022).
Notes: Fail indicates an item failed the test; B/Fail indicates a borderline test result. # Alpha estimates are calculated using unweighted data.
Table 5.11: Summary of reliability test results: pensioners (wider constraint)
| individual or household | Item or activity | IRT models - Severity | IRT models - Discrimination | Alpha# |
|---|---|---|---|---|
| Individual | Without regular money worries | Fail | ||
| Individual | Annual break away from home | Fail | ||
| Individual | Fresh fruit or vegetables daily | |||
| Individual | 3 meals a day | B/Fail | ||
| Individual | Regular dental appointments | Fail | ||
| Individual | Own mobile phone | Fail | Fail | Fail |
| Individual | Small amount of money for self | |||
| Individual | Go out socially monthly | Fail | ||
| Individual | See friends and family monthly | Fail | Fail | Fail |
| Household | Able to pay bills | |||
| Household | Money aside for unexpected expenses | |||
| Household | Replace or repair appliances | |||
| Household | Home in good state of decoration and repair | B/Fail | ||
| Household | Home adequately warm | B/Fail | ||
| Household | Home damp free | B/Fail | Fail | |
| Household | Reliable internet | Fail | ||
| Household | Computer or tablet | Fail | ||
| Household | Reliable transport | Fail | ||
| Household | Heating, electrics and plumbing in good order | B/Fail | ||
| Household | Banking services | Fail | Fail | Fail |
| Household | Green space | Fail | Fail | Fail |
| Household | Home contents insurance | B/Fail |
Source: Authors’ analysis of FRS test question dataset (April, May and June 2022).
Notes: Fail indicates an item failed the test; B/Fail indicates a borderline test result. # Alpha estimates are calculated using unweighted data.
5.5. Additivity testing
Additivity tests assess whether greater degrees of deprivation in terms of material deprivation scores are associated with poorer standards of living. Material deprivation scores are based on a simple count of the number of items and activities lacked. We assess additivity by regressing the number of items lacked due to a financial constraint (wider constraint for pensioners) against after housing cost equivalised net household income (Table 5.12).
The top panel of Table 5.12 contains the results for all individuals in the relevant age groups, including those who did not lack any of the candidate items or activities due to a financial constraint (wider constraint for pensioners). Overall the results show that the groups of candidate items and activities for the three age groups pass the additivity tests. The negative coefficients on the income variable indicate that higher levels of income are associated with lower material deprivation scores in the different age groups. All coefficients on the income variable are statistically significant at the 1% level. The lower panel of Table 5.12 is restricted to individuals who report that they lack at least one of the candidate items or activities due to a constraint (using the same restrictions as above). This is a select group of individuals who are likely to be more concentrated towards the lower end of the income distribution. The results show that there is a similar negative relationship between income and the number of items or activities which are lacked.
Table 5.12: OLS regression results - dependent variable: cumulative sum of items and activities lacked due to a financial constraint and wider constraint (pensioners)
| All | Working-age | Children | Pensioners | Pensioners (wider) |
|---|---|---|---|---|
| AHC income (natural log) | -1.737 | -1.480 | -0.728 | -0.842 |
| p-value | 0.000 | 0.000 | 0.000 | 0.000 |
| Observations | 4,812 | 1,868 | 2,385 | 2,385 |
| R-squared | 0.173 | 0.163 | 0.070 | 0.072 |
| Lacking at least one item | Working-age | Children | Pensioners | Pensioners (wider) |
|---|---|---|---|---|
| AHC income (natural log) | -1.785 | -1.052 | -0.535 | -0.631 |
| p-value | 0.000 | 0.000 | 0.000 | 0.000 |
| Observations | 2,679 | 923 | 913 | 913 |
| R-squared | 0.158 | 0.070 | 0.031 | 0.035 |
Source: Authors’ analysis of FRS test question dataset (April, May and June 2022).
Notes: Robust standard errors. Models include a constant term.
5.6. Assessment of items and activities with weak validity and reliability test results
Test items and activities were short-listed based on findings from the validity and reliability tests along with judgement which drew on other relevant information. This could include the relevance of a given item to a specific group, or evidence that only a small proportion of the population lacks an item. Items and activities which passed all statistical tests across the three age groups were short-listed for the revised material deprivation measures, as were items and activities which only failed or borderline failed one or two tests. In this section we provide an assessment of the items and activities with weak validity and reliability test results. They fail or borderline fail at least three tests (including failing at least one). These items were:
Adequate access to banking services (household-level)
Working-age adults: failed one reliability test (internal consistency) and one borderline reliability test (severity).
Children: perfectly predicts two validity tests (low income and low savings); failed three reliability tests (severity, discrimination, internal consistency).
Pensioners (financial constraint): failed one validity test (low income) and two reliability tests (severity, internal consistency) and one borderline reliability test (discrimination).
Pensioners (wider constraint): failed one validity test (low savings), one borderline validity test (low income) and failed three reliability tests (severity, discrimination, internal consistency).
Other relevant information: only 0.5% of respondents in the FRS test question dataset lacked adequate access to banking services due to a reported financial constraint. In its current formulation this item is not working well. This is likely to be due to other constraints affecting access (for example, transport for physical access or digital exclusion for online access). A greater share of pensioners lack this item based on wider constraint (6.4%).
Access to green space within walking distance (household-level)
Working-age adults: failed two reliability tests (severity, internal consistency) and one borderline reliability test (discrimination).
Children: failed three reliability tests (severity, discrimination, internal consistency).
Pensioners (financial constraint): failed three reliability tests (severity, discrimination, internal consistency).
Pensioners (wider constraint): failed three reliability tests (severity, discrimination, internal consistency).
Other relevant information: In its current formulation this item is not working well. This is likely to be due to other constraints affecting access to green space such as living in urban versus rural areas and mobility constraints.
Live in a damp free home (household-level)
Working-age adults: failed one reliability test (discrimination).
Children: failed one reliability test (discrimination).
Pensioners (financial constraint): one borderline validity test (low income), failed one reliability test (discrimination) and one borderline reliability test (severity).
Pensioners (wider constraint): one borderline validity test (low income), failed one reliability test (discrimination) and one borderline reliability tests (severity).
Other relevant information: although this item does not appear to be working well for pensioners, there is a case for keeping it to aid the development of a whole population measure. It is clearly an important element of deprivation and has strong support based on the share of respondents who indicated that living in a damp free home is a necessity (92%). The poor discrimination results suggest that some more advantaged households are also living in damp homes. Defining lack due to a financial constraint may not be working well for this item for individuals living in rental accommodation as it is landlords’ responsibility to ensure homes are damp free.
Own mobile phone (individual-level: working-age adults and pensioners)
Working-age adults: failed two reliability tests (severity, internal consistency).
Pensioners (financial constraint): failed one reliability test (severity) and one borderline reliability test (discrimination).
Pensioners (wider constraint): failed three reliability tests (severity, discrimination and internal consistency).
Other relevant information: only a very small proportion of working-age adults in the FRS test question dataset lacked a mobile phone due to a financial constraint (0.5%). This proportion is only slightly higher for pensioners (1.1%). In the future we do not expect mobile phone ownership rates to decline or the proportion of the population who lack a mobile phone due to a financial constraint to increase without a significant fall in living standards or substantial increases in the cost of this item.
See friends and family at least once a month (individual-level: working-age adults and pensioners)
Pensioners (financial constraint): failed two validity tests (low income, low savings), failed two reliability tests (severity and internal consistency) and one borderline reliability test (discrimination).
Pensioners (wider constraint): failed one validity test (low income) and failed three reliability tests (severity, discrimination, internal consistency).
Other relevant information: this activity passed all tests for working-age adults and represents an important dimension of social deprivation not picked up by other items or activities included in the measures. There appear to be other factors affecting pensioners’ deprivation of this activity or their assessment of whether or not this activity is wanted or needed. Given the activity’s importance, the fact that it passed all tests for working-age adults, and to aid the potential development of a whole population measure, there is a strong case for keeping this activity.
All items of school uniform and equipment required by the school, including sports kit (individual-level: children)
Children: failed one validity test (low savings) and three reliability tests (severity, discrimination, internal consistency).
Other relevant information: this test item does not appear to be picking up deprivation and may underestimate the share of children who are deprived of school uniform and equipment due to financial constraints. In the FRS test question dataset, only 2% of children were living in a benefit unit where at least one school age child lacked at least part of their school uniform and equipment, only 1.1% due to a financial constraint. Although the cost of this item can be high, many schools have taken steps to reduce the cost of school uniform, many offer second-hand items for sale and parents pass on items of school uniform. Previous research using data from household surveys has also found that only a small proportion of school age children are estimated to lack all the school uniform required by their school (see, for example, McKay, 2011).
Outdoor space or facilities nearby where child(ren) can play or hang out safely (individual-level: children)
Children: failed two validity tests (low income and low savings) and two reliability tests (severity, discrimination).
Other relevant information: lacking access to outdoor space or facilities nearby where children can play or hang out, does not appear to be linked to financial constraints but there could be other factors which limit access to such space such as where children live.
Enough baby equipment such as cot, highchair and pram or pushchair (individual-level: children)
Children: perfectly predicts two validity tests (low income and low savings), failed one reliability test (internal consistency) and borderline fails one reliability test (severity).
Other relevant information: the baby equipment item applies to 715 children in the FRS test question data sample (children living in the same Benefit Unit as a child under 4) but only two of these children are classified as lacking this item due to a financial constraint. This incidence is far too small for meaningful analysis or inclusion and explains why there is perfect prediction in the validity tests.
5.7. Summary of recommendations in relation to items and activities with weak validity and reliability test results
After considering the validity and reliability test results (all items and activities passed the suitability tests), other relevant information and discussion with experts on the project advisory group, the following recommendations were made in relation to the test items and activities with weak validity and reliability test results:
Recommended omitting six test items
Test results, and in some cases consideration of other relevant information, led to a recommendation to omit the following six items from the revised material deprivation measures:
Household-level items:
Adequate access to banking services
Access to green space within walking distance
Individual-level items:
Working-age adults and pensioners:
Own mobile phone
Children:
All items of school uniform and equipment required by the school, including sports kit
Outdoor space or facilities nearby where child(ren) can play or hang out safely
Enough baby equipment such as cot, highchair and pram or pushchair
Recommended retaining two test items, despite some weaknesses
Household-level items and activities:
Damp free home – poor discrimination results suggest that some more advantaged households also live in damp homes. Defining lack due to a financial constraint may not be working well for this item for individuals living in rental accommodation as it is landlords’ responsibility to ensure homes are damp free. This item is weaker for pensioners but appears to work well for working-age adults and children and its inclusion could aid the development of a whole population measure.
Individual-level items and activities:
Working-age adults and pensioners:
See friends and family at least once a month – while this activity fails or borderline fails the reliability tests for pensioners, it passes all reliability tests for working-age adults. This activity measures an important dimension of social deprivation and retaining it could aid the development of a whole population measure.
Recommended using simple absence for the following items:
Household-level items:
Damp free home
Keep home adequately warm in cold weather
In the current material deprivation measures, deprivation status for some items is based solely on simple absence (i.e. the reason for lacking these items and activities is not taken into account). These are: able to keep up with bills and regular debt repayments, able to pay an unexpected expense of £200, outdoor space or facilities nearby where children can play safely. As outlined in Section 4.3, for a small number of additional test items simple absence was considered sufficient for indicating material deprivation and no follow-up question was asked to establish why an item or activity is lacked. They are:
Do you have access to green space within walking distance?
Does your child/do your children have outdoor space or facilities nearby where they can play or hang out safely?
Do you regularly have money worries at the end of the month?
As shown above, neither access to green space nor children having outdoor space or facilities nearby were included in the final set of items and activities due to not meeting the selection criteria based on validity and reliability test results and other relevant information.
Careful consideration and consultation with experts on the project Advisory Group led to the conclusion that simple absence of a damp free home and a home which is adequately warm in cold weather is sufficient to determine being materially deprived of these items. If asked, respondents may indicate that they lack these items for a reason other than a financial constraint. However, this is most likely due to factors such as living in rented accommodation where it is the landlord’s responsibility to keep the home damp free or ensure that it has an adequate, functioning heating system. If the boiler breaks down it is not the tenant who is responsible for fixing the boiler whether or not they could afford to pay for the boiler to be fixed or replaced. Indirectly, individuals may lack these items due to financial constraints (i.e. they cannot afford to own their own home or can only afford to rent properties which are in a poor condition) but this may not be clear from responses to questions asking about reasons why these items are lacked.
In addition, having enough bedrooms so that children aged 10 years or older don’t need to share a bedroom with another child of a different sex, was also coded using simple absence. Focus group participants were under the impression that this was a legal requirement (see Section 3.5.10), and although this is not the case (see footnote 4), it is used to assess overcrowding in the allocation of social housing and for the calculation of local housing allowance rates in Universal Credit[footnote 9]. The sample size for this item is small in the test question dataset as it is only relevant for children living in benefit units with at least two children, one of which is aged 10+ and of a different sex to another child living in the benefit unit. While we think there is a strong rationale for applying simple absence to this item, which we do in the analysis presented in this report, we suggest that DWP reviews the coding of this item using the larger sample size which will be available in FRS 2023/2024.
After omitting the six test items and activities which failed to meet the selection criteria and applying simple absence to damp free home and adequately warm home, the reliability and additivity tests were repeated. The test results can be found in Appendix 3.
6. Reliability and additivity tests on core household-items
To aid the potential development of a whole population material deprivation measure, we separately conducted reliability and additivity tests for the core household-level items. For these items, information is collected from one household member and applies to all household members. There was no need to repeat the tests for suitability and validity as the results presented earlier apply to each of the items and activities in isolation. This Chapter presents:
-
Results from reliability and additivity tests for the core household-items
-
An assessment of the results from the reliability tests which shows that adequate access to banking services and access to green space within walking distance consistently fail the reliability tests for discrimination and severity as well as the internal consistency tests (the one exception is adequate access to banking services for the child sample).
-
A comparison between these results with the assessment made in Chapter 5 where household-level items and individual-level items were considered together. This leads to the same conclusion that adequate access to banking services and access to green space within walking distance fail the test criteria and should not be included in revised material deprivation measures.
The reliability and additivity tests analyse composite measures which are here based solely on the household-level items and activities. Separate analysis is conducted for the three age groups (working-age adults, children and pensioners) and across the whole population (all age).
6.1. Reliability tests on core household-items
As a reminder, the Item Response Theory models test for severity and discrimination. To assess model estimates for severity, we use the same thresholds as in Section 5.4 to define three categories:
Pass = less than 3
Borderline fail = 3-3.5
Fail = greater than 3.5
Model estimates of discrimination scores indicate how well each item discriminates between the deprived and the non-deprived. We used the same three categories as in Section 5.4 to assess the discrimination scores:
Pass = greater than 1.8
Borderline fail = 1.5-1.8
Fail = less than 1.5
We assess overall material deprivation reliability for composite scales based only on the household-level items for the three age groups and additionally for pensioners using the wider definition of constrained lack of items. Alpha estimates for overall material deprivation scale reliability are:
Working-age adults: Alpha = 0.788
Children: Alpha = 0.769
Pensioners: Alpha = 0.658
Pensioners (constrained lack): Alpha = 0.638
All (financially constrained lack): Alpha = 0.773
Not all of these estimates of internal consistency of the scales are within the acceptable range 0.7 to 0.9 (See Section 2.5.3). Estimates for pensioners are lower than 0.7 and, therefore, fail this test. Overall, the estimates are lower for each age group than for scales which include individual-level as well as household-level items and activities (shown in Section 5.4).
In the following tables summarising results from the reliability tests (Tables 6.1 to 6.5), results for Alpha are based on the effect of omitting each item one at a time. An increase in Alpha suggests that the internal consistency of the scale improves if the item is left out, and this is shown as a test fail in the tables.
For working-age adults, reliability test results for household-items alone (Table 6.1) are very similar to the results estimated in models which include household and individual level items (shown above in Table 5.8). Damp free home fails the discrimination test, adequate access to banking services and access to green space within walking distance both fail the consistency test, access to green space also fails the discrimination test. Adequate access to banking services performs less well in the severity test: failing this test in the model based on household-level items alone but borderline fails in the model which includes household and individual level items (Table 5.8).
Table 6.1: Summary of reliability test results for household-items: Working-age adults
| Item or activity | Severity | Discrimination | Alpha# |
|---|---|---|---|
| Able to pay bills | |||
| Money aside for unexpected expenses | |||
| Replace or repair appliances | |||
| Home in good state of decoration and repair | |||
| Home adequately warm | |||
| Home damp free | Fail | ||
| Reliable internet | |||
| Computer or tablet | |||
| Reliable transport | |||
| Heating, electrics and plumbing in good order | |||
| Banking services | Fail | Fail | |
| Green space | Fail | Fail | Fail |
| Home contents insurance |
Source: Authors’ analysis of FRS test question dataset (April, May and June 2022).
Notes: Fail indicates an item failed the test; B/Fail indicates a borderline test result. # Alpha estimates are calculated using unweighted data.
For children, again the reliability test results are the same in the models with only household-items (Table 6.2) as in the models which include individual as well as household-level items (shown above in Table 5.9). Access to green space within walking distance and adequate access to banking services fail all three reliability tests (severity, discrimination and internal consistency). Heating, electrics and plumbing in good working order fails the consistency test and borderline fails the severity test. Living in a damp free home and access to a computer or tablet at home both fail the discrimination test. Access to reliable internet at home borderline fails the discrimination test and the severity test (Table 5.9).
Table 6.2: Summary of reliability test results for household-items: Children
| Item or activity | Severity | Discrimination | Alpha# |
|---|---|---|---|
| Able to pay bills | |||
| Money aside for unexpected expenses | |||
| Replace or repair appliances | |||
| Home in good state of decoration and repair | |||
| Home adequately warm | |||
| Home damp free | Fail | ||
| Reliable internet | B/Fail | B/Fail | |
| Computer or tablet | Fail | ||
| Reliable transport | |||
| Heating, electrics and plumbing in good order | B/Fail | Fail | |
| Banking services | Fail | Fail | Fail |
| Green space | Fail | Fail | Fail |
| Home contents insurance |
Source: Authors’ analysis of FRS test question dataset (April, May and June 2022).
Notes: Fail indicates an item failed the test; B/Fail indicates a borderline test result. # Alpha estimates are calculated using unweighted data.
For pensioners, using financial constraint to determine deprivation of items, we again observe very similar reliability test results in the models with only household-level items (Table 6.3) as in the models with household and individual level items (shown in Table 5.10 above). Access to green space within walking distance fails all three reliability tests (severity, discrimination and consistency). Access to adequate banking services also fails all three reliability tests in the models with only household-level items but borderline fails the discrimination test in the models with household and individual level items. Home adequately warm fails the discrimination test in in the models with only household-level items but borderline fails the discrimination test in the models with household and individual level items. More household items fail reliability tests for pensioners than for working-age adults (Table 6.1).
The results from reliability tests using wider constraint to determine deprivation of items for pensioners, are the same in the models with only household-items (Table 6.4) and the models which include both household and individual level items (shown in Table 5.11 above). There are two exceptions: access to reliable transport borderline fails the severity test and home contents insurance borderline fails the discrimination test. Again, adequate access to banking services and access to green space within walking distance fail all three reliability tests. In both models, damp free home, access to computer or tablet at home, reliable internet at home and access to reliable transport fail the discrimination test.
Table 6.3: Summary of reliability test results for household-items: Pensioners (financially constrained lack)
| Item or activity | Severity | Discrimination | Alpha# |
|---|---|---|---|
| Able to pay bills | |||
| Money aside for unexpected expenses | |||
| Replace or repair appliances | |||
| Home in good state of decoration and repair | B/Fail | ||
| Home adequately warm | Fail | ||
| Home damp free | B/Fail | Fail | |
| Reliable internet | |||
| Computer or tablet | Fail | ||
| Reliable transport | |||
| Heating, electrics and plumbing in good order | B/Fail | ||
| Banking services | Fail | Fail | Fail |
| Green space | Fail | Fail | Fail |
| Home contents insurance |
Source: Authors’ analysis of FRS test question dataset (April, May and June 2022).
Notes: Fail indicates an item failed the test; B/Fail indicates a borderline test result. # Alpha estimates are calculated using unweighted data.
Table 6.4: Summary of reliability test results for household-items: Pensioners (wider constrained lack)
| Item or activity | IRT models - Severity | IRT models - Discrimination | Alpha# |
|---|---|---|---|
| Able to pay bills | |||
| Money aside for unexpected expenses | |||
| Replace or repair appliances | |||
| Home in good state of decoration and repair | B/Fail | ||
| Home adequately warm | B/Fail | ||
| Home damp free | B/Fail | Fail | |
| Reliable internet | Fail | ||
| Computer or tablet | Fail | ||
| Reliable transport | B/Fail | Fail | |
| Heating, electrics and plumbing in good order | B/Fail | ||
| Banking services | Fail | Fail | Fail |
| Green space | Fail | Fail | Fail |
| Home contents insurance |
Source: Authors’ analysis of FRS test question dataset (April, May and June 2022).
Notes: Fail indicates an item failed the test; B/Fail indicates a borderline test result. # Alpha estimates are calculated using unweighted data.
For the household items it is possible to estimate reliability models for the whole population. The results show that adequate access to banking services, access to green space within walking distance fail all three reliability tests (Table 6.5). This is not surprising given these items fail these tests in the separate age groups models.
Table 6.5: Summary of reliability test results for household-items: All ages (financially constrained lack)
| Item or activity | Severity | Discrimination | Alpha# |
|---|---|---|---|
| Able to pay bills | |||
| Money aside for unexpected expenses | |||
| Replace or repair appliances | |||
| Home in good state of decoration and repair | |||
| Home adequately warm | |||
| Home damp free | Fail | ||
| Reliable internet | B/Fail | B/Fail | |
| Computer or tablet | B/Fail | ||
| Reliable transport | |||
| Heating, electrics and plumbing in good order | |||
| Banking services | Fail | Fail | Fail |
| Green space | Fail | Fail | Fail |
| Home contents insurance |
Source: Authors’ analysis of FRS test question dataset (April, May and June 2022).
Notes: Fail indicates an item failed the test; B/Fail indicates a borderline test result. # Alpha estimates are calculated using unweighted data.
6.2. Additivity tests on core household-items
Additivity tests assess whether greater degrees of deprivation in terms of higher material deprivation scores (more items and activities lacked by individuals) are associated with poorer standards of living. We assess additivity by regressing the number of household items lacked due to a financial constraint against after housing cost equivalised net household income. The final column contains model estimates for the whole population sample (all age). In each regression model, the coefficient on the income variable is negative and highly statistically significant (less than 1%) which means that higher income is associated with lower material deprivation scores (Table 6.6). The exception is for pensioners in the model which restricts the sample to individuals who lack at least one household item, for which the model is a poor fit.
Table 6.6: OLS regression results - dependent variable: cumulative sum of household items and activities lacked due to a financial constraint
| All | Working-age | Children | Pensioners | All age |
|---|---|---|---|---|
| AHC income (natural log) | -0.841 | -1.052 | -0.409 | -0.818 |
| p-value | 0.000 | 0.000 | 0.000 | 0.000 |
| Observations | 4,812 | 1,868 | 2,385 | 9,490 |
| R-squared | 0.165 | 0.175 | 0.066 | 0.151 |
| Lacking at least one item | Working-age | Children | Pensioners | All age |
|---|---|---|---|---|
| AHC income (natural log) | -0.700 | -0.674 | -0.080 | -0.629 |
| p-value | 0.000 | 0.000 | 0.305 | 0.000 |
| Observations | 1,624 | 855 | 567 | 3,100 |
| R-squared | 0.086 | 0.071 | 0.002 | 0.070 |
Source: Authors’ analysis of FRS test question dataset (April, May and June 2022).
Notes: Robust standard errors. Models include a constant term.
6.3. Assessment of reliability and additivity test results for core household items
An exclusive focus on core household test items which apply to the whole population leads to the same conclusion in terms of recommendations for which of the household-level test items should be short-listed and which should be omitted. Adequate access to banking services and access to green space within walking distance consistently fail the reliability tests for discrimination and severity as well as the internal consistency tests (the one exception is adequate access to banking services for the child sample which passes the discrimination test).
After omitting the two household test items which failed to meet the selection criteria and applying simple absence to damp free home and adequately warm home, the reliability and additivity tests were repeated. The test results can be found in Appendix 4.
7. Recommended items and activities for the revised UK material deprivation measures
The recommendations made for revising the items and activities in the material deprivation measures for working-age adults, children and pensioners, the new question routing using the two-step approach outlined in Section 4.3 and the standardised set of options for reasons why any items are lacked were approved by the Review’s Steering Group. A revised set of questions was included in the 2023/2024 Family Resources Survey. To aid assessments of the impact of moving to revised material deprivation measures on estimates of material deprivation, the 2023/2024 FRS sample is split with 75% of respondents asked the revised questions and 25% asked the previous questions. From 2024/2025, only the new questions will be asked.
This Chapter:
-
shows the final sets of questions included in the FRS which will be used to derive revised material deprivation measures
-
details how each age-group specific material deprivation measure (working-age adults, children and pensioners) include household-level and individual-level items and activities
-
demonstrates the way in which household-level items and activities are standardised across all three groups with one member of each household answers questions related to these items
-
outlines differences in individual-level items and activities between age specific groups and shows which items are common to all three age groups
7.1. Working-age adults: final set of items and activities
The revised material deprivation measure for working-age adults comprises 21 items and activities: 11 household-level items and 10 individual-level items. This is a much greater total number of items than in the previous working-age material deprivation measure which included nine items (see Table A1.3). The FRS questions for items included in the revised working-age adult measure are:
Household-level items
- Without cutting back on essentials, are you able to pay regular bills like rent, mortgage, electricity or Council tax (if GB) or Rates (if NI)?
- Are you able to put money aside to cover unexpected expenses?
- Could you cover the cost of replacing or repairing appliances such as a washing machine, fridge or cooker if they broke?
- Is your home kept in a good state of decoration and repair?
- In cold weather, is your home kept adequately warm?
- Is your home damp free?
- Do you have reliable access to the internet at home?
- Does everyone in your household have use of a computer or tablet for work, education or accessing services?
- Does everyone in your household have access to transport that is reliable, timely, safe and affordable?
- Are your heating, electrics, plumbing, drains in good working order?
- Do you have home contents insurance?
Individual-level items
- Do you regularly have money worries at the end of the month?
- Do you make regular payments to a workplace or private pension?
- Do you eat three meals a day?
- Do you eat fresh fruit and/or vegetables every day?
- Do you have appropriate clothes for work or job interview?
- Do you attend regular dental appointments?
- Do you (your partner and your dependent children) have a break away from home at least once a year?
- Do you go out socially at least once a month?
- Do you see friends and family at least once a month?
- Do you have a small amount of money to spend each week on yourself (not on your family)?
7.2. Children: final set of items and activities
The revised child material deprivation measure comprises 22 items and activities: 11 household-level items and 11 individual-level items. This is a similar total number of items as the previous child measure which included 21 items and activities (see Table A1.1). The FRS questions for items included in the revised child material deprivation measure are:
Household-level items
- Without cutting back on essentials, are you able to pay regular bills like rent, mortgage, electricity or Council tax (if GB) / Rates (if NI)?
- Are you able to put money aside to cover unexpected expenses?
- Could you cover the cost of replacing or repairing appliances such as a washing machine, fridge or cooker if they broke?
- Is your home kept in a good state of decoration and repair?
- In cold weather, is your home kept adequately warm?
- Is your home damp free?
- Do you have reliable access to the internet at home?
- Does everyone in your household have use of a computer or tablet for work, education or accessing services?
- Does everyone in your household have access to transport that is reliable, timely, safe and affordable?
- Are your heating, electrics, plumbing, drains in good working order?
- Do you have home contents insurance?
Individual-level items
- Do you (your partner and your dependent children) have a break away from home at least once a year?
- [Does/Do Name(s) of children in Benefit Unit who attend school] go on school trips? (asked if children at school)
- [Does/Do [Name(s) of children in Benefit Unit who attend school] have a suitable place at home to do homework?
- [Does your child/do your children] eat three meals a day?
- [Does your child/do your children] eat fresh fruit and/or vegetables every day?
- [Does your child/do your children] have enough clothes that they feel comfortable to wear?
- [Does your child/do your children] attend at least one regular organized activity a week outside school, such as sport or a youth group?
- [Does your child/do your children] have friends round to play, have a snack or hang out once a month?
- [Does your child/do your children] have enough toys, games and outdoor equipment suitable for their age?
- Are there enough bedrooms for every child of 10 or over of a different sex to have their own bedroom? (asked if 2 or more children in BU aged 10+ of a different sex)
- [Does/Do [Name(s) of children in Benefit Unit under 6 and do not attend primary or private school] go to toddler group / nursery / playgroup at least once a week?
7.3. Pensioners: final set of items and activities
The revised pensioner material deprivation measure comprises 19 items and activities: 11 household-level items and 8 individual-level items. This measure applies to adults who have reached the State Pension Age. This is a greater total number of items than in the previous pensioner measure which included 15 items (see Table A1.2). The FRS questions for items included in the revised pensioner measure are:
Household-level items
- Without cutting back on essentials, are you able to pay regular bills like rent, mortgage, electricity or Council tax (if GB) or Rates (if NI)?
- Are you able to put money aside to cover unexpected expenses?
- Could you cover the cost of replacing or repairing appliances such as a washing machine, fridge or cooker if they broke?
- Is your home kept in a good state of decoration and repair?
- In cold weather, is your home kept adequately warm?
- Is your home damp free?
- Do you have reliable access to the internet at home?
- Does everyone in your household have use of a computer or tablet for work, education or accessing services?
- Does everyone in your household have access to transport that is reliable, timely, safe and affordable?
- Are your heating, electrics, plumbing, drains in good working order?
- Do you have home contents insurance?
Individual-level items
- Do you regularly have money worries at the end of the month?
- Do you (your partner and your dependent children) have a break away from home at least once a year?
- Do you eat fresh fruit or vegetables every day?
- Do you eat three meals a day?
- Do you attend regular dental appointments?
- Do you have a small amount of money to spend each week on yourself (not on your family)?
- Do you go out socially at least once a month?
- Do you see friends and family at least once a month?
7.4. Summary of the final sets of items and activities in the revised measures
The final sets of household-level and individual-level items and activities for the working-age, child and pensioner material deprivation measures are summarised in Table 7.1. This shows the common set of household-level items included in all three measures and three further individual-level items which are common to each age group measure (three meals a day; fresh fruit or vegetables daily and an annual break away from home). In addition, similarities in the working-age adult and the pensioner measures in terms of items and activities are evident; the only difference being that the working-age adult measure includes two additional individual-level items (regular pension payments and suitable clothes for work or job interview).
The main differences between the existing working-age and pensioner measures is that a wider set of reasons for lacking items or activities is used to determine deprivation of an item or activity, and material deprivation status is combined with a low-income threshold for working-age adults in the headline series. We explore these methodological aspects of the measures further in Chapter 8. Commonalities in terms of using a core set of household-level items, some of the same individual-level items and a harmonised set of options establishing why any item or activity is lacked (except for items for which simple absence is used to establish deprivation), were, in part, introduced to aid the ability to compare material deprivation between age groups and to facilitate the possibility of devising and testing a whole population measure. We explore this further in Chapter 8. In addition, the introduction of a common set of household-level items means that questions for these items only need to be answered by one person in each household, thus reducing the survey time burden on households relative to collecting this information from an adult in each BU or from each working-age adult and adult aged over SPA in mixed age BUs.
Table 7.1: Items and activities in the revised material deprivation measures
| Household level or individual level | Item or activity | Working-age | Children | Pensioners |
|---|---|---|---|---|
| Household level | Able to pay bills without cutting back on essentials* | Yes | Yes | Yes |
| Household level | Able to put money aside for unexpected expenses* | Yes | Yes | Yes |
| Household level | Cover cost of repair or to replace appliances | Yes | Yes | Yes |
| Household level | Home in good state of decoration and repair | Yes | Yes | Yes |
| Household level | Home adequately warm in cold weather* | Yes | Yes | Yes |
| Household level | Home damp free* | Yes | Yes | Yes |
| Household level | Reliable access to internet at home | Yes | Yes | Yes |
| Household level | Access to computer or tablet | Yes | Yes | Yes |
| Household level | Adequate access to reliable transport | Yes | Yes | Yes |
| Household level | Heating, electrics and plumbing in good working order | Yes | Yes | Yes |
| Household level | Home contents insurance | Yes | Yes | Yes |
| Individual level | Three meals a day | Yes | Yes | Yes |
| Individual level | Fresh fruit or vegetables every day | Yes | Yes | Yes |
| Individual level | Annual break away from home | Yes | Yes | Yes |
| Individual level | Without regular money worries* | Yes | Yes | |
| Individual level | Regular pension payments | Yes | ||
| Individual level | Appropriate clothes for work or job interview | Yes | ||
| Individual level | Regular dental appointments | Yes | Yes | |
| Individual level | Go out socially at least monthly | Yes | Yes | |
| Individual level | See friends and family at least monthly | Yes | Yes | |
| Individual level | Small amount of money for oneself | Yes | Yes | |
| Individual level | School trips | Yes | ||
| Individual level | Enough clothes feel comfortable wearing | Yes | ||
| Individual level | Organised weekly activity outside school | Yes | ||
| Individual level | Friends round monthly | Yes | ||
| Individual level | Age suitable toys or games | Yes | ||
| Individual level | Enough bedrooms for children 10+ years* | Yes | ||
| Individual level | Toddler, nursery or playgroup at least weekly | Yes | ||
| Individual level | Place for homework | Yes |
Notes: * items and activities for which deprivation is established using simple absence.
8. Assessment of the advantages and disadvantages of different approaches for determining who is materially deprived
This Chapter presents the findings and recommendations arising from detailed assessments of a number of methodological aspects of material deprivation measures which are pivotal for determining who is materially deprived, these are:
- determining optimum material deprivation thresholds
- prevalence weighting and type of measure
- combining material deprivation status with a low-income indicator
- simple absence versus constrained lack
- whole population or household-level material deprivation measures
Moving from a set of necessities to determining who is materially deprived involves a number of steps. In the existing UK measures, the steps are as follows:
-
Binary variables are generated for each of the items and activities indicating financially constrained lack for children and working-age adults, and wider constrained lack for pensioners. The exception is for items and activities for which deprivation is established using simple absence.
-
Prevalence rates are estimated for each item and activity - the proportion of the relevant age group reporting that they have an item or activity.
-
Prevalence weighted financially constrained lack (or wider constrained lack for pensioners) is summed across all items and activities for each individual to generate a material deprivation score.
-
The maximum possible prevalence weighted material deprivation score is found and this value is used to generate a standardised score for each individual, which is scaled 0 to 100.
-
Materially deprived individuals are identified by determining who has standardised material deprivation scores greater than or equal to pre-determined thresholds (25 in the case of children and working-age adults and 20 for pensioners).
-
Rates of material deprivation are estimated.
-
For children and working-age adults, the proportion who are materially deprived and living in a low income household (the combined measure) is estimated.
8.1. Determining optimum material deprivation thresholds
Where material deprivation thresholds are set is a major factor in determining who is classified as materially deprived. The revised material deprivation measures which include revised items and activities, new FRS question routing for children and working-age adults and a new standardised set of options for why items and activities are lacking, mean that the thresholds used to determine material deprivation status need to be rebased. In the existing measures, children and working-age adults are classified as materially deprived if their standardised material deprivation score is 25 or greater and pensioners are classified as materially deprived if their score is 20 or greater.
Deciding where the new thresholds should be set is critical as estimated rates of material deprivation can be very sensitive to where the threshold is set. In the past, a combination of statistical analysis and judgement has been used to determine optimum thresholds but it is important to be clear that there is an arbitrary element to deciding where thresholds are set. When the UK child material deprivation threshold was originally set, other information was also taken into account: “The child poverty threshold was set using judgement augmented by statistical analysis, and was set so that roughly the same proportion of children were materially deprived as were in low income households.” (McKay, 2010: 33). For the pensioner material deprivation threshold, McKay concluded that “On the basis of judgement, and some degree of statistical analysis, a cut-off point in the range 15 to 20 would be defensible and credible.” (McKay, 2010: 37). DWP took this on board when deciding to adopt a threshold of 20 for the pensioner material deprivation measure (DWP, 2011).
Given the use of judgement, it is important to document the reasons why decisions are made and justify why a threshold has been set at a particular level. Publishing sensitivity analysis is also important to help users understand what impact small differences to where the threshold is set can have on material deprivation estimates. It was not within the remit of this Review to recommend optimum thresholds for the revised measures; data collected in the FRS for the first year, rather than the smaller FRS test question dataset, is required for this[footnote 10]. However, the Review assessed different methodological approaches and made recommendations on which methods and approaches should be used to determine the new optimum thresholds.
One option is to adopt ‘continuity thresholds’. Continuity thresholds produce estimates of material deprivation close to rates based on a previous set of items and activities, and data collection methodology. They could be based on the 2023/2024 FRS data where the sample has been split, or for the most recent year(s). This approach may seem attractive as it requires little further analysis and because the revisions will not appear to have a significant impact on estimates of material deprivation (at least in the first year). However, it risks locking-in problems with a previous set of items and activities which may have underestimated material deprivation due to their declining relevance. It also will not be able to take advantage of improved data collection methods which can lead to more accurate estimates of material deprivation. For example, the introduction of the two-stage process where respondents are first asked whether or not they lack any of the items or activities before being asked the reasons why they lack any of these items or activities. This method helps reduce respondents’ reluctance to report they lack items which leads to underestimates of material deprivation. The changes we have recommended represent a break in the material deprivation series but adopting continuity thresholds can give the appearance that the old and new series align. This is misleading and even if rates can appear to be similar in the first year, the new series are likely to follow different trajectories.
Statistical analysis can help to determine which threshold is ‘best’ at discriminating between a ‘materially deprived’ group and the rest of the population. Usually this entails identifying a threshold which maximises the variance (difference) between the deprived and non-deprived groups while minimising the variance within each group (see, for example, Gordon and others, 2000). Using this method, statistical models are used to assess a series of thresholds. Typically, Analysis of Variance (ANOVA) models or regression models, such as probit or logit models, are estimated using variables known to be associated with material deprivation. Previous studies have often used low income for this purpose. However, using low income as a proxy for material deprivation is problematic, as discussed previously, due to important differences in the concepts of material deprivation and income poverty. One of the main motivations for the development of material deprivation measures was to provide an alternative to indirect poverty measures based on income. Furthermore, the statistical analysis approach has been shown, in some cases, to identify a very low optimum threshold for deprivation; the lower the threshold, the better the fit of the models (McKay, 2010). There is, therefore, a risk that reliance on this type of statistical analysis could identify an optimum threshold which identifies a very deprived group.
Judgement can be guided by results from statistical models, results from further analysis examining how the characteristics of groups identified as materially deprived change for different thresholds, and how the composition of materially deprived and non-deprived groups varies for different thresholds. Judgement can also be used when considering where to set thresholds for different groups. For example, if poverty risks are known to be higher in one age group compared to another, optimum thresholds should lead to estimates of material deprivation reflecting these different risks.
To illustrate how sensitive estimates of material deprivation are to different thresholds, Table 8.1 shows a range of estimates for child material deprivation, and low-income and combined child material deprivation using the FRS test question dataset. The first row contains estimates based on the existing set of items and activities and the existing threshold of 25. Around 11% of children in the FRS test question dataset are estimated to be both materially deprived and living in a low-income household. This is close to recent estimates published in the HBAI series, avoiding the two most recent years which were affected by the Covid-19 pandemic. In 2019/2020 12% of children were estimated to be materially deprived and living in a low-income household (using the same low-income threshold). If we applied the existing threshold to a measure derived from the revised items and activities, the estimate is substantially lower at 5% (shown in the second row). The remaining rows in Table 8.1 show how estimates of material deprivation rates change for different thresholds. A threshold of 17 produces estimates for the combined measure which are close to the measure based on the old set of items and activities and threshold.
Table 8.1: Sensitivity of estimated child material deprivation rates for different thresholds using the FRS test question dataset (April, May and June 2022)
| Material deprivation | Material deprivation and <70%BHC | |
|---|---|---|
| Old items: threshold = 25 | 17.34 | 10.78 |
| New items: threshold = 25 | 7.81 | 5.07 |
| New items: threshold = 20 | 13.53 | 8.98 |
| New items: threshold = 19 | 15.44 | 9.04 |
| New items: threshold = 18 | 17.34 | 10.30 |
| New items: threshold = 17 | 17.82 | 10.63 |
Source: Authors’ analysis of FRS test question dataset (April, May and June 2022).
Notes: Material deprivation rates (column one) are estimated for individuals with non-missing income.
Recommendations in relation to determining optimum deprivation score thresholds
(a) It was not within the remit of the Review to recommend optimum thresholds for the revised measures; data collected in the FRS for the first year, rather than the smaller FRS test question dataset, is required for this. However, the Review assessed different methodological approaches and recommended using a combination of statistical analysis and judgement to determine where the new thresholds are set. To provide full transparency to users, documentation detailing the decisions made, and why, should be published alongside the statistics.
(b) For the statistical modelling, we recommend DWP does not rely on household income alone to test which thresholds are best at discriminating between deprived and non-deprived groups. We recommend the development of a composite standard of living measure which could include information on savings, debts and food security, and recognises differences in needs/costs faced by different household types. For example, single parent households or where any household member has a long-standing illness or disability.
8.2. Prevalence weighting and type of measure
In this section we assess methodological issues relating to both prevalence weighting and different types of material deprivation measure due to the way they are interlinked. If prevalence weighting is not used, there is no need to use a measure based on deprivation scores unless there is good reason to introduce a different form of weighting. Simple count measures (also known as summation measures) simply give each item and activity an equal weight. Individuals are classified as material deprived if they lack more than a pre-determined number of items out of the total number of items included in a measure.
Prevalence weighting each item and activity gives greater weight to lacking those that are more commonly held. It introduces an additional relative element to measures of material deprivation. The assumption is that constrained lack of items and activities is more keenly felt where ownership is more widespread. In addition, prevalence weighting can help keep a material deprivation measure updated for measures where the set of items and activities is unchanged for a number of years. For example, if ownership of an item increases over time its associated prevalence weight also increases and lacking this item will contribute a higher deprivation score, increasing the likelihood of being classified as materially deprived. It is a bit more complicated than this because the use of standardisation means that prevalence of an item needs to increase relative to prevalence of other items included in the scale.
An advantage of using prevalence weighted standardised deprivation scores, as used in the UK measures, is that this approach offers finer-grained control of where to set optimum material deprivation thresholds. However, simple count measures are easy to compute, more transparent and easier to communicate. For example, it is easy for everyone to understand, say, material deprivation being defined as lacking more than 5 items out of a possible list of 12 items. On the other hand, explaining why someone is materially deprived because their standardised prevalence weighted material deprivation score is 25 or higher is a lot harder.
A further disadvantage is that the underlying assumption that deprivation is more keenly felt for items with higher prevalence might not hold (at least for some items)[footnote 11]. For example, being deprived of a damp free home or being unable to keep your home adequately warm in cold weather. The share of the population also lacking these items can be considered irrelevant for assessments of deprivation. We might want to consider the lack of such items in an absolute sense rather than a relative sense. In addition, when living standards fall, such as during recessions, the prevalence of certain items is likely to fall, which can lead to lower prevalence weights, lower deprivation scores and lower estimated rates of deprivation. This is counterintuitive and does not reflect the reality of the lived experience of poverty.
In assessing the importance of prevalence weighting we examined how prevalence weights have changed over time for items and activities included in the UK child measure. Trends in prevalence rates are shown in Figure 8.1 for the child items and in Figure 8.2 for the parent/household level items included in the current child measure. These show considerable variation in prevalence rates between items. For child items, the highest rates of prevalence are found for a warm winter coat for each child and celebrations on special occasions. For the parent/household level items, prevalence rates are highest for keeping up with bills and debt repayments and keeping home warm enough in winter. Considerably lower rates of prevalence are found for an annual family holiday (child and parent/household items), friends around for tea or snack (child item), replacing worn out furniture and regular savings (both parent/household items). The gaps in prevalence rates between items in any given year can be as wide as 30 percentage points. There is also variance in trends. While there is a general upward trend in item prevalence between 2011/2012 and 2019/2020, increases in prevalence vary between items and activities. In addition, prevalence rates do not increase for all items and activities (for example, having friends around for tea or a snack), and in some cases prevalence rates fall (for example, home contents insurance, having enough bedrooms). Overall, these findings suggest that prevalence weighting is likely to have influence due to wide differences in prevalence rates between items and activities in a single year, and variation in trends.
Figure 8.1: Trends in prevalence weights: child items, 2011/2012 to 2019/2020
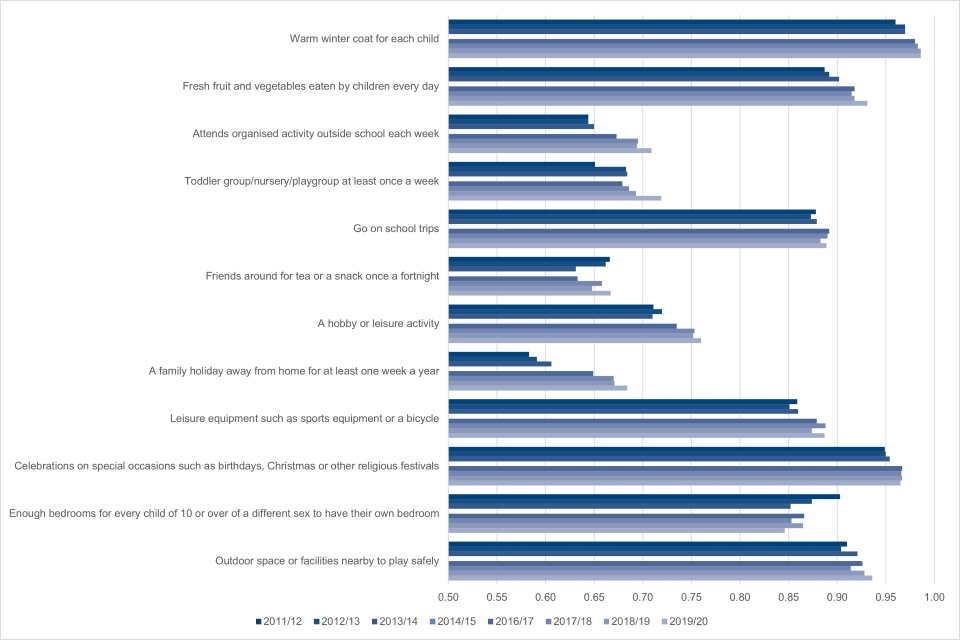
Source: HBAI quality and methodology series, DWP (various years).
Notes: we were unable to find published prevalence weights for 2014/2015.
Figure 8.2: Trends in prevalence weights: parent/household items, 2011/2012 to 2019/2020
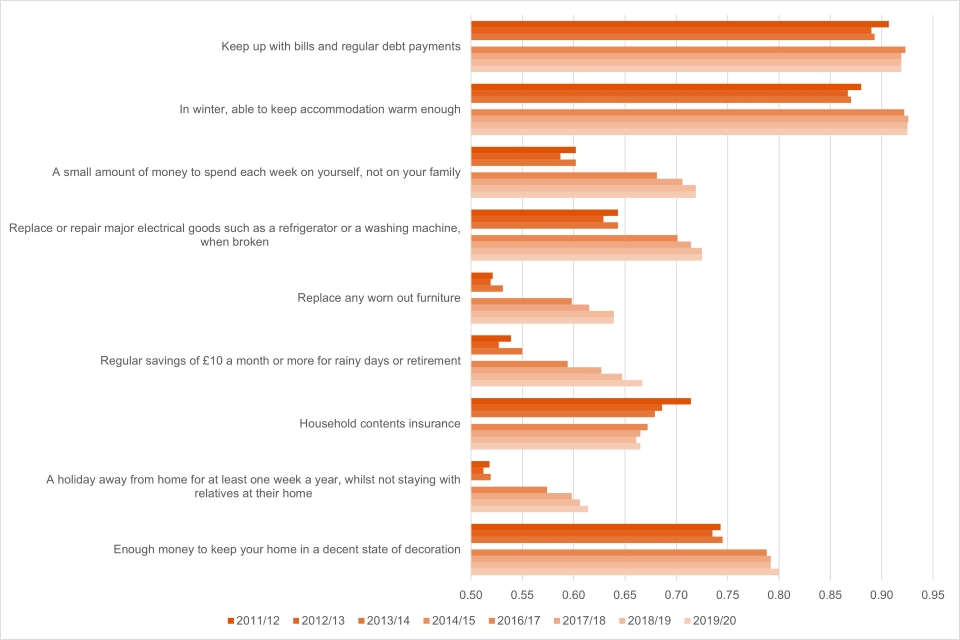
Source: HBAI quality and methodology series, DWP (various years).
Notes: we were unable to find published prevalence weights for 2014/2015.
Due to the standardisation process, the score each item contributes to the total material deprivation score for each individual is not only affected by the prevalence weight for that item but also its share in the overall maximum possible prevalence weighted material deprivation score. This is due to the rescaling of prevalence weighted material deprivation scores 0 to 100 based on the maximum possible prevalence weighted material deprivation score. This means that lacking items which increase in prevalence over time won’t necessarily contribute more to the deprivation score as it is depends on how prevalence rates change for other items, and the relative contribution of the prevalence weighted score to the maximum possible.
Recommendations in relation to prevalence weighting and type of material deprivation measure
(a) Given the lower complexity and greater transparency of simple count measures, we recommend additional research to establish whether such a measure would have led to substantially different estimates of material deprivation over the last decade. If not, we recommend moving to a simple count measure.
(b) If prevalence weighting is continued, we recommend a number of items and activities should be given the maximum weight of one irrespective of prevalence rates. The degree of deprivation felt by lacking some items is very unlikely to be affected by prevalence. We recommend further exploratory work to assess the desirability of giving the maximum weight to a damp free home, keeping home adequately warm in cold weather, able to pay bills, three meals a day and daily fresh fruit or vegetables.
8.3. Combining material deprivation status with a low-income indicator
The UK measures are unusual in the way they combine material deprivation status with a low-income indicator for children and working-age adults. Following a consultation in 2002 on measuring child poverty, the Labour government decided that the best way to monitor progress against their commitment to eradicate child poverty in a generation was through adopting a tiered approach comprising three headline measures: absolute low income; relative low income; material deprivation and low income combined (DWP, 2003). The Child Poverty Act 2010 introduced a series of legal targets and publishing requirements for these three measures and a fourth measure on persistent poverty. The Welfare Reform and Work Act 2016, which superseded the Child Poverty Act 2010, removed the legal targets for child poverty reduction in England but maintained a legal requirement to publish four measures of child poverty, including the percentage of children who live in households whose equivalised net income for the relevant financial year is less than 70% of median for that financial year, and who experience material deprivation[footnote 12].
Estimates of severe poverty for children are also published in DWP’s HBAI series – defined as the percentage of children living in a household with an equivalised BHC income below 50% of median income who also experience material deprivation.
The reasons given for introducing an official combined measure in 2003 were that: (1) while the income-deprived and the materially-deprived are very different from the non-deprived, the difference was more pronounced when the two were combined (DWP, 2003: 13; citing evidence in Bradshaw and Finch, 2003), and (2) it helps to overcome a ‘problematic issue for material deprivation measures’ of choice, by minimising the risk that those saying that they cannot afford items may not be poor, but may instead be spending their money on other items not included in the measure (DWP, 2003: 13).
Material deprivation rates for pensioners have been published since 2009/2010 but a decision was made not to combine material deprivation status with low income for this age group. The pensioner measure adopts a broader concept of deprivation through including a wider range of reasons for lacking items and activities, beyond financial constraint, to determine deprivation status. A new series for working-age adults which combines material deprivation status with relative low income was published for the first time in 2023 with a backdated series for financial years ending 2011 to 2022 Households below average income: for financial years ending 1995 to 2022[footnote 13].
Some experts have challenged the usefulness of a measure which combines material deprivation with low income. Material deprivation and income poverty are different concepts evidenced by a positive correlation but a limited overlap indicating that they pick up different aspects of living standards (see, for example, Perry, 2002 and Karagiannaki, 2020). There are a number of reasons why someone may be classified as income poor but not materially deprived, or vice versa.
Firstly, people who are income poor for prolonged periods of time may revise down their expectations of what living standards are achievable. This increases the likelihood of reporting that they lack items because they don’t want or don’t need them rather than because they cannot afford them. Such adaptive preferences lead to downward bias in estimates of material deprivation.
In the UK child measure, children’s deprivation of items is derived from FRS questions which ask parents whether their child(ren) lack items or activities because they cannot afford them or because the child(ren) don’t want or need them. Children’s preferences can differ from their parents’ and parents struggling to pay household bills may be more inclined to report their child(ren) don’t need items or activities (for example, attending an organised activity after school).
Secondly, differences in tastes and preferences can lead to some people being classified as income poor but not materially deprived, or vice versa. They may not want some items deemed to be necessities but due to their low income would not be able to afford them even if they did. Some people may prioritise other items and activities above those deemed to be necessities. This can mean that having spent their income securing these other items, they are left in a position of not being able to afford items deemed to be necessities.
Thirdly, materially deprived individuals living in households with high housing costs could mean income status based on BHC income is not classified as low but disposable income for the household AHC is below the low income threshold. AHC income provides a more realistic assessment of the financial resources available to spend on necessities after the cost of housing has been met.
Fourthly, dynamic aspects can also be a factor (Nolan and Whelan, 2011, Karagiannaki, 2020). Time lags between income poverty and material deprivation transitions could contribute to the observed limited overlap at a point in time (Karagiannaki, 2020). Individuals might not be classified as income poor due to a recent exit from income poverty but the legacy of a long spell in income poverty can mean that they remain materially deprived of many items. Conversely, recently entering income poverty is unlikely to have an immediate impact on being able to afford a number of necessities such as living in a damp free home or having had an annual holiday.
Karagiannaki (2020) shows that moving from assessing the overlap between income poverty and material deprivation at a point in time to assessments based on persistent measures of income poverty and material deprivation leads to an increase in the estimated overlap. However, the impact is small and a mismatch remains, and she concludes that the mismatch cannot be explained by short-term income fluctuations. Other research has also shown that when income poverty and material deprivation are measured over longer periods of time, there is still a limited overlap between the two measures (Nolan and Whelan, 2011).
Finally, measurement error in material deprivation measures or income (with known problems at the lower end of the income distribution) can contribute to an estimated mismatch.
Overall, then, the limited overlap between income poverty and material deprivation has led some scholars to conclude that both material deprivation and income poverty measures should be used in a policy context (Whelan, Layte and Maître, 2003).
We estimate the overlap between material deprivation and low income for working-age adults, children and pensioners, using the FRS test question dataset. Before examining these estimates it is important to mention a number of caveats. The estimates of material deprivation are based on the revised measures using thresholds which produce estimates close to the measures using the previous measures. These are unlikely to be optimum thresholds. Optimum thresholds for the revised measures based on the new items and activities are not just likely to result in different estimates of material deprivation but also in different estimates of the overlap between material deprivation status and low-income. The estimates in Table 8.2 are based on a material deprivation threshold of 24 for working-age adults, 17 for children and 24 for pensioners. Consistent with the existing approach, deprivation status for pensioners is based on wider constrained lack of items while financially constrained lack is used to estimate material deprivation for working-age adults and children.
We begin by examining estimates of the overlap between low income status (income lower than 70% median equivalised household income BHC) and material deprivation status (results shown in the left-hand panel of Table 8.2). The majority of people in low income households (<70%BHC) are not classified as materially deprived (MD), although the shares are higher than for the sample population as a whole (All). 39% of working-age adults, 34% of children and 13% of pensioners in low-income households are also estimated to be materially deprived. Not all materially deprived individuals live in low income households. According to these estimates 8% of working-age adults, 10% of children and 6% of pensioners in higher income households (>=70%BHC) are classified as materially deprived. The overlap between low income and material deprivation status is lower among pensioners than working-age adults or children, in part reflecting the wider concept of deprivation used for this age group. Among the materially deprived (results shown in the right-hand panel of Table 8.2), there is a limited overlap with low-income status: 58% of materially deprived working-age adults, 60% of materially deprived children, and 49% of materially deprived pensioners, are living in low-income households.
Table 8.2: Overlap between material deprivation and low-income: estimates based on the FRS test question dataset (April, May and June 2022)
| Income <70%BHC | Income >=70%BHC | Income - all | BHC | Materially deprived | Not materially deprived | Material deprivation - all | |
|---|---|---|---|---|---|---|---|
| Working age - MD | 39% | 9% | 16% | <70%BHC | 58% | 16% | 23% |
| Working age - not MD | 61% | 91% | 84% | >=70%BHC | 42% | 84% | 77% |
| Total | 100% | 100% | 100% | 100% | 100% | 100% | |
| Children - MD | 34% | 10% | 18% | <70%BHC | 60% | 25% | 31% |
| Children - not MD | 66% | 90% | 82% | >=70%BHC | 40% | 75% | 69% |
| Total | 100% | 100% | 100% | 100% | 100% | 100% | |
| Pensioners - MD | 13% | 6% | 8% | <70%BHC | 49% | 27% | 29% |
| Pensioners - not MD | 87% | 94% | 92% | >=70%BHC | 51% | 73% | 71% |
| Total | 100% | 100% | 100% | 100% | 100% | 100% |
Source: Authors’ analysis of FRS test question dataset (April, May and June 2022).
We can also examine who is excluded from the combined measure due to not meeting the low-income criteria by looking at the number of items and activities these individuals lack. In Table 8.3 we show the number of items or activities lacked due to a financial constraint for working-age adults. These statistics are based on unweighted data using a material deprivation score threshold of 24 to determine material deprivation status and 70% BHC income as the low-income threshold. As noted above, this threshold is used for illustrative purposes and may not be the optimum threshold for the revised measure and the overlap between material deprivation status and low income could be different for an optimum threshold. Working-age adults classified as materially deprived (Table 8.3, column 2) lack six or more of the 21 items due to a financial constraint, and on average they lack nine. Applying the requirement that individuals need to live in a low-income household as well as be materially deprived (Table 8.3, column 4) excludes individuals reporting that they lack quite high numbers of items due to a financial constraint (the difference between column 2 and column 4)[footnote 14]. Over a quarter of materially deprived individuals excluded from the combined measure due to living in households above the BHC low income threshold lack 10 or more items (26%)
Table 8.3: Number of items and activities lacked by working-age adults due to a financial constraint by material deprivation and low-income status: estimates based on the FRS test question dataset (April, May and June 2022)
| No. items lacked | Not MD | MD | Not MD and/or not <70%BHC | MD and <70%BHC |
|---|---|---|---|---|
| 0 | 2206 | 2206 | ||
| 1 | 1136 | 1136 | ||
| 2 | 376 | 376 | ||
| 3 | 225 | 225 | ||
| 4 | 157 | 157 | ||
| 5 | 161 | 161 | ||
| 6 | 148 | 69 | 79 | |
| 7 | 108 | 52 | 56 | |
| 8 | 117 | 55 | 62 | |
| 9 | 87 | 33 | 54 | |
| 10+ | 282 | 75 | 207 | |
| 4261 | 742 | 4545 | 458 |
Source: Authors’ analysis of FRS test question dataset (April, May and June 2022).
Notes: The sample is restricted to working-age adults with non-missing income. Unweighted data.
While the limited overlap causes some concern about using a combined measure, a further issue is that trends in the combined measure tend to be dominated by changes in the proportion of the relevant population with income below the low-income threshold. This is because the combined measure amounts to a sub-set of individuals in this low-income group. It is now well-documented that decreases in relative income poverty rates following the 2007/2008 financial crisis were primarily due to falling median income leading to a fall in the relative income poverty line (Joyce, 2014). Falling relative income poverty rates following the financial crisis occurred in the context of sharp declines in real wages and real incomes, indicating declining living standards (Hills and others, 2016).
The falls in relative income poverty rates for children are shown in Figure 8.3 using the 70% median low income threshold and in Figure 8.4 using the 50% median low income threshold (income measured BHC). These figures also show the child material deprivation series and the combined low income and material deprivation series. The first thing to note is that the child material deprivation series lies between the 70% median low-income series and the combined series but always above the 50% median low-income series due to the lower shares of children living in households with BHC income less than 50% of median income. As living standards fell after the financial crisis, material deprivation rates increased between 2007/2008 and 2009/2010. However, child poverty rates based on the official child poverty measure combining relative low income with child material deprivation decreased between 2008/2009 and 2010/2011 (from 2007/2008 for the severe relative low-income threshold of less than 50% median income). Viewed from the published combined measure, it is impossible to know that child material deprivation increased over this period and important information about child poverty is obscured. Although DWP make the material deprivation series available online[footnote 15], it would have been helpful if this series was published as part of the HBAI headline statistics making it more readily available to commentators and analysts.
In addition to the diverging trends following the financial crisis, between 2013/2014 and 2016/2017 relative low-income poverty rates increased among children but material deprivation rates fell. The combined series shows a small decline when based on the 70% median BHC income threshold and a small increase based on the 50% median BHC income threshold. Furthermore, over the last decade a lower proportion of children in relative low-income households are classified as materially deprived. This can be seen by the gap between the low-income series and the combined series widening over time.
Taken together, this evidence shows that important information can be lost when material deprivation is combined with low-income to compute estimates of child poverty. While the publication of the combined measure remains a legal requirement, publication of the material deprivation series in the HBAI headline statistics would help to provide important information on poverty trends.
Figure 8.3: Trends in the percentage of children in relative low-income households (below 70% median BHC income), child material deprivation and combined relative low income and child material deprivation
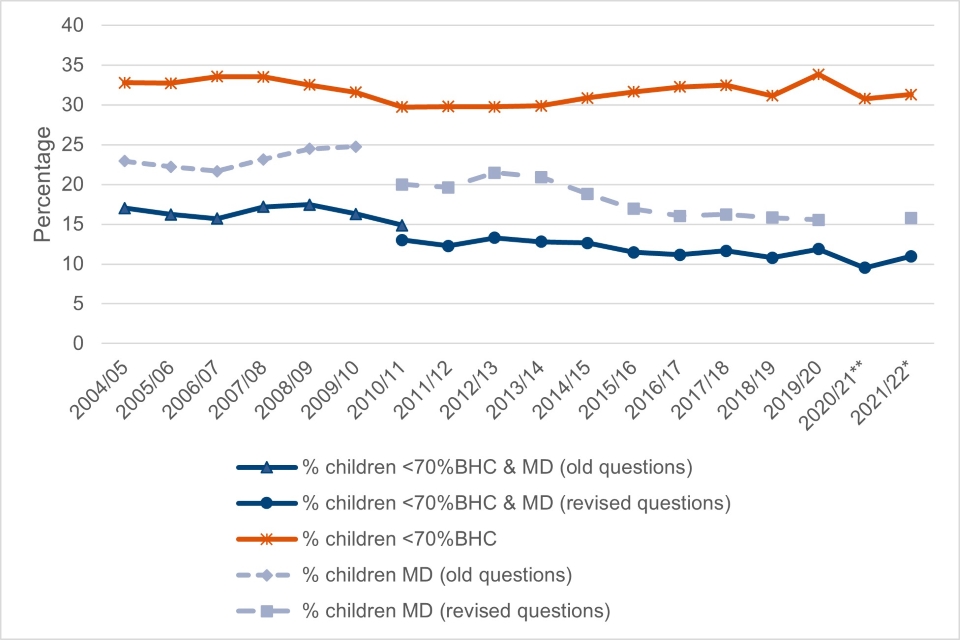
Source: Low income and combined series from Households Below Average Income: for financial years ending 1995 to 2022, DWP (2023b); material deprivation series from DWP’s Stat Xplore
Notes: (1) For 2020/2021** and 2021/2022*, all estimates of material deprivation, including those combined with low-income measures, are not strictly comparable with the pre-pandemic period. Several of the questions asked as part of the material deprivation measure were affected by government restrictions introduced in response to the coronavirus (COVID-19) pandemic. Restrictions persisted during the first quarter of the 2021/2022 survey year and continued to affect responses as society returned to normal. Material deprivation statistics are not published for 2020/2021** on Stat Xplore. (2) The child material deprivation measure was revised in 2010/2011 and estimates for material deprivation in 2010/2011 using the old questions and the revised questions are published in HBAI but not in Stat Xplore. Estimates for material deprivation using the old questions are only available up to 2009/2010.
Figure 8.4: Trends in the percentage of children in low income households (below 50% median BHC income), material deprivation and combined severe relative low income and child material deprivation
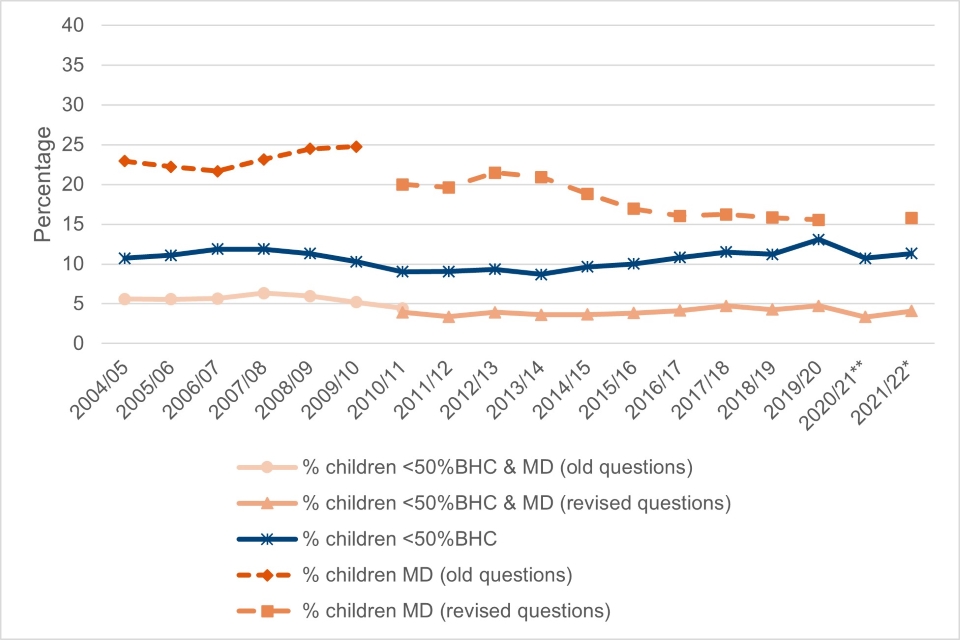
Source: See Figure 8.3.
Notes: See Figure 8.3.
Recommendations in relation to combining material deprivation status with a low income indicator
(a) To gain a clearer picture of poverty trends, we recommend that alongside publishing the HBAI low-income series and the combined low income and material deprivation series (a legal requirement for the child poverty measure), DWP publishes new HBAI headline series on material deprivation alone. This would meet some users concerns about the combined measure conflating two concepts (low income and material deprivation) and would allow a fuller understanding of trends in the combined series.
(b) We recommend HBAI headline statistics for combined measures are based on after housing costs and not before housing costs income. This is a more realistic measure of the resources available to spend on necessities and consistent with other HBAI headline series.
8.4. Simple absence versus constrained lack
An important issue covered in the evidence review (Chapter 2) for determining who is materially deprived is whether or not lack of an item or activity should be determined by simple absence or constrained lack (either due to financial constraint or a broader set of constraints). Depending on where a material deprivation threshold is set, this could affect estimates of material deprivation with the use of simple absence likely to lead to higher estimates of material deprivation than financially constrained lack. It might also affect the contribution of different items and activities to the overall measure if the gap between simple absence and financially constrained lack varies between items and activities.
The main issue is whether reluctance to report items are lacked due to financial constraints leads to an underestimate of material deprivation. This reluctance can arise from adapted expectations, pride or even confusion where the link between lacking an item and financial constraint is indirect. For example, keeping heating, electrics and plumbing in good working order is usually the responsibility of the landlord for individuals living in rented accommodation. Renters who lack this item may not report that they lack it due to a financial constraint. They would need to respond either: ‘we/I do not have the money for this’ or ‘this is not a priority on my/our current income’ neither of which fit very well given the circumstances. They are perhaps more likely to respond that they lack this item for another reason or that the item does not apply to them. However, arguably the reason why they lack this item is that they cannot afford to live in higher quality housing where the landlord keeps the heating, electrics and plumbing in good working order (i.e. a financial constraint).
A further issue is that, as discussed earlier, parents respond to the questions on individual-level items for their children and they can have a different view from their children on which items are wanted or needed. In addition, parents living in poverty and struggling to make ends meet, might be more inclined to report that their child(ren) don’t want or need items when faced with not being able to keep up with household bills or buy enough food. Previous research has shown that there are income gradients with parents in lower income households more likely to report that their child(ren) lack items included in material deprivation measures because they don’t want or need them than parents in higher income households (McKnight, 2013a).
To begin to address some of these issues we made recommendations on which items deprivation should be assessed on simple absences alone (Section 5.7). ‘Being able to pay regular bills like rent, mortgage, electricity or Council tax or Rates without cutting back on essentials’, ‘being able to put money aside to cover unexpected expenses’ and ‘being without regular money worries at the end of the month’ in the revised measures will be assessed based on simple absence. In addition, ‘living in a damp free home’ and ‘living in a home which is adequately warm in cold weather’ in the revised material deprivation measures will also be assessed based on simple absence. We also used simple absence to assess deprivation of ‘having enough bedrooms for children over 10 years not to have to share with a child of a different sex’ in the analysis of the FRS test question data but suggest that further analysis of this item is conducted using the larger sample size which will be available in FRS 2023/2024. Further research would be helpful to understand the extent of income gradients in people reporting that they, or their children, lack items due to not wanting or needing them could help inform the desirability of expanding the number of items for which deprivation is assessed on simple absence alone.
Recommendations in relation to simple absence versus constrained lack:
(a) Evidence suggests that adaptive preferences mean that people underreport financially constrained lack of necessities. We recommend further research to understand income gradients in people reporting that they, or their children, lack items or activities due to not wanting or needing them. This research could lead to the use of simple absence rather than constrained lack to establish deprivation for a wider set of items or activities.
(b) Parents may be more likely than children to report child-related items are lacked because children don’t want or need them rather than not being able to afford them. We recommend further research to establish the feasibility of asking children (aged 11+) directly about whether they lack items or activities, and the reason(s) why they lack any.
8.5. Whole population or household-level material deprivation measure alongside age group specific measures
The review of income-based poverty statistics conducted by the Office for Statistics Regulation made a number of recommendations in relation to the official UK material deprivation measures (OSR, 2021). It recommended that to increase the public value of the existing statistics, DWP should review the current set of questions which underpin material deprivation and determine a way to compare material deprivation across groups. These recommendations informed the aims of this review. The research team were tasked with looking at the advantages and disadvantages of developing a “core” set of questions for the whole population alongside measures aimed at specific family types. This included identifying what set of items for the population as a whole has the highest suitability, validity, reliability and additivity and how to ensure that there is no over/under-reporting of material deprivation among certain groups.
As detailed in this report, a number of steps have been taken to standardise the approach taken to collect data on material deprivation in the Family Resources Survey, including standardised question routing and a standard set of options for respondents to indicate why they lack items and activities. In addition, a core set of household-level questions are included in the FRS which one representative adult in each household responds to. The working-age adult measure, the child measure and the pensioner measure each comprise these household-level items and activities in addition to a tailored set of age-relevant individual-level items and activities. Further standardisation is achieved through including three common individual-level items: three meals a day, daily fresh fruit or vegetables and an annual break away from home.
In addition, the working-age adult and pensioner measures include the same individual-level items with the exception of the addition of regular pension payments and appropriate clothes for work or job interview in the working-age adult measure. The use of a standardised set of reasons for lacking means that it is now possible to compute financially constrained lack for all age groups, or the broader concept of constrained lack which is currently used in the pensioner material deprivation measure. All these steps aid the possibility of constructing a whole population measure, at least for the adult population, or a household-level measure.
There are a number of challenges associated with developing a whole population, all-adult or household-level material deprivation measures. Firstly, an optimum material deprivation threshold will need to be determined and this is no small task. Secondly, a decision will need to be made about whether to use financially constrained lack to establish deprivation of items and activities or the broader concept of constrained lack currently used in the pensioner measure. Thirdly, a decision will need to be made on whether a combined low-income measure should be used. Whatever is decided in relation to all three challenges would result in a change to current practice which includes different deprivation score thresholds for children and working-age adults on the one hand and pensioners on the other.
Likewise, financially constrained lack is currently used to determine material deprivation for children and working-age adults while a broader concept of constrained lack is used for pensioners. Finally, a low-income combined measure is used for children and working-age adults but not for pensioners. It is clear that any standardisation across age groups in relation to the threshold, concept of constrained lack and combining with low-income would lead to a departure from the currently established practice for measuring deprivation for children, working-age adults and pensioners.
The decision to take a different approach for measuring deprivation among pensioners was taken following analysis which showed that using the same approach as that adopted for families with children, potentially underestimated poverty among older people (McKay, 2004). Concern that the original UK official material deprivation measure, introduced in 2004/2005, didn’t appear to be working well for older age groups, led DWP to commission a series of research projects. Analysis of secondary data appeared to suggest that older people were less willing (more reluctant) than younger people to acknowledge that they lacked items because they couldn’t afford them (Berthoud and others, 2006). Qualitative research found that older people tended to say they did not need items when they really could not afford them (Dominy and Kempson, 2006). Cognitive testing of the FRS question used to establish if an item or activity was lacking and if lacked why, found that it did not work well for older people because it did not reflect the complexity of reasons for having and not having certain items (Legard and others, 2008). Some of the items being asked about were found to be inappropriate or confusing for older people. The wording of the question about having or doing things was confusing and it was concluded that it would be better to start with a simple ‘yes/no’ question to ascertain which items they have (Legard and others, 2008). This led to the development of the current bespoke measure for older people as recommended by McKay (2008).
If a whole population measure adopts a standardised approach which reverts to using financially constrained lack to establish material deprivation for older people, there is a risk that material deprivation rates will be underestimated for this age group. Using the FRS test question dataset, we estimate the impact of moving from wider constrained lack to financially constrained lack and combining financially constrained lack with low-income on estimates of deprivation (Table 8.4). Estimates for pensioners use a deprivation score threshold of 24 to determine material deprivation status, which may or may not be the optimum threshold. A different threshold is likely to produce different results but the impact of moving between the measures is likely to be similar. The estimated rate of deprivation based on financially constrained lack is 27% lower than the rate based on wider constrained lack and the rate based on the combined measure of financial constrained lack and low-income is 61% lower than the rate based on wider constrained lack. It is clear from these results that adopting a measure based on financially constrained lack and combining financially constrained lack with low income will have a large impact on estimated rates of deprivation among pensioners and risks underestimating deprivation in this age group.
An alternative approach could be to extend the broader definition of deprivation based on wider constrained lack of items and activities (i.e., including the wider range of reasons for lacking items used for pensioners) to working-age adults and children. These estimates use a deprivation score threshold of 24 for working-age adults and 17 for children to determine material deprivation status. As stated previously, these may or may not be optimum thresholds. Different thresholds are likely to produce different results but the impact of moving between the measures is likely to be similar. As expected, estimated deprivation rates based on wider constrained lack are higher than for financially constrained lack for children and working-age adults (Table 8.4). However, the differences are greater between the wider constrained/financially constrained lack and the combined measures than they are between wider constrained lack and financially constrained lack measures (this is also the case for pensioners).
Table 8.4: Deprivation rates based on the FRS test question dataset (April, May and June 2022): wider constrained lack, financially constrained lack and combined measures
| Working-age adults | Children | Pensioners | |
|---|---|---|---|
| Wider constrained lack | 17.80 | 20.62 | 7.68 |
| Wider constrained lack and <70%BHC | 10.18 | 11.63 | 3.73 |
| Financially constrained lack | 15.58 | 17.82 | 5.62 |
| Financially constrained lack and <70%BHC | 9.03 | 10.63 | 3.01 |
Source: Authors’ analysis of FRS test question dataset (April, May and June 2022).
Notes: Sample is restricted to cases with non-missing income.
A further option has been suggested to use only the core household items to construct a whole population, all-adult or household-level measure. This could be extended to include individual-level items common across age-groups. While further research is required to construct such a measure (not least determining optimum deprivation score threshold(s)), it is possible to assess whether excluding the majority of the individual-level items is likely to have a differential impact on the three age groups.
A comparison between the proportion of materially deprived (series labelled MD) working-age adults (Figure 8.5) and children (Figure 8.6) lacking each of the items and activities due to financial constraints highlights the lower shares of children lacking individual-level items and activities than working-age adults. This result also holds for the low-income combined measure (series labelled MD & <70%BHC). As there is missing income data for some cases, we also show estimates of material deprivation for cases with non-missing income data (series labelled MD (non-miss)) to ensure this isn’t due to differences in sample characteristics. While not all working-age adults are parents, it suggests that parents try to protect their children from poverty by prioritising their children’s needs above their own and making sure their children don’t have to go without necessities.
We can examine this further for the individual-level items common to both working-age adults and children. This, for example, shows that 37% of materially deprived working-age adults are deprived of three meals a day due to a financial constraint in contrast to 4% of children. To a greater extent it appears that children’s material deprivation status is largely determined by financially constrained lack of household-level items (contrasting Figure 8.5 with Figure 8.6). Although further research would be required to determine an optimum deprivation threshold for a measure based solely on household-level items, it does suggest that adopting such a measure could lead to an underestimate of material deprivation among working-age adults.
Figure 8.5: Proportion of materially deprived lacking items and activities due to financial constraint: working-age adults
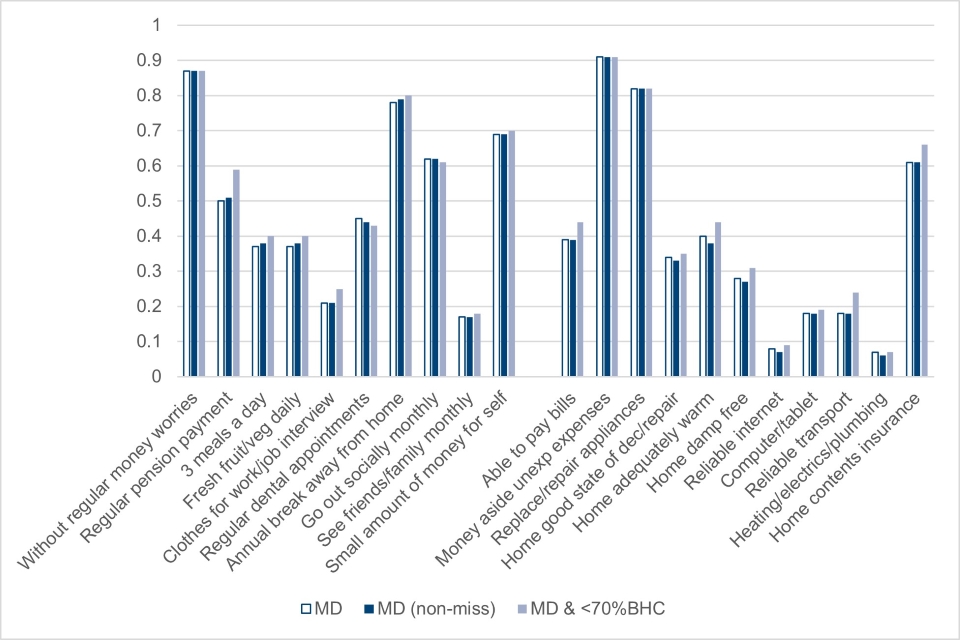
Source: Authors’ analysis of FRS test question dataset (April, May and June 2022).
Figure 8.6: Proportion of materially deprived lacking items and activities due to financial constraint: children
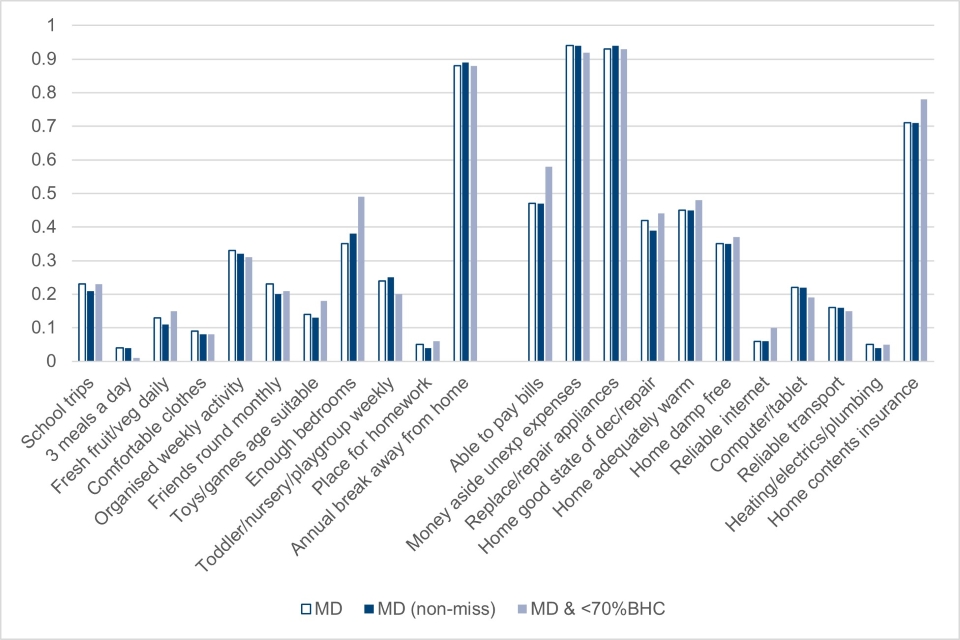
Source: Authors’ analysis of FRS test question dataset (April, May and June 2022).
For materially deprived older people, we compute the proportion of pensioners lacking each item and activity due to a financial constraint (series labelled MD) and due to a wider set of reasons for lacking (series labelled D) (Figure 8.7). The sample size for pensioners for the low-income combined measure is too small for this type of analysis. As with working-age adults, there is a balance between lacking household-level and individual-level items. This suggests that a measure based solely on household-level items could lead to an underestimate of material deprivation among older people. There are notably higher proportions of older people who are deprived of seeing friends and family monthly, going out socially monthly and having regular dental appointments due to a wider set of reasons for lacking than for financially constrained lack. This isn’t the case for all items and activities. It would appear that items or activities with a stronger financial element are more likely to be lacked due to a financial constraint (for example, being without regular money worries, having a small amount of money for self, home contents insurance, being able to pay regular bills) for older people classified as materially deprived based on financial constraint. This seems logical but it highlights the importance of the decision on whether to use financial constraint or wider constraint in a whole population or all adult measure.
Furthermore, a measure based solely on the core household items would exclude all the social activities which have been identified as key necessities for a minimum acceptable standard of living in the UK today (Chapter 3 and Chapter 5), along with other individual-level items. This would change the concept through limiting the dimensions covered. While further tests are required on the strengths and weaknesses of such an approach, reliability test results on measures using the household items alone (Appendix 4) show that a high proportion (around 50%) of household items fail or borderline fail the discrimination test for children and pensioners.
Figure 8.7: Proportion of materially deprived lacking items and activities due to wider constraint (D) and financial constraint (MD): pensioners
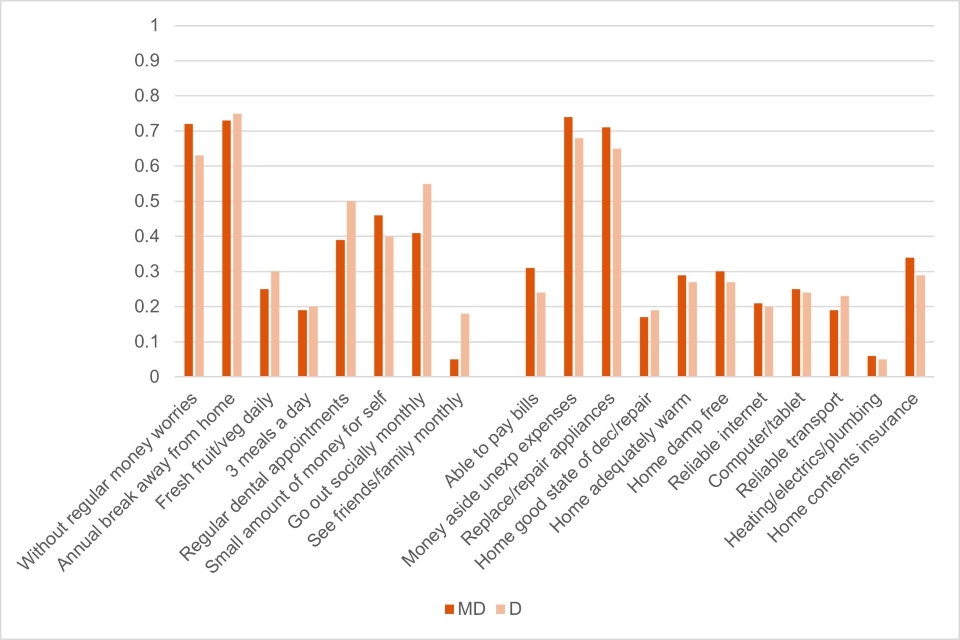
Source: Authors’ analysis of FRS test question dataset (April, May and June 2022).
Finally, further research could help establish whether or not different approaches currently taken for children and working-age adults on one hand and pensioners on the other, lead to estimates of material deprivation which are additive across different age groups. On the basis that the indicator designed for each age group is the optimum approach to measuring the latent construct (material deprivation) for that group, then it may be possible to compare deprivation between groups and compute population level estimates. Table 8.5 provides estimates for the different measures by age group and across all ages. These estimates are based on deprivation score thresholds of 17 for children, 24 for working-age adults and 24 for pensioners. As noted previously, these may not be optimum thresholds. Estimated material deprivation rates are highest for children, followed by working-age adults and lowest for pensioners. The all-age estimates reflect material deprivation rates within the different age groups and population shares. All age estimates are higher than estimates for pensioners and a little lower than for working-age adults.
Table 8.5: Estimates of material deprivation rates based on different measures by age group using the FRS test question dataset (April, May and June 2022)
| Constrained lack | Financially constrained lack | Financially constraint lack (non-missing income) | Financially constraint lack combined with low-income | Constraint lack pensioners or financial constraint lack children and working-age | |
|---|---|---|---|---|---|
| Children | 20.62 | 17.58 | 17.82 | 10.63 | 17.58 |
| Working-age | 17.80 | 15.50 | 15.58 | 9.03 | 15.50 |
| Pensioners | 7.57 | 5.58 | 5.62 | 3.01 | 7.57 |
| All-age | 16.48 | 14.07 | 14.14 | 8.21 | 14.45 |
| Sample size | 10,532 | 10,532 | 9,356 | 9,356 | 10,532 |
Source: Authors’ analysis of FRS test question dataset (April, May and June 2022).
A similar approach could be used to compute a household-level deprivation rate. Using this approach, a household would be classified as deprived if any member of the household was deprived according to the relevant age-specific deprivation measure.
Recommendations on developing a core set of questions for the whole population alongside measures aimed at specific family types
Recommendations were accepted for a core set of household-level items in the revised measures for working-age adults, children and pensioners. The Review went further and assessed the advantages and disadvantages of developing a whole population, or household-level, material deprivation measure. The advantage of a whole population or household-level measure is that it would make it easier to compare rates of material deprivation between different age-groups as well as estimate population level rates. The disadvantage is that creating such a measure is likely to involve compromises which lead to less accurate estimates of material deprivation than the current age-group specific approach. Challenges were identified including lack of a consistent relationship between the individual-level measures and a measure constructed from household items alone. Therefore, we would not recommend moving to a measure based on household items alone, or combined with some individual-level items, at this point. If DWP wishes to pursue this further, the following work should be considered:
(a) For a measure based on the core household-level items alone, determine an optimum deprivation threshold, whether the measure should be based on wider constrained lack or financially constrained lack of items and whether material deprivation status should be combined with a low-income indicator.
(b) Assessing whether an alternative approach to defining household-level material deprivation could be based on whether any household member is classified as materially deprived according to the age-group specific measures which have passed statistical tests and validation from qualitative research.
(c) Exploring whether estimates from the age-group specific material deprivation measures can be added together and combined to provide valid whole population estimates.
Without further research, we recommend material deprivation is measured at the individual-level, based on the tried and tested measures for working-age adults, children and pensioners.
9. References
Abe, A. and Pantazis, C. (2014) ‘Comparing public perceptions of the necessities of life across two societies: Japan and the United Kingdom’, Social Policy and Society, 13, 1, 69-88.
Alkire, S. and Foster, J. (2011) ‘Counting and multidimensional poverty measurement’, Journal of Public Economics, 95, 7-8, 476–87.
Alkire, S., Bastagli, F. Burchardt, T., Clark, D., Holder, H., Ibrahim, S., Munoz, M., Terrazas, P., Tsang, T. and Vizard, P. (2009) ‘Developing the Equality Measurement Framework: selecting the indicators’, Research report (31). Equality and Human Rights Commission.
Bailey, N. (2020) ‘Measuring poverty efficiently using adaptive deprivation scales’, Social Indicators Research, 149, 891–910.
Berthoud, R., Blekesaune, M. and Hancock, R. (2006) ‘Are ‘poor’ pensioners ‘deprived’?’, Department for Work and Pensions Research Report No 364, DWP.
Berthoud, R., Bryan, M. and Bardasi, E. (2004) ‘The dynamics of deprivation: The relationship between income and material deprivation over time’, Families and Children Strategic Analysis Programme, Department for Work and Pensions Research Report No 219, DWP: London.
Boarini, R. and d’Ercole, M. (2006) ‘Measures of material deprivation in OECD Countries’, OECD Social, Employment and Migration Working Papers, No. 37, OECD Publishing, Paris.
Bradshaw, J. and Finch, N. (2003) ‘Overlaps in dimensions of poverty’, Journal of Social Policy, 32, 4, 513-525.
Bradshaw, J. and Mayhew, E. (2010) ‘Understanding extreme poverty in the European Union’, European Journal of Homelessness, 4, 171-186.
Bradshaw, J., Middleton, S., Davis, A., Oldfield, N., Smith, N., Cusworth, L. and Williams, J. (2008) ‘A minimum income standard for Britain: what people think’, York: Joseph Rowntree Foundation.
Burchardt, T., Le Grand, J. and Piachaud, D. (1999) ‘Social exclusion in Britain 1991-1995’, Social Policy and Administration, 33, 227-244. https://doi.org/10.1111/1467-9515.00148
Callan, T., Nolan, B. and Whelan, C.T. (1993) ‘Resources, deprivation and the measurement of poverty’, Journal of Social Policy, 22, 2, 141.
Correa, T., Valenzuela S. and Pavez, I. (2022) ‘For better and for worse: A panel survey of how mobile-only and hybrid Internet use affects digital skills over time’, New Media & Society.
Davies, A., Hirsch, D., Padley, M. and Marshall, L. (2015) ‘How much is enough? Reaching social consensus on minimum household needs’, Centre for Research in Social Policy Loughborough University.
Davis, A., Stone, J., Blackwell, C., Padley, M., Shepherd, C. and Hirsch, D. (2022) ‘A Minimum Income Standard for the United Kingdom in 2022’, Joseph Rowntree Foundation, https://www.jrf.org.uk/report/minimum-income-standard-uk-2022
Deeming, C. (2005) ‘Minimum Income Standards: How might Budget Standards be set for the UK?’ Journal of Social Policy, 34, 4, 619-636.
Dominy, N. and Kempson, E. (2006) ‘Understanding older people’s experiences of poverty and material deprivation’, Department for Work and Pensions Research Report No 363, London: DWP.
DWP [Department for Work and Pensions] (2023a) ‘Household below average income series: quality and methodology information report FYE 2022’, Department for Work and Pensions. Available at: https://www.gov.uk/government/statistics/households-below-average-income-for-financial-years-ending-1995-to-2022/households-below-average-income-series-quality-and-methodology-information-report-fye-2022 (last accessed 21 January 2024).
DWP [Department for Work and Pensions] (2023b) ‘Household below average income series: an analysis of the UK income distribution: FYE 1995 to FYE 2022’, Department for Work and Pensions. Available at: https://www.gov.uk/government/statistics/households-below-average-income-for-financial-years-ending-1995-to-2022/households-below-average-income-an-analysis-of-the-uk-income-distribution-fye-1995-to-fye-2022 (last accessed 10 August 2023).
DWP [Department for Work and Pensions] (2011) ‘Households Below Average Income (HBAI): technical note on pensioner material deprivation’, Available at: https://www.gov.uk/government/statistics/households-below-average-income-hbai-technical-note-on-pensioner-material-deprivation (last accessed 27 October 2022).
DWP [Department for Work and Pensions] (2003) ‘Measuring child poverty’. Available at: https://www.bristol.ac.uk/Depts/PovertyCentre/downloads/keyofficialdocuments/Measuring%20child%20poverty%20DWP%202003.pdf (last accessed 27 October 2022).
Fahmy, E. (2014) ‘Poverty in Britain, 1999 and 2012: some emerging findings’, Journal of Poverty and Social Justice, 22, 3, 181-191.
Fahmy, E., Sutton, E. and Pemberton, S. (2015) ‘Are we all agreed? Consensual methods and the ‘Necessities of Life’ in the UK today’, Journal of Social Policy, 44, 3, 591-610.
Ferragina, E., Tomlinson, M. and Walker, R. (2013) ‘Poverty, participation and choice: the legacy of Peter Townsend’, Joseph Rowntree Foundation, York: JRF.
Flaherty, J. (2008) ‘Getting By, Getting Heard: Poverty and Social Exclusion in the Borders’, Glasgow: Report for the Scottish Borders Commission.
Garratt, K., Harker, R. and Kulakiewicz, A. (2022) ‘NHS Dentistry in England’, Commons Library Debate Pack 17, House of Commons Library. Available at: https://commonslibrary.parliament.uk/research-briefings/cdp-2022-0112/
Gordon, D. (2000) ‘The scientific measurement of poverty. Recent theoretical advances’, in Bradshaw, J., and Sainsbury, R. (eds.), Researching Poverty, Aldershot: Ashgate.
Gordon, D., Adelman, L., Ashworth, K., Levitas, R., Pantazis, C., Patsios, D., Payne, S., Townsend, P., Middleton, S., Bradshaw, J. and Williams, J. (2000) ‘Poverty and social exclusion in Britain’, Research Report, Joseph Rowntree Foundation, York: JRF.
Guio, A-C. and Engsted Maquet, I. (2007) ‘Material deprivation and poor housing, in: Eurostat (eds.) Comparative EU Statistics on income and living conditions: Issues and challenges’, EU Methodologies and working papers. Luxembourg: Publications Office of the European Union.
Guio, A-C., Gordon, D. and Marlier, E. (2012) ‘Measuring material deprivation in the EU: Indicators for the whole population and child specific indicators’, Eurostat Methodologies and Working Papers, Luxembourg: Publication Office of the EU.
Guio, A-C., Gordon, D., Marlier, E., Najera, H. and Pomati, M. (2018) ‘Towards an EU measure of child deprivation’, Child Indicators Research, 11, 3, 835-860.
Guio, A-C., Gordon, D., Najera, H. and Pomati, M. (2017) ‘Revising the EU material deprivation variables’, Eurostat Working Papers, Luxembourg: Publications Office of the European Union.
Guio, A-C., Marlier, E., Gordon, D., Fahmy, E., Nandy, S. and Pomati, M. (2016) ‘Improving the measurement of material deprivation at the European Union level’, Journal of European Social Policy, 26, 3, 219-233.
Halleröd, B. (1994) ‘A new approach to the direct consensual measure of poverty’, SPRC Discussion Paper No. 50, Social Policy Research Centre, University of New South Wales.
Halleröd, B. (1995) ‘The truly poor: Direct and indirect consensual measurement of poverty in Sweden’, Journal of European Social Policy, 5, 2, 111–129.
Halleröd, B. (2006) ‘Sour grapes: relative deprivation, adaptive expectations and the measurement of poverty’, Journal of Social Policy, 35, 3, 371-390.
Halleröd, B., Bradshaw, J. and Holmes, H. (1997) ‘Adapting the consensual definition of poverty’, in Gordon, D., and Pantazis, C. (eds.) Breadline Britain in the 1990s, Aldershot: Ashgate.
Hick, R. (2013) ‘Poverty, preference or pensioners? Measuring material deprivation in the UK’, Fiscal Studies, 34, 31-54. https://doi.org/10.1111/j.1475-5890.2013.00176.x
Hills, J., Cunliffe, J. and Obolenskaya, P. (2016) ‘The changing structure of UK inequality since the crisis’, in Lupton, R., Burchardt, T., Hills, J., Stewart, K., and Vizard, P. (eds.) Social Policy in a Cold Climate: policies and their consequences since the crisis, Bristol: Policy Press.
Hirsch, D. (2015) ‘A minimum income standard for the UK in 2015’, York: Joseph Rowntree Foundation.
Hirsch, D. and Smith, N. (2010) ‘Family values – parents’ views on necessities for families with children’, Department for Work and Pensions Research Report 641, London: DWP, https://www.gov.uk/government/publications/family-values-parents-views-on-necessities-for-families-with-children-rr641
Johnson, V., Currie, G. and Stanley, J. (2010) ‘Measures of disadvantage: is car ownership a good indicator?’, Social Indicators Research, 7, 439-450.
Joyce, R. (2014) ‘Child poverty in Britain: recent trends and future prospects’, IFS Working Paper W15/07, London: Institute for Fiscal Studies.
Karagiannaki, E. (2020) ‘Persistent risk of poverty and severe material deprivation’, Social Situation Monitor, Luxembourg: Publications Office of the European Union.
Kenworthy, L. (2007) ‘Measuring poverty and material deprivation’, report prepared for Statistics Canada. Available at: https://lanekenworthy.files.wordpress.com/2014/07/2007measuringpovertyandmaterialdeprivation.pdf
Kotecha, M., Arthur, S. and Coutinho, S. (2013) ‘Understanding the relationship between pensioner poverty and material deprivation’, Department for Work and Pensions Research Report 827, London: DWP, https://assets.publishing.service.gov.uk/government/uploads/system/uploads/attachment_data/file/197675/rrep827.pdf
Lansley, S. and Mack, J. (2015) ‘Breadline Britain: the rise of mass poverty’, London: Oneworld publications.
Legard, R., Gray M. and Blake, M. (2008) ‘Cognitive testing: older people and the FRS material deprivation questions’, Working Paper No 55, Department for Work and Pensions.
Lucas, K., Mattioli, G., Verlinghieri, E. and Guzman, A. (2016) ‘Transport poverty and its adverse social consequences’, Proceedings of the Institution of Civil Engineers – Transport, 169, 6, 353-365.
Mack, J. and Lansley, S. (1985) Poor Britain, London: Allen and Unwin.
Main, G. and Bradshaw, J. (2014) ‘Child poverty and social exclusion: Final report of 2012 PSE study’, Poverty and Social Exclusion in the UK, https://www.poverty.ac.uk/sites/default/files/attachments/PSE-Child-poverty-and-exclusion-final-report-2014.pdf
Main, G. and Bradshaw, J. (2012) ‘A child material deprivation index’, Child Indicators Research, 5, 503-521 https://doi.org/10.1007/s12187-012-9145-7
McKay, S. (2004) ‘Poverty or preference: what do ‘consensual deprivation indicators’ really mean?’, Fiscal Studies, 25, 201-223. https://doi.org/10.1111/j.1475-5890.2004.tb00102.x
McKay, S. (2008) ‘Measuring material deprivation among older people: Methodological study to revise the Family Resources Survey questions’, Working Paper No 54, Department for Work and Pensions.
McKay, S. (2010) ‘Using the new Family Resources Survey question block to measure material deprivation among pensioners’, Department for Work and Pensions Working Paper No 89, London: DWP.
McKay, S. (2011) ‘Review of the child material deprivation items in the Family Resources Survey’, Department for Work and Pensions Working Paper 746, London: DWP.
McKay, S. and Collard, S. (2004) ‘Developing deprivation questions for the Family Resources Survey’, Department for Work and Pensions Working Paper 13, London: DWP.
McKnight, A. (2013a) ‘Material deprivation among children – how parents evaluate ‘need’ in relation to available income’, CASE Annual Report 2012, CASEreport 76, Centre for Analysis of Social Exclusion, London School of Economics, https://sticerd.lse.ac.uk/dps/case/cr/casereport76.pdf
McKnight, A. (2013a) ‘Measuring material deprivation over the economic crisis: Does a re-evaluation of ‘need’ affect measures of material deprivation?’, GINI policy paper 4, Growing Inequalities’ Impacts research programme, http://gini-research.org/articles/papers
McKnight, A. (2013b) ‘Material deprivation among children – how parents evaluate ‘need’ in relation to available income’, CASE Annual Report 2012, https://sticerd.lse.ac.uk/CASE/_NEW/PUBLICATIONS/abstract/?index=4250.
McKnight, A., Mendes Loureiro, P., Vizard, P., Prats, A., Claver, A. and Kumar, C. (2019) ‘Multidimensional Inequality Framework’, Atlantic Fellows for Social and Economic Equity Programme, International Inequalities Institute, LSE.
Nolan, B. and Whelan, C.T. (2011) ‘Understanding the mismatch between income poverty and material deprivation’, in Nolan, B., and Whelan, C.T. (eds.) Poverty and Deprivation in Europe, Oxford: Oxford University Press.
Pantazis, C. Townsend, P. and Gordon, D. (2006) ‘The necessities of life’, in Pantazis, C., Gordon, D., and Levitas, R. (eds.), Poverty and Social Exclusion in Britain. The Millennium Survey, Bristol: The Policy Press.
Perry, B. (2002) ‘The mismatch between income measures and direct outcome measures of poverty’, Social Policy Journal of New Zealand, 19, 101-127.
Piachaud, D. (1981) ‘Peter Townsend and the Holy Grail’, New Society, 10 September.
Ridge, T. (2002) Childhood poverty and social exclusion: from a child’s perspective, Bristol: Policy Press.
Ridge, T. (2011) ‘The everyday costs of poverty in childhood: A review of qualitative research exploring the lives and experiences of low-income children in the UK’, Children and Society, 25, 73-84.
Ringen, S. (1988) ‘Direct and indirect measures of poverty’, Journal of Social Policy, 17, 3, 351-365.
Saunders, P., Naidoo, Y. and Griffiths, M. (2008) ‘Towards new indicators of disadvantage: Deprivation and social exclusion in Australia’, Australian Journal of Social Issues, 43, 175-194.
Scheerder, A., van Deursen, A. and van Dijk, J. (2017) ‘Determinants of Internet skills, use and outcomes: A systematic review of the second- and third-level digital divide’, Telematics and informatics, 34, 8, 1607-1624.
Szeles, M. R. and Fusco, A. (2013) ‘Item response theory and the measurement of deprivation: evidence from Luxembourg data’, Quality and Quantity, 47, 1545-1560.
Tavakol, M. and Dennick, R. (2011) ‘Making sense of Cronbach’s alpha’, International Journal of Medical Education, 2, 53-55.
Townsend, P. (1979) Poverty in the United Kingdom, London: Penguin Books.
Townsend, P. (2000) ‘Post-1945 poverty research and things to come’, in Bradshaw, J., and Sainsbury, R. (eds.), Researching Poverty, Aldershot: Ashgate.
van Deursen, A.J. and van Dijk J. (2019) ‘The first-level digital divide shifts from inequalities in physical access to inequalities in material access’, New Media & Society, 21, 2, 354-375.
van Dijk, J. (2020) The digital divide, Cambridge: Polity Press.
Walker, R. (1987) ‘Consensual approaches to the definition of poverty: Towards an alternative methodology’, Journal of Social Policy, 16, 2, 213-226.
Whelan, C.T. and Maître, B. (2013) ‘Material deprivation, economic stress, and reference groups in Europe: An analysis of EU-SILC 2009’, European Sociological Review, 29, 6, 1162-1174, https://doi.org/10.1093/esr/jct006
Whelan, C.T., Nolan, B. and Maître, B. (2006) ‘Measuring consistent poverty in Ireland with EU-SILC data’, ESRI Working Paper No. 165, https://www.esri.ie/system/files/media/file-uploads/2015-07/WP165.pdf
Wilson, W. (2023) ‘Does the law set an age at which children can’t share a bedroom (England)?’, House of Commons Library, https://commonslibrary.parliament.uk/does-the-law-set-an-age-at-which-children-cant-share-a-bedroom/
Appendix 1. Items in the UK material deprivation measures and the EU measure
Table A1.1: Items in the UK child material deprivation measure
| Child item or adult/household item | Item | 2004 to 2005 | 2010 to 2011 |
|---|---|---|---|
| Adult or household item | Keep home in decent state of decoration | Yes | Yes |
| Adult or household item | Holiday away from home one week a year (not with relatives at their home) | Yes | Yes |
| Adult or household item | Household contents insurance | Yes | Yes |
| Adult or household item | Regular savings for rainy day or retirement £10 a month | Yes | Yes |
| Adult or household item | Replace worn out furniture | Yes | Yes |
| Adult or household item | Replace or repair broken electrical goods | Yes | Yes |
| Adult or household item | Small amount of money to spend on self each week | Yes | Yes |
| Adult or household item | Keep home adequately warm in winter | Yes | Yes |
| Adult or household item | Able to keep up with bills and regular debt repayments* | Yes | |
| Adult or household item | Two pairs of all-weather shoes | Yes | |
| Adult or household item | Hobby or leisure activity | Yes | |
| Adult or household item | Family round for meal once a month | Yes | |
| Child item | Outdoor space or facilities nearby where they can play safely* | Yes | Yes |
| Child item | Children aged 10+ of different sex not sharing a bedroom | Yes | Yes |
| Child item | Celebrations on special occasions | Yes | Yes |
| Child item | Leisure equipment e.g. sports or bicycle | Yes | Yes |
| Child item | Family holiday away from home once a year | Yes | Yes |
| Child item | Hobby or leisure activity | Yes | Yes |
| Child item | Friends round for tea or snack fortnightly | Yes | Yes |
| Child item | School trips | Yes | Yes |
| Child item | Toddler or nursery group once a week | Yes | Yes |
| Child item | Organised activity outside school each week | Yes | |
| Child item | Fresh fruit or vegetables once a day | Yes | |
| Child item | A warm winter coat | Yes | |
| Child item | Swimming once a month | Yes | |
| Total number of items | 21 | 21 |
A * indicates items measured by simple absence
For each adult/household item respondents are asked if:
-
We/I have this
-
We/I would like to have this but cannot afford this at the moment
-
We/I do not want/need this at the moment
-
Does not apply
For each child item respondents are asked if:
-
Child(ren) has/have this
-
Child(ren) would like to have this but we cannot afford this at the moment
-
Child(ren) do not want/need this at the moment
-
Does not apply
Table A1.2: Items in the UK pensioner deprivation measure (applies to adults who have reached State Pension Age)
| Item | 2008 to 2009 |
|---|---|
| At least one filling meal a day | Yes |
| Go out socially at least once a month | Yes |
| See friends or family at least once a month | Yes |
| Take a holiday away from home for at least a week, once a year | Yes |
| Able to replace cooker if it broke down | Yes |
| Home kept in good state of repair | Yes |
| Heating, electrics, plumbing and drains working | Yes |
| Have a damp-free home | Yes |
| Home kept adequately warm | Yes |
| Able to pay regular bills without cutting back on essentials | Yes |
| Have a telephone to use, whenever needed | Yes |
| Have access to a car or taxi, whenever needed | Yes |
| Have hair done or cut regularly | Yes |
| Have a warm waterproof coat | Yes |
| Able to pay an unexpected expense of £200* | Yes |
| Total number of items | 15 |
A* indicates item measured by simple absence
Where respondents do not have an item, they are asked whether this is because:
-
I do not have the money for this
-
This is not a priority for me on my current income
-
My health or disability prevents me
-
It is too much trouble or too tiring
-
There is no one to do this with or help me
-
This is not something I want
-
It is not relevant to me
-
Other reason
They are counted as deprived of an item where they lack it for any reason apart from:
-
This is not something I want
-
It is not relevant to me
Table A1.3: Items in the UK working-age adult material deprivation measure
| Item | 2010 to 2011 |
|---|---|
| Keep home in decent state of decoration | Yes |
| Holiday away from home one week a year (not with relatives at their home) | Yes |
| Household contents insurance | Yes |
| Regular savings for rainy day or retirement £10 a month | Yes |
| Replace worn out furniture | Yes |
| Replace or repair broken electrical goods | Yes |
| Small amount of money to spend on self each week | Yes |
| Keep home adequately warm in winter | Yes |
| Able to keep up with bills and regular debt repayments* | Yes |
| Total number of items | 9 |
A * indicates items measured by simple absence
For each adult/household item respondents are asked if:
-
We/I have this
-
We/I would like to have this but cannot afford this at the moment
-
We/I do not want/need this at the moment
-
Does not apply
The UK working-age adult measure comprises the adult/household items included in the UK child measure. The series was first published in 2023 with a backdated series for financial years ending 2011 to 2022.
2009
Able to face unexpected expenses
One week annual holiday away from home
Able to avoid arrears (in mortgage or rent, utility bills or hire purchase instalments)
A meal with meat, chicken or fish every second day
Keep home adequately warm
A car/van for personal use
A washing machine
A television
A telephone
2014
Able to face unexpected expenses
One week annual holiday away from home
Able to avoid arrears (in mortgage or rent, utility bills or hire purchase instalments)
A meal with meat, chicken or fish every second day
Keep home adequately warm
A car or van for personal use
Replace worn-out clothes with some new ones
Have two pairs of properly fitting shoes
Spend a small amount of money each week on oneself
Have regular leisure activities
Get together with friends or family for a drink or meal at least monthly
Have an internet connection
Replace worn-out furniture
The original 9 item scale, adopted in 2009, was called the standard material deprivation indicator. The revised 13 item scale, adopted in 2014, is known as the material and social deprivation indicator.
Table A1.5: Items in the EU child material deprivation
| Child, household or adults in household | 2018 - item or activity |
|---|---|
| Child | Some new (not second-hand) clothes |
| Child | Two pairs of properly fitting shoes |
| Child | Fresh fruits and vegetables daily |
| Child | Meat, chicken, fish or vegetarian equivalent daily |
| Child | Books at home suitable for the children’s age |
| Child | Outdoor leisure equipment |
| Child | Indoor games |
| Child | Regular leisure activities |
| Child | Celebrations on special occasions |
| Child | Invitation of friends to play and eat from time to time |
| Child | Participation in school trips and school events that cost money |
| Child | Annual holiday |
| Household | Replace worn-out furniture |
| Household | Able to avoid arrears |
| Adults in the household | Access to internet |
| Household | Home adequately warm |
| Household | Access to a car for private use |
A child specific material deprivation indicator was adopted by the EU in 2018 with data collected for the first time in EU-SILC in 2021. The child indicator combines 12 new child specific items with five of the adult/household level items from the material and social deprivation indicator first introduced in 2014 (See Table A1.4). The material and social deprivation indicator continues to be used to measure deprivation among adults.
Appendix 2. List of items and activities discussed in focus groups classified into ten main categories
Items and activities that were included in the short-list of candidate necessities are marked with a * – although the final wording may differ.
Financial Security
1. Regular savings for rainy days
2. Household contents insurance*
3. Making minimum payments on your credit card to avoid extra charges
4. Not having money-worries at the end of every week or every month*
5. Passport or other photo ID
6. Being able to pay in advance for your funeral
7. Having money aside to cover unexpected expenses*
8. Regular payments to a workplace or private pension*
9. Keeping up with regular bills like rent, mortgage, electricity or Council tax/rates without cutting back on essentials*
10. Access to Banking Services*
Home and Living Conditions
11. Freezer
12. Washing Machine
13. Dishwasher
14. Microwave oven
15. Tumble dryer
16. Cable or satellite TV
17. Streaming/entertainment subscription
18. Games console and subscription (for children)
19. Beds and bedding for everyone
20. Table and chairs at which all the family can eat
21. Adequate floor covering (e.g. carpets in good condition and fit)
22. Home kept adequately warm*
23. Damp free home*
24. Home kept in a good state of decoration and repair*
25. Replace any worn out furniture
26. Curtains or window blinds
27. Heating, electrics, plumbing and drains kept in good working order*
28. Replace or repair appliances such as a refrigerator, washing machine or a cooker when broken*
29. Outdoor space (private or communal) that is well-kept
30. Good quality window and door locks
31. Home that is regularly cleaned
32. Adaptations to your home like grab rails, a walk-in shower, a wheelchair ramp or a stair lift
33. Green space within walking distance*
34. Able to afford to avoid living with someone you don’t want to live with (e.g. able to leave domestic abuse, undesired co-residence)
Food
35. Three meals a day*
36. Fresh fruit and/or vegetables every day*
37. Meat, chicken, fish or vegetarian equivalent
38. Eat the food that you would like to eat or that is culturally important to you
39. Feed the family without the need to visit a foodbank or rely on friends
Clothing
40. Warm waterproof coat
41. Two pairs of shoes
42. Replacing worn out clothes with new not second hand clothes
43. Clothes for special occasions
44. Appropriate clothes for work or job interview*
Health
45. Sanitary products
46. Any medicines prescribed by the doctor
47. Over the counter medicines (e.g. painkillers)
48. Optician consultation (covering charges for eye test, glasses/lenses if needed)
49. Dental treatments, including dental charges for check-ups and consultations*
50. Podiatry (foot care for older people) every 2 months
51. Gym membership
52. Sportswear
53. Buying or doing what you feel is necessary to keep yourself healthy in body and mind
54. Help in the home with personal care, if needed
55. Occasionally have a break for a few days from caring responsibilities
Communications
56. A mobile phone*
57. Reliable access to the internet at home*
58. Computer or tablet at home suitable for work, education or accessing services*
59. Fixed high speed internet at home (e.g. broadband)
60. Mobile broadband (‘data’) subscription
61. Internet and data service for work, education, job search and using services
Mobility
62. Access to reliable transport at reasonable time, ease, safety and cost*
63. Car or van
Items related to children
64. A toddler group/nursery/play group at least once a week (for pre-school children)*
65. Go on school trips*
66. Family day trips
67. Collect children from school
68. Financial contributions requested by nursery/school
69. School uniform*
70. School equipment (e.g. text books, calculator etc.)*
71. Printer and ink
72. Place to do homework at home*
73. Suitable books, indoor games and toys (including educational toys)*
74. Leisure equipment and sports gear for children (e.g. a bicycle)
75. Baby equipment such as cot, highchair and pram/pushchair (for babies)*
76. Enough clothes that children feel comfortable to wear*
77. At least one regular organized activity a week outside school, such as sport or a youth group*
78. Outdoor space or facilities nearby where they can play or hang out safely*
79. Attending and taking a gift to a friend’s party
80. Pocket money
81. Mobile phone (children age 11+)
82. Childcare (e.g. nursery/pre-school; out-of-hours services; play schemes for holidays; babysitting)
Things for oneself
83. A small amount of money to spend each week on yourself (not on your family)*
84. Fees to undertake training course or qualification: eg driving lessons, job-related qualifications
85. Have your hair done or cut regularly
86. A separate bed for each person or couple
87. Enough bedrooms for every child of 10 or over of a different sex to have their own bedroom*
88. Personal space (eg a bed/drawer/box etc that is yours and you know will be respected by others)
Social and leisure activities
89. A holiday away from home once a year
90. A break away from home once a year*
91. Visit family and friends*
92. A presentable home you are comfortable bringing friends or family back to
93. Friends around for a meal, tea or a snack*
94. Celebrations on special occasions such as birthdays, Christmas or other religious festivals, local festivals
95. Attending weddings and funerals
96. Attending place of worship
97. Gifts for friends/family
98. Go out socially, either alone or with other people (eg meeting up with people socially outside the home, going for a meal, going into town, to the pub, to other people’s homes)*
99. Eat out for special occasions*
100. Arrange childcare to go out socially
101. Get a take-away
102. Do a hobby or leisure activity (eg sports, cinema)
103. Club or society with regular paid subscription
Appendix 3. Reliability and additivity test results for items and activities included in the revised measures
Using the final sets of items and activities we repeated the tests for reliability and additivity.
Reliability test results
Item Response Theory model tests for severity and discrimination. To assess model estimates for severity, we used the same thresholds as in Section 5.4 to define three categories:
Pass = less than 3
Borderline fail = 3-3.5
Fail = greater than 3.5
Model estimates of discrimination scores indicate how well each item discriminates between the deprived and the non-deprived. We used the same three categories as earlier to assess the discrimination scores:
Pass = greater than 1.8
Borderline fail = 1.5-1.8
Fail = less than 1.5
A summary of the results are shown in Tables A3.1-A3.4 below.
These tables also include results for reliability of the internal consistency of the scales based on Cronbach’s Alpha. Firstly, Alpha estimates for overall material deprivation scale reliability are:
Working-age adult: Alpha = 0.886
Child: Alpha = 0.840
Pensioner: Alpha = 0.778
Pensioner (constrained lack): Alpha = 0.741
These estimates of internal consistency are all within the acceptable range 0.7-0.9. They are marginally higher based on the final set of items. The results for Alpha summarised in the tables are based on the effect of omitting each item one at a time. An increase in Alpha suggests that the internal consistency of the scale improves if the item is left out, and this is shown as a test fail in the tables.
Table A3.1: Summary of reliability test results: Working-age adults
| Individual or household | Item or activity | Severity | Discrimination | Alpha# |
|---|---|---|---|---|
| Individual | No regular money worries | B/Fail | ||
| Individual | Regular pension payments | Fail | ||
| Individual | 3 meals a day | |||
| Individual | Fresh fruit or vegetables daily | |||
| Individual | Clothes for work or job interview | |||
| Individual | Regular dental appointments | |||
| Individual | Annual break away from home | |||
| Individual | Go out socially monthly | |||
| Individual | See friends and family monthly | |||
| Individual | Small amount of money for self | |||
| Household | Able to pay bills | |||
| Household | Money aside for unexpected expenses | |||
| Household | Replace or repair appliances | |||
| Household | Home in good state of decoration and repair | |||
| Household | Home adequately warm | |||
| Household | Home damp free | Fail | Fail | |
| Household | Reliable internet | Fail | ||
| Household | Computer or tablet | |||
| Household | Reliable transport | |||
| Household | Heating, electrics and plumbing in good order | Fail | ||
| Household | Home contents insurance |
Source: Authors’ analysis of FRS test question dataset (April, May and June 2022).
Notes: Fail indicates an item failed the test; B/Fail indicates a borderline test result. # Alpha estimates are calculated using unweighted data.
Table A3.2: Summary of reliability test results: Children
| Individual or household | Item or activity | Severity | Discrimination | Alpha# |
|---|---|---|---|---|
| Individual | School trips | |||
| Individual | 3 meals a day | B/Fail | ||
| Individual | Fresh fruit or vegetables daily | |||
| Individual | Comfortable clothes | |||
| Individual | Organised weekly activity | |||
| Individual | Friends round monthly | |||
| Individual | Toys or games age suitable | |||
| Individual | Enough bedrooms | B/Fail | Fail | Fail |
| Individual | Toddler, nursery or playgroup | B/Fail | Fail | Fail |
| Individual | Place for homework | |||
| Individual | Annual break away from home | |||
| Household | Able to pay bills | |||
| Household | Money aside for unexpected expenses | |||
| Household | Replace or repair appliances | |||
| Household | Home in good state of decoration and repair | |||
| Household | Home adequately warm | |||
| Household | Home damp free | Fail | ||
| Household | Reliable internet | B/Fail | B/Fail | Fail |
| Household | Computer or tablet | B/Fail | ||
| Household | Reliable transport | |||
| Household | Heating, electrics and plumbing in good order | B/Fail | Fail | |
| Household | Home contents insurance |
Source: Authors’ analysis of FRS test question dataset (April, May and June 2022).
Notes: Fail indicates an item failed the test; B/Fail indicates a borderline test result. # Alpha estimates are calculated using unweighted data.
Table A3.3: Summary of reliability test results: Pensioners (financially constrained lack)
| Individual or household | Item or activity | Severity | Discrimination | Alpha# |
|---|---|---|---|---|
| Individual | Without regular money worries | Fail | ||
| Individual | Annual break away from home | |||
| Individual | Fresh fruit or vegetables daily | |||
| Individual | 3 meals a day | |||
| Individual | Regular dental appointments | B/Fail | ||
| Individual | Small amount of money for self | |||
| Individual | Go out socially monthly | |||
| Individual | See friends and family monthly | Fail | B/Fail | Fail |
| Household | Able to pay bills | |||
| Household | Money aside for unexpected expenses | |||
| Household | Replace or repair appliances | |||
| Household | Home in good state of decoration and repair | B/Fail | B/Fail | |
| Household | Home adequately warm | B/Fail | ||
| Household | Home damp free | B/Fail | Fail | |
| Household | Reliable internet | B/Fail | ||
| Household | Computer or tablet | Fail | ||
| Household | Reliable transport | |||
| Household | Heating, electrics and plumbing in good order | B/Fail | ||
| Household | Home contents insurance |
Source: Authors’ analysis of FRS test question dataset (April, May and June 2022).
Notes: Fail indicates an item failed the test; B/Fail indicates a borderline test result. # Alpha estimates are calculated using unweighted data.
Table A3.4: Summary of reliability test results: Pensioners (wider constrained lack)
| Individual or household | Item or activity | Severity | Discrimination | Alpha# |
|---|---|---|---|---|
| Individual | Without regular money worries | Fail | ||
| Individual | Annual break away from home | Fail | ||
| Individual | Fresh fruit or vegetables daily | |||
| Individual | 3 meals a day | B/Fail | ||
| Individual | Regular dental appointments | Fail | ||
| Individual | Small amount of money for self | |||
| Individual | Go out socially monthly | Fail | ||
| Individual | See friends and family monthly | Fail | Fail | Fail |
| Household | Able to pay bills | |||
| Household | Money aside for unexpected expenses | |||
| Household | Replace or repair appliances | |||
| Household | Home in good state of decoration and repair | B/Fail | ||
| Household | Home adequately warm | B/Fail | ||
| Household | Home damp free | Fail | ||
| Household | Reliable internet | Fail | ||
| Household | Computer or tablet | B/Fail | Fail | |
| Household | Reliable transport | B/Fail | Fail | |
| Household | Heating, electrics, plumbing in good order | B/Fail | ||
| Household | Home contents insurance | B/Fail |
Source: Authors’ analysis of FRS test question dataset (April, May and June 2022).
Notes: Fail indicates an item failed the test; B/Fail indicates a borderline test result. # Alpha estimates are calculated using unweighted data.
Additivity test results
Additivity tests assess whether greater degrees of deprivation in terms of higher material deprivation scores (more items and activities lacked by individuals) are associated with poorer living standards. Here we assess additivity by regressing the number of items lacking due to a constraint (financial constraint for working-age adults and children and wider constraint for pensioners) against after housing cost equivalised net household income (Table A3.5). These regression results are based on the final sets of items and activities. In each of the regression models, the coefficient on income is negative and highly statistically significant which means that higher income is associated with lower material deprivation scores based on the number of items which are lacked.
Table A3.5: OLS regression results - dependent variable: cumulative sum of items and activities lacked due to a financial constraint (working-age adults and children) or wider constraint (pensioners)
| All or lacking at least one item | Working-age | Children | Pensioners | |
|---|---|---|---|---|
| All | AHC income (natural log) | -1.715 | -1.442 | -0.690 |
| All | p-value | 0.000 | 0.000 | 0.000 |
| All | Observations | 4,812 | 1,868 | 2,385 |
| All | R-squared | 0.174 | 0.163 | 0.067 |
| Lacking at least one item | AHC income (natural log) | -1.759 | -0.996 | -0.559 |
| Lacking at least one item | p-value | 0.000 | 0.000 | 0.000 |
| Lacking at least one item | Observations | 2,664 | 912 | 870 |
| Lacking at least one item | R-squared | 0.158 | 0.067 | 0.035 |
Source: Authors’ analysis of FRS test question dataset (April, May and June 2022).
Notes: Robust standard errors. Models include a constant term.
Appendix 4. Reliability and additivity tests on core household items included in the revised measures
Using the final set of items and activities we repeated the tests for reliability and additivity using only the core household-level items.
Reliability test results
Item Response Theory model test for severity and discrimination. To assess model estimates for severity, we used the same thresholds as in Section 5.4 to define three categories:
Pass = less than 3
Borderline fail = 3-3.5
Fail = greater than 3.5
Model estimates of discrimination scores indicate how well each item discriminates between the deprived and the non-deprived. We used the same three categories as earlier to assess the discrimination scores:
Pass = greater than 1.8
Borderline fail = 1.5-1.8
Fail = less than 1.5
A summary of the results are shown in Tables A4.1 to A4.4 below.
These tables also include results for reliability of the internal consistency of the scales based on Cronbach’s Alpha. Firstly, Alpha estimates for overall material deprivation scale reliability are:
Working-age adult: Alpha = 0.795
Child: Alpha = 0.778
Pensioner: Alpha = 0.673
Pensioner (constrained lack): Alpha = 0.665
All (financial constrained lack): Alpha = 0.782
Not all of these estimates of internal consistency of the scales are within the acceptable range 0.7 to 0.9. Estimates for pensioners based on household-level items only are lower than 0.7 and, therefore, fail this test. Overall, the estimates are lower for each age group than for scales which include individual level items as well as household-level items.
The results for Alpha summarised in the tables are based on the effect of omitting each item one at a time. An increase in Alpha suggests that the internal consistency of the scale improves if the item is left out, and this is shown as a test fail in the tables.
Table A4.1: Summary of reliability test results for household-items: Working-age adults
| Household or individual | Item or activity | Severity | Discrimination | Alpha# |
|---|---|---|---|---|
| Household | Able to pay bills | |||
| Household | Money aside for unexpected expenses | |||
| Household | Replace or repair appliances | |||
| Household | Home in good state of decoration and repair | |||
| Household | Home adequately warm | |||
| Household | Home damp free | Fail | ||
| Household | Reliable internet | |||
| Household | Computer or tablet | |||
| Household | Reliable transport | |||
| Household | Heating, electrics and plumbing in good order | |||
| Household | Home contents insurance |
Source: Authors’ analysis of FRS test question dataset (April, May and June 2022).
Notes: Fail indicates an item failed the test; B/Fail indicates a borderline test result. # Alpha estimates are calculated using unweighted data.
Table A4.2: Summary of reliability test results for household-items: Children
| Household or individual | Item or activity | Severity | Discrimination | Alpha# |
|---|---|---|---|---|
| Household | Able to pay bills | |||
| Household | Money aside for unexpected expenses | |||
| Household | Replace or repair appliances | |||
| Household | Home in good state of decoration and repair | |||
| Household | Home adequately warm | |||
| Household | Home damp free | Fail | ||
| Household | Reliable internet | B/Fail | B/Fail | Fail |
| Household | Computer or tablet | Fail | ||
| Household | Reliable transport | B/Fail | ||
| Household | Heating, electrics and plumbing in good order | B/Fail | B/Fail | Fail |
| Household | Home contents insurance | B/Fail |
Source: Authors’ analysis of FRS test question dataset (April, May and June 2022).
Notes: Fail indicates an item failed the test; B/Fail indicates a borderline test result. # Alpha estimates are calculated using unweighted data.
Table A4.3: Summary of reliability test results for household-items: Pensioners (financially constrained lack)
| Household or individual | Item or activity | Severity | Discrimination | Alpha# |
|---|---|---|---|---|
| Household | Able to pay bills | |||
| Household | Money aside for unexpected expenses | |||
| Household | Replace or repair appliances | |||
| Household | Home in good state of decoration/repair | B/Fail | ||
| Household | Home adequately warm | Fail | ||
| Household | Home damp free | B/Fail | Fail | |
| Household | Reliable internet | B/Fail | ||
| Household | Computer or tablet | Fail | ||
| Household | Reliable transport | |||
| Household | Heating, electrics and plumbing in good order | B/Fail | ||
| Household | Home contents insurance |
Source: Authors’ analysis of FRS test question dataset (April, May and June 2022).
Notes: Fail indicates an item failed the test; B/Fail indicates a borderline test result. # Alpha estimates are calculated using unweighted data.
Table A4.4: Summary of reliability test results for household-items: Pensioners (wider constrained lack)
| Household or individual | Item or activity | Severity | Discrimination | Alpha# |
|---|---|---|---|---|
| Household | Able to pay bills | |||
| Household | Money aside for unexpected expenses | |||
| Household | Replace or repair appliances | |||
| Household | Home in good state of decoration and repair | B/Fail | ||
| Household | Home adequately warm | B/Fail | ||
| Household | Home damp free | Fail | ||
| Household | Reliable internet | Fail | ||
| Household | Computer or tablet | Fail | ||
| Household | Reliable transport | B/Fail | Fail | Fail |
| Household | Heating, electrics and plumbing in good order | B/Fail | ||
| Household | Home contents insurance |
Source: Authors’ analysis of FRS test question dataset (April, May and June 2022).
Notes: Fail indicates an item failed the test; B/Fail indicates a borderline test result. # Alpha estimates are calculated using unweighted data.
Table A4.5: Summary of reliability test results for household-items: All ages (financially constrained lack)
| Household or individual | Item or activity | Severity | Discrimination | Alpha# |
|---|---|---|---|---|
| Household | Able to pay bills | |||
| Household | Money aside for unexpected expenses | |||
| Household | Replace or repair appliances | |||
| Household | Home in good state of decoration and repair | |||
| Household | Home adequately warm | |||
| Household | Home damp free | Fail | ||
| Household | Reliable internet | B/Fail | B/Fail | |
| Household | Computer or tablet | B/Fail | ||
| Household | Reliable transport | |||
| Household | Heating, electrics and plumbing in good order | B/Fail | Fail | |
| Household | Home contents insurance |
Source: Authors’ analysis of FRS test question dataset (April, May and June 2022).
Notes: Fail indicates an item failed the test; B/Fail indicates a borderline test result. # Alpha estimates are calculated using unweighted data.
Additivity test results
Additivity tests assess whether greater degrees of deprivation in terms of higher material deprivation scores (more items and activities lacked by individuals) are associated with poorer living standards. We assess additivity by regressing the number of household-level items which are lacked due to a financial constraint against AHC equivalised net household income (Table A4.6). In each regression model, the coefficient on income is negative and highly statistically significant which means that for each age group higher income is associated with lower material deprivation scores based on the number of items which are lacked. The exception is for pensioners in the model which restricts the sample to individuals who lack at least one household-level item.
Table A4.6: OLS regression results - dependent variable: cumulative sum of household items and activities lacked due to a financial constraint
| All or lacking at least one item | Working-age | Children | Pensioners | All ages | |
|---|---|---|---|---|---|
| All | AHC income (natural log) | -0.822 | -1.023 | -0.384 | -0.798 |
| All | p-value | 0.000 | 0.000 | 0.000 | 0.000 |
| All | Observations | 4,812 | 1,868 | 2,385 | 9,490 |
| All | R-squared | 0.165 | 0.170 | 0.064 | 0.150 |
| Lacking at least one item | AHC income (natural log) | -0.682 | -0.614 | -0.103 | -0.605 |
| Lacking at least one item | p-value | 0.000 | 0.000 | 0.226 | 0.000 |
| Lacking at least one item | Observations | 1,565 | 839 | 497 | 2,951 |
| Lacking at least one item | R-squared | 0.086 | 0.062 | 0.003 | 0.068 |
Source: Authors’ analysis of FRS test question dataset (April, May and June 2022).
Notes: Robust standard errors. Models include a constant term.
-
Joint variability. ↩
-
The focus groups were held in a single month: January 2022. ↩
-
The final list of items and activities, and associated survey questions had to be agreed by early February 2022 to meet the FRS timetable. ↩
-
There is no age at which it is unlawful for siblings to share a bedroom, including siblings of opposite sexes (Wilson, 2023). However, age and room sharing is taken into account in assessing whether a household is statutorily overcrowded. According to the Housing Act 1985, a household may be statutorily overcrowded where children of the opposite sex over the age of 10 have to share a room. But, in allocating housing, local authorities can take into account all rooms if large enough to accommodate a bed (including living rooms and kitchens). When setting the rules governing the number of bedrooms households qualify for, local authorities use their own criteria but they must ensure the rules do not result in households being statutorily overcrowded. Most local authorities’ allocation schemes are more generous than the statutory room standard (Wilson, 2023). ↩
-
Every year the FRS does not gather data on material deprivation from a small proportion of working-age adults (this proportion varies year-on-year but is typically between 5 to 10%) (DWP, 2023a). Missing data appears to be non-random and predominantly is missing from those living in multiple benefit unit households or working-age adults in a couple where the other member of that couple is of pension age. Missing values are imputed using a method called hot-decking (DWP, 2023a). Imputation was not possible for the test question dataset. Non-response is likely to be higher in the test question dataset as the test questions were included in an additional module and respondents were given the choice as to whether to respond. ↩
-
Throughout the analysis presented in this report the measure of income used is net equivalised household income unless otherwise stated. ↩
-
If respondents indicated that they lacked an item or activity because 1) We/I do not have the money for this, or 2) This is not a priority on my/our current income, they were classified as lacking the item or activity due to a financial constraint. ↩
-
Respondents who had reached the State Pension Age who indicated that they lacked an item or activity for any of the reasons apart from 4) We/I do not want/need this, or 5) It is not relevant to me/us, were classified as lacking the item or activity due to a wider constraint. ↩
-
However, tenants may be in a house smaller than their entitlement due to other reasons such availability of properties. ↩
-
The 2023/24 FRS dataset will be up to four times larger than the FRS test question dataset. However, the sample will be split with approximately 75% of respondents answering the new material deprivation questions and 25% answering the old questions. Overall, the sample size for the new questions will be up to three times larger than in the test question dataset. ↩
-
It is our understanding that even though this assumption was used to justify prevalence weighting in the UK measures, it was never tested. ↩
-
For Scotland, the Child Poverty (Scotland) Act 2017 includes legal targets to reduce child poverty by 2030. These include targets for the combined low income and material deprivation measure. ↩
-
This followed the publication of experimental statistics in Working age combined absolute low income and material deprivation estimates FYE 2011 to FYE 2021. ↩
-
Table 8.3, column 3 shows the frequencies for the number of items lacked due to a financial constraint among working age adults who don’t meet the criteria for the combined measure either because they are not classified as materially deprived and/or because they don’t meet the low income criteria. ↩
-
These series are available in DWP’s Stat Xplore at https://stat-xplore.dwp.gov.uk/webapi/jsf/dataCatalogueExplorer.xhtml ↩