Appendix B: Agricultural analysis
Published 29 November 2022
Applies to England

© Crown copyright 2022
This publication is licensed under the terms of the Open Government Licence v3.0 except where otherwise stated. To view this licence, visit nationalarchives.gov.uk/doc/open-government-licence/version/3 or write to the Information Policy Team, The National Archives, Kew, London TW9 4DU, or email: psi@nationalarchives.gov.uk.
Where we have identified any third party copyright information you will need to obtain permission from the copyright holders concerned.
This publication is available at https://www.gov.uk/government/publications/investment-requirements-for-englands-river-basin-management-plans/appendix-b-agricultural-analysis
Appendix B to Investment requirements for England’s river basin management plans.
This appendix briefly describes the methods used to estimate the costs and partial environmental benefits of measures needed to reduce the current level of pollution from agricultural activities. It also presents a summary of the monetised costs and benefits.
This assessment should be seen as ‘illustrative’. It is a modelled assessment that looks at what might need to change from current farming practice. However, in the medium-term (the period of this assessment) agriculture is likely to change to respond to developments in technology and other global influences.
1. Data sources
The approach to estimating costs and benefits for changes in agricultural land management is based on the ADAS (FARMSCOPER) V4 model, and on work done for Defra project (WT1594). FARMSCOPER models the emissions from agricultural land to water and air of the following substances: nitrate, phosphorus, sediment, ammonia, methane, nitrous oxide, pesticides, faecal organisms and carbon dioxide from energy use. Starting from a baseline of normal farm operations, it then applies a set of mitigation methods (changes in farm management practice expected to reduce emissions) as specified by the user and estimates the impacts as reductions in each of the modelled pollutants. The pollutant reductions are multiplied by a monetary unit value for each pollutant to convert them to benefits values (FARMSCOPER V5), which are reported against the modelled net financial effect on farm businesses of adopting the mitigation methods (mostly costs but net of some financial benefits).
Only partial benefits values are calculated. The models currently estimate benefits for water quality (nitrate, phosphorus, and sediment reduction) and air quality (ammonia and greenhouse gas reduction); benefits due to faecal organisms and pesticide reduction, or an increase of soil organic carbon and other wider environmental benefits such as biodiversity, are not included.
WT1594 modelled several scenarios representing current agricultural land use, cropping, stocking and management practices, and potential future scenarios of different uptake rates of mitigation measures (farm management practices that help to reduce pollution of water and air). Three different illustrative bundles of pollution mitigation measures were applied across England at three different uptake rates (current, 50% and 85%). The bundles represented regulation and responsible practice (for example “Establish cover crops in the autumn”) as well as a set of high impact measures (for example “Site solid manure heaps away from watercourses”) and maximum impact measures (for example “Anaerobic digestion”). It should be noted that measures are only implemented where these are applicable.
The Land Use Change project was an Environment Agency, Natural England, and Forestry Commission project (2018 to 2020) to develop a strategic, integrated policy approach to landscape scale decisions. Its aim was to identify locations that maximise delivery of net environmental gain and multiple benefits to inform decisions on land use change.
Economic data from the Land Use Change project was used to estimate establishment (capital cost), maintenance (operational cost) and the cost of agricultural production loss, for individual land use change options (different habitat and woodland types).
Environmental benefits were estimated by applying benefit values from FARMSCOPER V5 to estimated pollution reductions of nitrate, phosphate and sediment arising from spatially prioritised land use change as estimated by the project. For air quality benefits (ammonia and greenhouse gas emissions) an average benefit value was determined assuming that all agricultural emissions not related to livestock are removed with land use change. Emissions from livestock have been excluded from this estimate as housed intensive livestock farming is not affected by land use change and stocking density of grazed livestock can be increased to compensate for the reduction of available land.
2. Method
The cost and benefits of agriculture measures to achieve the different sets of environmental objectives of the river basin management plans were estimated using the following method:
1. For each set of environmental objectives, the spatial extent (catchment area) of agricultural land which drains into the currently “failing” water bodies where agriculture is a known cause of failure was identified. This defines the spatial extent of land where the agricultural measures will apply.
2. A set of assumptions were constructed making use of the scenarios in WT1594, which applied a set of illustrative bundles of measures and uptake rates of FARMSCOPER and outputs from the land use change project. An incremental (year on year) in the uptake of measures was assumed in 2 phases. To 2027 a low-moderate increase was assumed, followed by an increased rate to achieve the draft Environment Act target and the environmental objectives of the river basin management plans in 2037, continuing at this level to the end of the assessment period.
The assumptions to 2027 were:
a. increasing compliance to 20 to 50% of farmers meeting existing regulations (regulatory measures)
b. increasing uptake by 20 to 50% of farmers of (measures funded by government grants) (scheme-funded) or voluntary initiatives See Water quality: what 3 future environmental land management schemes can achieve by 2027
c. Change of 1.4% of agricultural land to woodland or biodiversity habitat, targeting the most polluting land
The assumptions to 2037 and beyond were:
a. all farms (100%) should be compliant to existing regulation (uplifted from an WT1594 maximum uptake rate of 85%)
b. the maximum impact land management measures are implemented at the highest uptake rates (85%)
c. change of 20% of agricultural land to woodland or biodiversity habitat, these levels of land use change were considered necessary to at least achieve a pollution reduction of 40% in combination with other land management measures when targeting the most polluting land
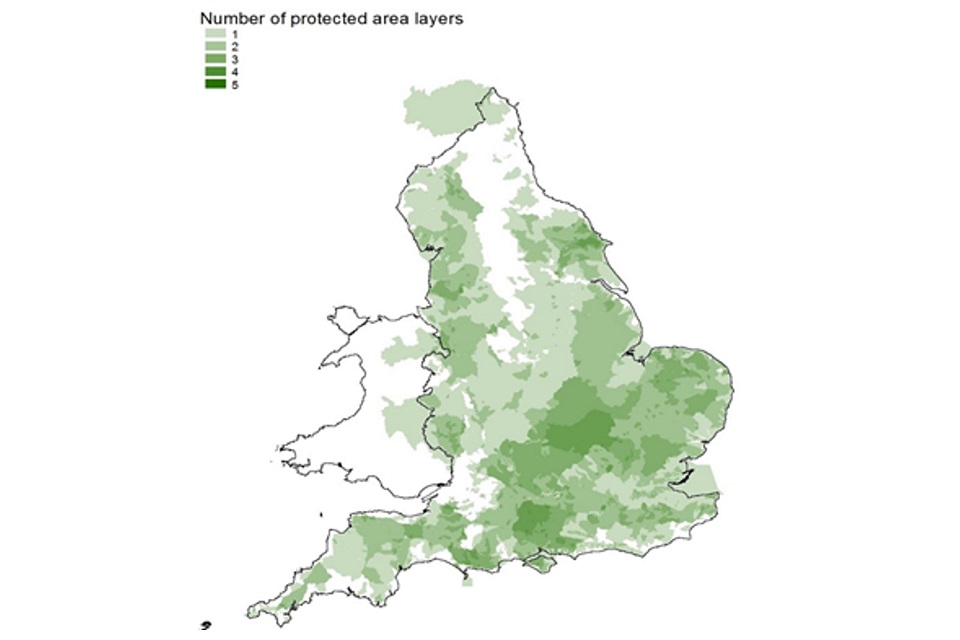
3. Many catchments contain more than one protected area. See figure B1. To avoid the risk of double counting, the interventions were applied to the catchments to achieve the environmental objectives in the following order:
a. preventing deterioration
b. protected areas:
- habitats sites
- drinking water protected areas
- bathing waters
- shellfish waters
- nutrient sensitive areas – nitrate vulnerable zones
c. improvements to good ecological status
For example, if an area of land drains to water bodies that currently fail habitats sites objectives, drinking water protected area objectives and good ecological status, all the costs and benefits of the interventions were allocated to achieving the habitats sites objectives only. This prevented the risk of double counting costs and benefits. While this gives the best estimate of the total costs and benefits, it does mean that if the interventions had been allocated to the objectives in a different order, the costs and benefits of achieving the individual sets of objectives would have been different.
For the preventing deterioration objective, the costs of measures in catchments in and upstream of water bodies that had already deteriorated (2016 to 2019) were estimated. It does not consider the future risk of deterioration. However, if the measures to achieve the other objectives are implemented, the risk of deterioration is significantly reduced.
Figure B1 Catchments containing multiple protected areas
3. Results
Table B1 shows the estimated costs and benefits of the agriculture measures to achieve the different environmental objectives in the river basin management plans.
The water quality benefits (nitrate, phosphorus, and sediment) are presented here for completeness. These values are not included in the benefits estimates in the main report to avoid the risk of double counting. The benefits in the main report are derived from the outcomes of the integrated catchment appraisals which looked at measures for all sectors, not just agriculture.
Table B1: Costs and benefits estimated by the agriculture measures modelling work (£ million)
| Objectives | Costs | Water quality benefits | Air quality benefits | Greenhouse gas emissions benefits |
|---|---|---|---|---|
| Preventing deterioration | 5,710 | 1,990 | 720 | 3,770 |
| Habitat sites | 6,680 | 2,290 | 1,120 | 4,930 |
| Shellfish water | 2,300 | 880 | 460 | 1,860 |
| Bathing water | 220 | 70 | 40 | 180 |
| Drinking water | 5,930 | 1,830 | 1,190 | 4,800 |
| Nutrient sensitive areas (nitrates vulnerable zones) |
6,870 | 2,130 | 1,370 | 5,560 |
| Ecological status, ecological potential, and groundwater chemical status |
1,930 | 770 | 760 | 2,300 |
| Total present value | 29,640 | 9,960 | 5,670 | 23,400 |