Imperial College London: Omicron vs Delta replication, 19 December 2021
Published 23 December 2021

© Crown copyright 2021
This publication is licensed under the terms of the Open Government Licence v3.0 except where otherwise stated. To view this licence, visit nationalarchives.gov.uk/doc/open-government-licence/version/3 or write to the Information Policy Team, The National Archives, Kew, London TW9 4DU, or email: psi@nationalarchives.gov.uk.
Where we have identified any third party copyright information you will need to obtain permission from the copyright holders concerned.
This publication is available at https://www.gov.uk/government/publications/imperial-college-london-omicron-vs-delta-replication-19-december-2021/imperial-college-london-omicron-vs-delta-replication-19-december-2021
1. The SARS-CoV-2 variant, Omicron, shows enhanced replication in human primary nasal epithelial cells.
Authors: Jonathan Brown, Jie Zhou, Thomas P. Peacock and Wendy S Barclay
- Department of Infectious Disease, Imperial College London, UK, W2 1PG
Corresponding author: Wendy Barclay
2. Introduction
The second year of the SARS-CoV-2 pandemic was marked by the repeated emergence of SARS-CoV-2 ‘variants’ with altered properties such as enhanced transmissibility or altered antigenicity. The fifth of these ‘variants of concern’, Omicron (Pango lineage BA.1), was first detected in Southern Africa and, within a just a month of its initial detection, has rapidly spread across the world and now comprises the majority of SARS-CoV-2 cases in many places including the UK. Omicron is marked by an unprecedented number of mutations in the Spike protein that result in a large antigenic distance between Omicron and the Wuhan-like Spike used in current vaccines with a consequent fall in vaccine effectiveness against Omicron and a higher frequency of reinfections. However, it is unclear if vaccine breakthrough and reinfections alone fully account for Omicron’s rapid growth and displacement of the Delta variant, or whether an inherent increase in viral fitness in the human airway also contributes to its enhanced transmissibility. Here we demonstrate an increase in replication of an isolate of Omicron compared to Delta in cultures of primary human airway epithelia derived from nasal cells.
3. Results
Omicron produces smaller plaques than Delta on cells overexpressing ACE2 and TMPRSS2
An Omicron and Delta isolate were propagated in Vero cells overexpressing human ACE2 and TMPRSS2 protease and then titrated by plaque assay on these cells. Both Delta and Omicron variants formed plaques, but the plaques for Omicron were smaller and less distinct (Figure 1).

Figure 1: Plaque phenotype of Delta and Omicron variants of SARS-CoV-2. Virus isolates were propagated on Vero-ACE2-TMPRSS2 (VAT) cells and plaqued on VAT cells for 3 days before staining with crystal violet to visualise. Omicron produces smaller plaques than Delta.
Omicron demonstrates a replicative advantage over Delta in primary human airway epithelial cells
The virus stocks of the Omicron and Delta variants contained similar viral RNA to infectivity ratios as measured by E gene RT-qPCR and plaque assay. To compare replication of the two variants, primary human airway epithelial cultures derived from nasal cells were inoculated at a multiplicity of 0.1 plaque forming unit (pfu) per cell of each variant. Vero E6-ACE2/TMPRSS2 (VAT) cells, or human lung Calu3 cells were inoculated at 0.001 pfu per cell. Virus released at the apical surface of the airway cultures or into the supernatants overlaying the monocultures was collected daily for 3 days post inoculation and viral loads determined by RT-qPCR for E gene and by plaque assay for infectious virus on VAT cells (Figure 2). In human nasal airway epithelial cells (HAE) Omicron showed a large early replication advantage, yielding viral load titres ~100-fold higher than for Delta by 24 hours post infection. By 48 and 72 hours post infection, infectious titres of Omicron were lower compared to Delta and at 72 hours the RNA collected from Omicron infected wells was also lower in E gene copies. This coincided with observations by light microscopy at 72 hours that all cilia had stopped beating in the Omicron infected wells, suggesting cell death, whereas cilia were still observed to be beating in the Delta virus infected wells. In VAT cells, replication of the two variants was equal despite the observation that Omicron formed smaller plaques in these cells. In Calu3 cells, which are a monoculture of immortalized human lung cells, the viral yields of Omicron were lower than for Delta.
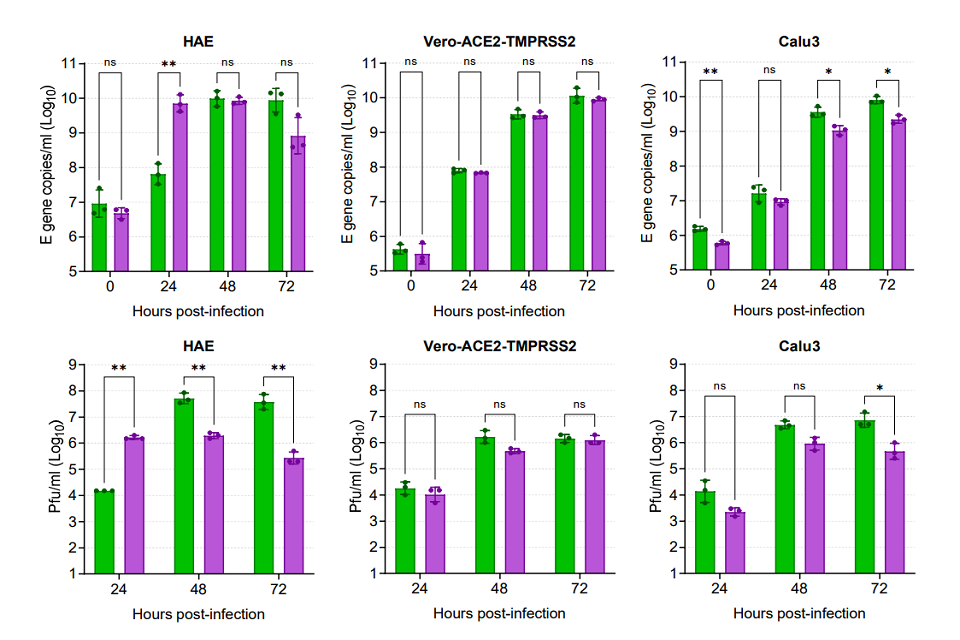
Figure 2: Comparative replication kinetics of SARS-CoV-2 Omicron and Delta variants in vitro. Human nasal airway epithelial (HAE) cells were inoculated with Delta or Omicron variants at 0.1 pfu per cell, and Vero-ACE2-TMPRSS2 (VAT) and Calu3 cells were inoculated at 0.001 pfu per cell. Infections were performed in triplicate wells and back titration confirmed equal inputs of the variants by E gene copies measured by RT-qPCR and infectious units measured by plaque assay. Omicron showed no replicative advantage in VAT cells and was defective in Calu3 cells, but demonstrated a ~100-fold higher titre than Delta at 24 hours post-infection of HAE cells. Bars show individual replicate titres with the standard deviation.
Statistical differences measured by ANOVA on log transformed data:
- for Calu3 E gene copies per ml for 48 hours and 72 hours and for Pfu per ml for 72 hours the P is less than 0.05.
- for HAE E gene copies per ml for 24 hours, for Calu3 E gene copies per ml for 0 hours and for Pfu per ml for 24 hours, 48 hours and 72 hours the P is less than 0.01.
- and for P is less than 0.001 and for P is less than 0.0001
Omicron rapidly outcompetes Delta in mixed infections of primary human airway epithelial Cells
Next we performed a direct head-to-head competition assay inoculating an equal mix of each variant onto the same wells of HAE, VAT, or Calu3 cells. Once again virus released from apical surface or the primary cultures or into the supernatant overlaying the immortalize cells was collected daily and assessed for total virus replication by E gene RT-qPCR (dotted black lines in figure 3) and also for the RNA yield for each variant using a novel PCR protocol. Variant specific RT-qPCR was carried out using a primer-probe set specific for the insertion in the Omicron S gene at position 214 and a primer-probe set for the same region in the Delta S gene which lacks this insertion, allowing for the proportion of each variant in the same sample to be determined. We first validated the specific RT-qPCR by creating a series of artificial mixes of RNA from each variant (left hand graph, Figure 3). During mixed infection of primary HAE cells, Omicron rapidly outcompeted Delta so that it was the only virus yielding detectible RNA products to apical wash by 24 hours post infection. Single infections may have suggested that Delta has a replication advantage over Omicron at later timepoints (Figure 2). However, this mixed infection demonstrated that Omicron remained dominant throughout the time course (Figure 3). This supports the idea that it was Omicron-mediated cell damage which resulted in lower viral titres of Omicron than Delta at later timepoints in single infections (Figure 2). In contrast to HAE cells, both viruses in mixed infections remained in similar quantities in the VAT cells, and in Calu3 cells Delta was marginally fitter than Omicron (Figure 3).
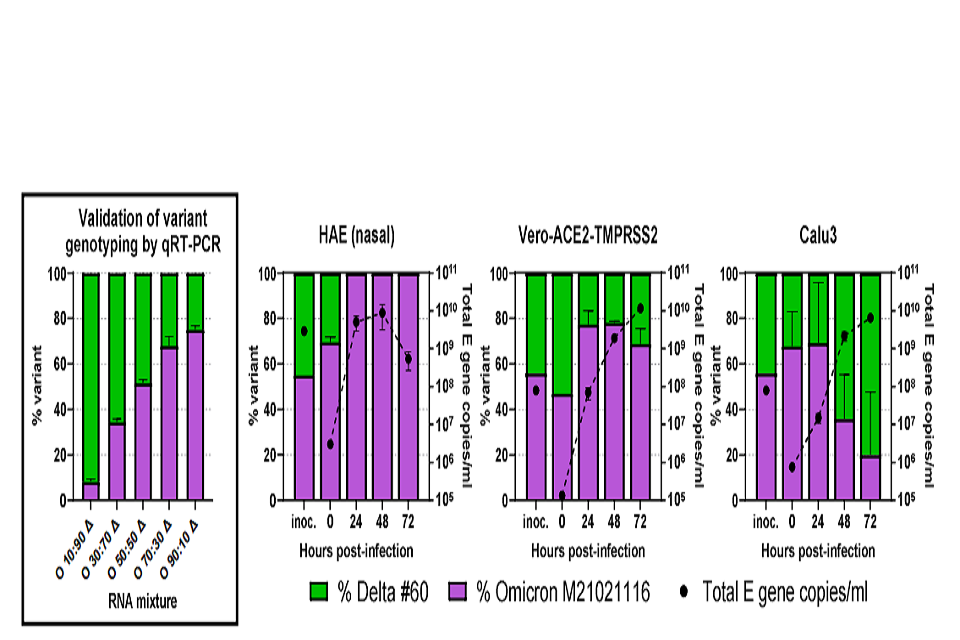
Figure 3: Competition assay between SARS-CoV-2 Omicron and Delta variants in vitro. A probebased RT-qPCR assay was developed to measure the proportion of variants present in mixed samples. First panel – Omicron (O) and Delta (Δ) RNA were mixed at different ratios shown on the x-axis and measured for the signal produced using an Omicron-specific or a Delta-specific probe by RT-qPCR. The proportion of variant-specific signal is shown with the SD of 3 replicates. Equal mixtures of Omicron and Delta variant were then inoculated onto human airway epithelial (HAE) cells at a final multiplicity of 0.1 pfu per cell and onto VAT and Calu3 cells at 0.001 pfu per cell. Daily harvests were measured for total viral load by E gene qRT-PCR (black dots) and by the variant specific RT-qPCR to give variant proportions. SD of 3 replicates shown.
4. Discussion
Taken together the replication assays here show that the SARS-CoV-2 Omicron variant has increased replicative fitness in primary cells derived from human upper respiratory tract compared to the previously dominant Delta variant. This suggests that at least part of the rapid growth of Omicron observed in UK in the face of a preceding Delta wave is due to high transmissibility of the virus between people resulting from efficient nasal replication. This, acting in combination with evasion of control by pre-existing neutralizing antibodies suggests that Omicron is likely to spread rapidly regardless of prior vaccine or infection status, and will require a combination of NPI measures for effective control in the community.
5. Materials and methods
5.1 Biosafety and ethics statement
All laboratory work was approved by the local genetic manipulation safety committee of Imperial College London, St. Mary’s Campus (centre number GM77), and the Health and Safety Executive of the United Kingdom, under reference CBA1.77.20.1.
5.2 Cell lines
African green monkey kidney cells overexpressing human ACE2 and TMPRSS2 (Vero E6-ACE2-TMPRSS2; Glasgow University)[footnote 1], were maintained in complete media supplemented with 200 µg per ml hygromycin B (Gibco) and 2 mg per ml G418 (Gibco) to maintain human ACE2 and TMPRSS2 expression. Calu3 airway epithelial cells were maintained in complete medium with 20% foetal calf serum. Nasal origin air–liquid interface primary human airway epithelial (HAEs) cells were purchased from Epithelix and maintained in Mucilair cell culture medium (Epithelix). All Cells were kept at 5% CO2, 37 degrees C.
5.3 Primary virus isolates
A virus isolate matching Omicron sequence was kindly donated by Gavin Screaton at Oxford University and propagated on Vero-ACE2-TMPRSS2 (VAT) cells for 3 days until cytopathic effect was observed[footnote 1] . A Delta swab sample was kindly provided by Thushan de Silva at University of Sheffield and virus isolated and propagated on VAT cells. Virus isolates used are as follows:
| Virus name | Variant | PANGO lineage | GISAID Accession | Spike mutations |
|---|---|---|---|---|
| hCoV- 19/England/SHEF- 10E8F3B/2021 | Delta | B.1.617.2 | EPI_ISL_17 31019 | T19R, K77R, G142D, Δ156-157/R158G, A222V, L452R, T478K, D614G, P681R, D950N |
| M21021166 | Omicron | B.1.1.529 /BA.1 | N/A | A67V, Δ69-70, T95I, G142D/Δ143-145, Δ211/L212I, ins214EPE, G339D, S371L, S373P, S375F, K417N, N440K, G446S, S477N, T478K, E484A, Q493R, G496S, Q498R, N501Y, Y505H, T547K, D614G, H655Y, N679K, P681H, N764K, A701V, D796Y, N856K, Q954H, N969K, L981F |
Table 1 – Virus isolates derived from clinical samplesVirus growth kinetics and competition assays were performed as described previously[footnote 2] . Briefly, in air-liquid interface HAEs, before infection cells were washed with serum-free media to remove mucus and debris. Cells were infected with 200 µL of virus-containing serum-free DMEM and incubated at 37 degrees centigrade for 1 hour. Inoculum was then removed and cells were washed twice. Time points were taken by adding 200 µL of serum-free DMEM and incubating for 10 minutes and 37 degrees centigrade before removal and titration.
5.4 Plaque assay
Serial dilutions of virus supernatant in serum-free DMEM, 1% NEAA and 1% P/S were performed and inoculated onto VAT cells for 1 h at 37 °C. Inoculum was then removed and replaced with SARS-CoV-2 overlay medium (1× MEM, 0.2% w/v BSA, 0.16% w/v NaHCO3, 10 mM HEPES, 2mM L-Glutamine, 1× P/S, 1% w/v Avicel). Plates were incubated for 3 days at 37 °C before overlay was removed and cells were stained for 1 hour at room temperature in crystal violet solution.
5.5 Viral RNA extraction and RT-qPCR for E gene and Delta or Omicron mixture genotyping
Virus genomes were quantified by E gene RT-qPCR as previously described[footnote 4] . Viral RNA was extracted from cell culture supernatants using the QIAsymphony DSP Virus or Pathogen Mini Kit on the QIAsymphony instrument (Qiagen). RT-qPCR was then performed using the AgPath RT-PCR (Life Technologies) kit on a QuantStudio™ 7 Flex Real-Time PCR System with the primers specific for SARS-CoV-2 E gene [footnote 5] . For absolutely quantification of E gene RNA copies, a standard curve was generated using dilutions viral RNA of known copy number. E gene copies per ml of original virus supernatant were then calculated using this standard curve.
To measure the proportions of Omicron and Delta RNA from mixed samples a modified RT-qPCR protocol was developed using probes specific for the S gene of Omicron or Delta variants. A FAM probe specific to a 9 base pair insertion in the Omicron S gene at amino acid position 214, and a VIC probe specific to the same region of the Delta S gene sequence lacking this insertion were used. Reactions were run on AgPath RT-PCR (Life Technologies) kit on a QuantStudio™ 7 Flex Real-Time PCR System and the relative amounts of FAM and VIC signal used to determine the proportion of Omicron and Delta in the original samples. Validation of the assay was carried out by extracting RNA from pure Omicron and Delta supernatants, normalising by E gene copies and mixing at different ratios before measuring using the assay.
| Primer or Probe Sequence | Sequence |
| Forward PCR primer upstream of Omicron insertion | TGGACCTTGAAGGAAAACAGGG |
| Reverse PCR primer downstream of Omicron insertion | TGGTTCTAAAGCCGAAAAACCC |
| FAM probe specific to Omicron Spike insertion sequence | TTATAGTGCGTGAGCCAGAAGA |
| VIC probe specific to Delta Spike sequence at site of Omicron insertion | CTATTAATTTAGTGCGTGATCT |
6. Acknowledgements and funding
The authors would like to thank Dr Matthew Turnbull and Dr Suzannah Rihn of the MRC University of Glasgow Centre for Virus Research (CVR) for sharing their Vero E6-ACE2-TMPRSS2 cells and Gavin Screaton, Wanwisa Dejnirattisai and Alison Cowper from Oxford University for sharing the Omicron isolate.
This work was supported by the G2P-UK National Virology Consortium funded by UKRI.
7. References
-
Rihn, S. J. et al. A plasmid DNA-launched SARS-CoV-2 reverse genetics system and coronavirus toolkit for COVID-19 research. PLoS Biol 19, e3001091, doi:10.1371/journal.pbio.3001091 (2021). ↩ ↩2
-
Peacock, T. P. et al. The furin cleavage site in the SARS-CoV-2 spike protein is required for transmission in ferrets. Nat Microbiol, doi:10.1038/s41564-021-00908-w (2021). ↩
-
Zhou, J. et al. Investigating SARS-CoV-2 surface and air contamination in an acute healthcare setting during the peak of the COVID-19 pandemic in London. Clin Infect Dis, doi:10.1093/cid/ciaa905 (2020). ↩
-
Corman, V. M. et al. Detection of 2019 novel coronavirus (2019-nCoV) by real-time RT-PCR. Eurosurveillance 25, 2000045, doi:doi:https://doi.org/10.2807/1560-7917.ES.2020.25.3.2000045 (2020). ↩