The floods investment programme: investment in deprived areas
Published 25 March 2024

© Crown copyright 2024
This publication is licensed under the terms of the Open Government Licence v3.0 except where otherwise stated. To view this licence, visit nationalarchives.gov.uk/doc/open-government-licence/version/3 or write to the Information Policy Team, The National Archives, Kew, London TW9 4DU, or email: psi@nationalarchives.gov.uk.
Where we have identified any third party copyright information you will need to obtain permission from the copyright holders concerned.
This publication is available at https://www.gov.uk/government/publications/funding-for-flood-and-coastal-erosion-projects-local-authorities-and-deprived-communities/the-floods-investment-programme-investment-in-deprived-areas
Summary of the report
The government is investing a record £5.2 billion between 2021 and 2027 in flood and coastal erosion projects, to better protect communities across England.
This investment is distributed as ‘Grant in Aid’ to flood schemes, in line with the government’s partnership funding policy. When this policy was developed, consideration was given to the ability of deprived areas to secure the required funding contributions and their ability to recover from the impacts of flooding. Evidence gathered in 2014 also showed that deprived areas were disproportionately at risk from flooding. Since 2011, under the partnership funding policy, flood schemes that better protect deprived communities attract more Grant in Aid. Households in the 20% most deprived areas get 2.25 times the standard payment rate applied to the least deprived areas.
In 2020, the National Audit Office (NAO) recommended that Defra and the Environment Agency (EA):
- understand what is driving the profile of investment in deprived areas and whether any structural issues exist behind an identified decline since 2014
- report on the geographical distribution of investment, including the amount of investment directed to deprived areas
On the first part of the NAO’s recommendation, our analysis shows that of all households better protected from flooding and coastal erosion, the proportion that were in the 20% most deprived areas in England rose from 9.2% in 2011 to 2012 to a peak of 43.4% in 2015 to 2016. The level then plateaued to around 30% for the next 4 years before falling to 25% in 2020 to 2021 (view Figure 1). The first 2 years of the current 6-year investment programme (2021 to 2023) have shown an average of 21% of households better protected being from the 20% most deprived areas. Given that the percentage is consistently above 20%, we conclude that government investment has better protected the most deprived areas to a greater extent than less deprived areas.
Our analysis also indicates that the most deprived areas are now at a lower risk of flooding from all sources except surface water flooding. For surface water flooding, the level of risk is relatively equal between deprived and less-deprived areas.
We therefore conclude that the most deprived areas get a proportionately higher level of investment than less deprived areas, and relative to their risk of flooding. Our evidence shows that investment in deprived areas has increased since the policy to award higher payment rates to these areas was introduced in 2011. We conclude that no structural issues exist for floods investment levels into the more deprived areas.
Since the start of the current capital programme in 2021, the EA’s Flood and coastal erosion risk management annual reports include investment by both geography and deprivation area. This addresses the second part of the NAO’s recommendation.
In 2021, the Public Accounts Committee (PAC) recommended that Defra and the EA undertake and publish annual analysis of investment levels across regions and deprived areas. They also recommended that appropriate action is taken to reduce any funding inequality. The PAC’s latest report on Resilience to flooding in 2024 recommended that Defra shows how it plans to get a better understanding of its investment decisions on geographical distribution.
In terms of investment across geographical areas, the government invests in flood defences across all regions of the country. Funding is allocated where the risk is highest and the benefits of flood resilience are the greatest. As set out above, from 2021 the EA has reported on investment levels and the numbers of properties better protected by geographical region. The EA will undertake analysis on the longer-term geographical distribution of investment to understand the impacts of investment decisions by geography.
Introduction
The government is investing a record £5.2 billion between 2021 and 2027 in flood and coastal erosion schemes to better protect communities across England. This doubled the investment from £2.6 billion invested in the previous 6 year period (from 2015 to 2021).
This investment is distributed as ‘Grant in Aid’ (GiA) across the country, in accordance with government’s partnership funding policy, where the risk is highest and the benefits are greatest. Where GiA does not cover the full costs of the project, contributions are needed from partners, the local community or other organisations. This provides a fair and consistent approach for allocating GiA and securing wider benefits, where others stand to gain from a defence scheme.
In developing the partnership funding policy, the government considered the ability of deprived areas to secure the required funding contributions and their ability to recover from the impacts of flooding. Evidence gathered in 2014 also showed that deprived areas were disproportionately at risk from flooding. Projects that better protect deprived areas from flood risk therefore attract more GiA, with properties in deprived communities receiving higher payment rates.
The payment rates are:
| Deprivation decile | The payment rate for deprivation decile |
|---|---|
| Households in the most deprived deciles in England (20% most deprived) | Get 2.25 times the standard payment rate |
| Households in the next most deprived deciles (21-40% most deprived) | Get 1.5 times the standard payment rate |
| Households in the 60% least deprived deciles | Receive the standard payment rate with no uplift |
The NAO reported on ‘Managing flood risk’ in November 2020 and recommended that:
- Defra work with the Environment Agency (EA) to understand what is driving the distribution of investment in deprived areas and whether there are any underlying structural issues behind an identified decline in investment since 2014
- the EA report on the geographical distribution of investment, including the impact of changes to the partnership funding model and the amount of investment directed to deprived areas, to provide evidence to help inform policy decisions and government priorities
These recommendations came from a review of EA’s research, which showed that the proportion of all homes better protected that were also in the 20% most deprived areas in England declined from 29% in 2014 to 8% in 2019.
Since then, it has been found that the data underpinning these figures only included homes from deprived areas moving from significant or very significant risk to moderate or low risk bands (but measured as a percentage of all households moving to any lower risk band). This means the findings significantly underestimated the impact of investment in deprived communities. Another chart was subsequently added to EA’s research which provided a more robust comparison, this is reproduced in figure 1. Figure 1 shows that the actual proportion of homes better protected in the 20% most deprived communities in England rose to 43.4% in 2015 to 2016 and then plateaued to around 30% to 2019 to 2020. This is explained more in the section below on ‘Data used to inform the NAO’s recommendation’.
The NAO’s latest report on ‘Resilience to flooding’ (November 2023) recognised a positive position in the first 2 years of the current 2021 to 2027 floods capital programme – with an average 21% of properties better protected being in the 20% most deprived areas. The EA’s most recent Flood and coastal erosion risk management annual report shows that between April 2022 and March 2023, 23% of properties better protected were in the 20% most deprived areas in England.
Separately, the PAC reported on ‘Managing flood risks’ in February 2021. The PAC similarly recommended that Defra and the EA undertake and publish annual analysis of investment levels across regions and deprived areas. They also recommended that appropriate action is taken to reduce any identified funding inequality. PAC’s latest report on ‘Resilience to flooding’ was published in January 2024. The report recommended that Defra shows how it intends to get a better understanding of its investment decisions based on geographical distribution. The EA publish annual investment figures and the number of properties better protected by geographical region. The EA will also undertake analysis on the longer-term geographical distribution of investment, to understand the impacts of investment decisions by geography.
This report has been prepared to respond to the NAO’s original recommendations on assessing floods investment levels in deprived areas and reporting on the geographical distribution of investment. It summarises:
- how investment levels are now reported publicly across regions and deprived areas
- the findings of analysis that has been taken to track investment levels in deprived areas since 2011
Publishing investment levels in deprived areas
Since 2011, the EA has provided annual reports on flood and coastal erosion risk management work carried out by Risk Management Authorities (which includes the EA, local authorities and internal drainage boards). Since the start of the current capital programme, EA’s annual reports have been extended to include investment levels by both geography and deprivation area. The metrics reported against include:
- overall investment and number of properties better protected
- investment and number of properties better protected by EA’s 15 geographical areas
- number of properties better protected in the most deprived areas (the 20% most deprived) and the next most deprived areas (21-40% most deprived)
The most recent report, published in September 2023, showed that between April 2022 and March 2023, the floods capital programme better protected 6,150 properties (23% of the total) in the highest deprived areas, and 6,100 properties (also 23% of the total) in the next highest deprived areas.
The annual flood and coastal risk management reports will continue to show investment levels by geography and deprivation areas.
Analysis of investment levels in deprived areas
Trend of investment from 2011 to 2021
Analysis has been carried out on investment in deprived communities. This has been measured by the number of households in the most deprived deciles moving from very significant or significant flood risk bands to moderate or low flood risk bands (out of all households moving between these risk bands). The data is for each year from 2011 to the end of the previous floods capital programme in March 2021. Definitions of the risk bands are summarised in Annex A. Figure 1 sets out the percentage of these households that were in the 20% most deprived areas.
Figure 1 illustrates that there was an increase in the proportion of households better protected in the most deprived areas, from 9.2% in 2011 to 2012, to a peak of 43.4% in 2015 to 2016. The level then plateaued at around 30% for the next 4 years before falling to 25.4% in 2020 to 2021.
If funding was distributed evenly across all communities in England, we would expect to see 20% of households in the most deprived areas moving to lower risk bands in Figure 1. The red horizontal line on the graph shows this. However, since 2013 to 2014 we consistently see figures above 20%. This indicates that the investment programme has better protected the most deprived areas to a greater extent than less-deprived areas.
The partnership funding policy was introduced in 2011 and marked the introduction of the policy giving increased payments to deprived areas. Given the time it takes for projects to mature from development to completion and to better protect properties, it is likely that the increase experienced after 2011 to 2012 was caused by the introduction of the partnership funding policy and the higher payment rates for schemes in deprived areas.
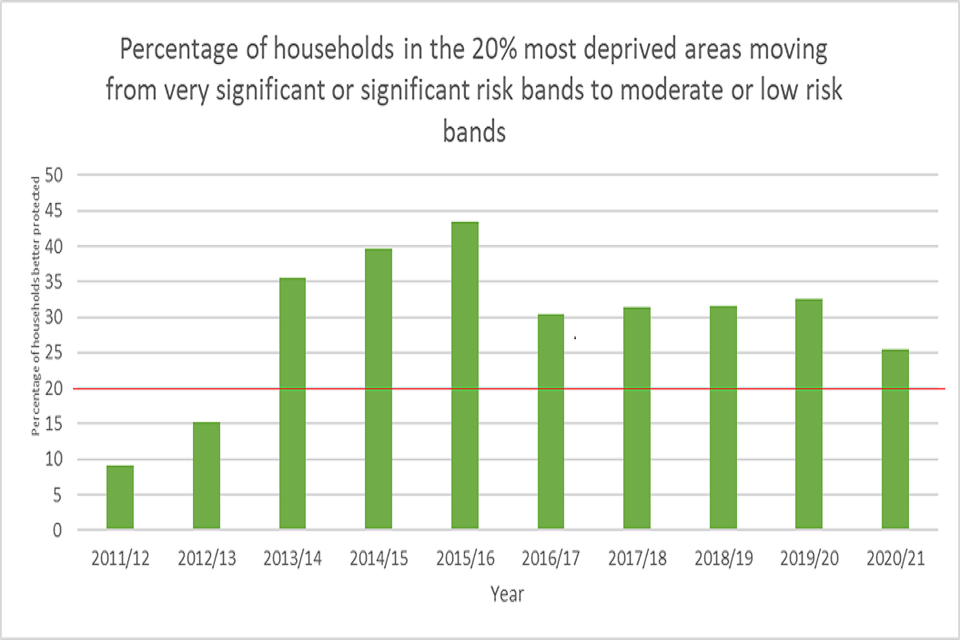
Figure 1: Percentage of households in the 20% most deprived areas that moved from very significant or significant risk bands to moderate or low flood risk bands. This is a remake of figure 3c in EA’s Social deprivation and the likelihood of flooding report.
Trend of investment from 2021
Since the beginning of the current floods investment programme in 2021, we now record the number of all properties (both households and non-residential) that are better protected from flood and coastal erosion risk, capturing additional benefits of the programme. 19% of all properties better protected were in deprived areas in 2021 to 2022 and 23% were in deprived areas in 2022 to 2023.
The risk of deprived areas to flooding
To understand whether there is any potential funding inequality towards deprived areas, we have also looked at their level of risk to flooding. This is because there could still be inequality, for example, if the level of investment in deprived areas was 10% higher than less-deprived areas, but their flood risk was 20% higher.
To do this, we have considered the level of risk of each deprivation ‘decile’. Deciles are calculated as part of the Index of Multiple Deprivation (IMD), by ranking all neighbourhoods in England and dividing them into 10 equal groups. These range from the most deprived 10% of neighbourhoods nationally, to the least deprived 10% of neighbourhoods nationally. A full explanation of deprivation deciles is provided in The English Indices of Deprivation 2019.
Figure 2 below shows the percentage of the population that is currently at significant (high or medium) risk of flooding from rivers and the sea by deprivation decile. It shows that the most deprived areas (deciles 1 and 2) are currently at a lower risk of flooding than any other decile.
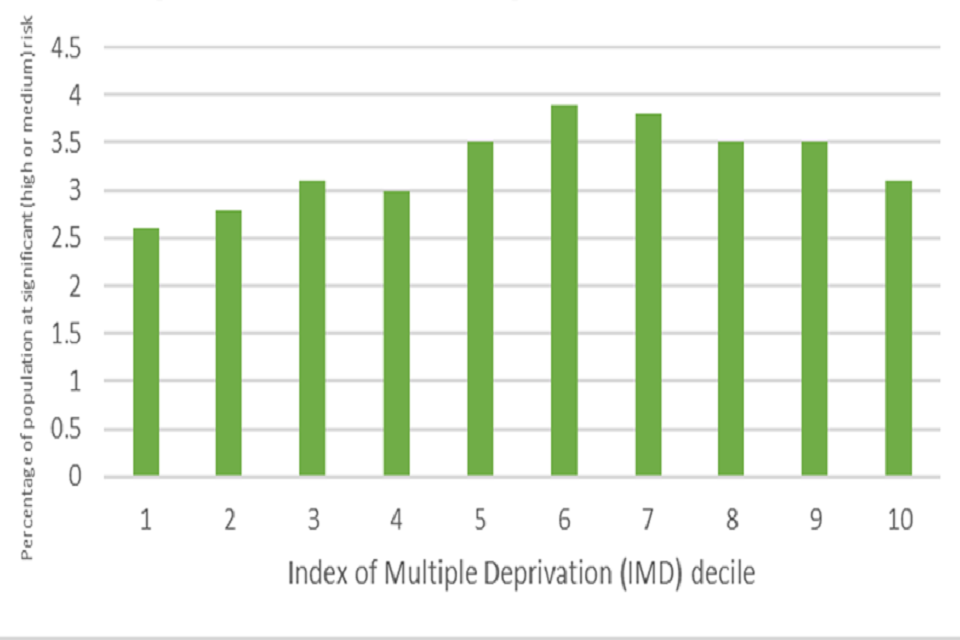
Figure 2: Percentage of the population by deprivation decile at significant risk or above of flooding from the rivers and the sea. The graph shows the percentage of the population at very significant or significant flood risk as a percentage of the population for that given decile. Sources: The Risk of Flooding from Rivers and Sea (EA) March 2022 release and the English indices of multiple deprivation 2019 geopackage published by the Ministry of Housing, Communities & Local Government (MHCLG) and downloaded in January 2022.
Figure 3 below shows the percentage of the population at significant (high or medium), risk of surface water flooding by IMD decile. While deciles 2, 3 and 4 are slightly above the equal spread (all at 11%), no decile has a percentage significantly greater or lower than 10%, meaning that the risk of surface water flooding is spread relatively evenly across all levels of deprivation.
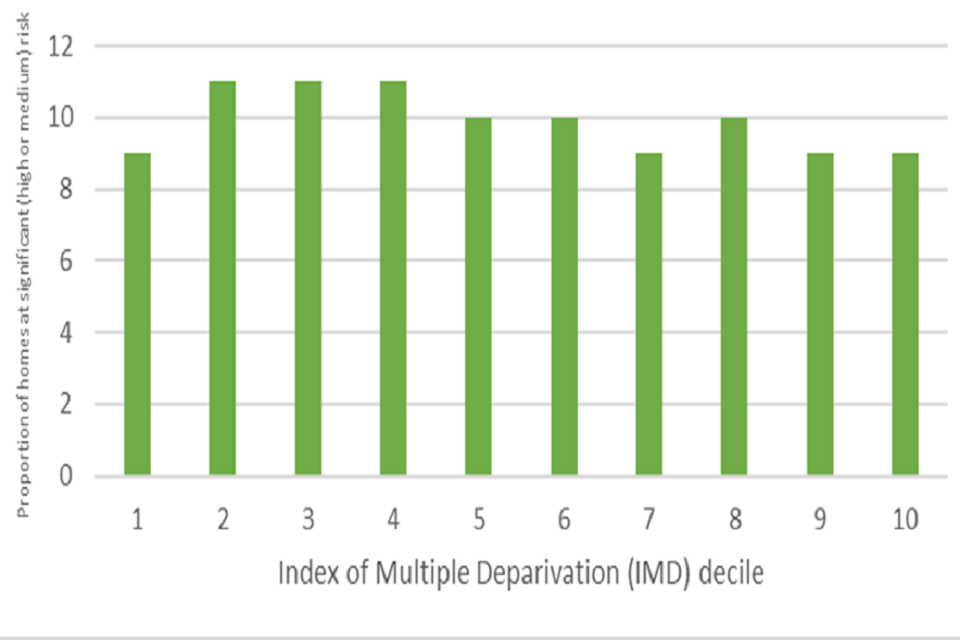
Figure 3: Percentage of the homes, by IMD decile, at significant (high or medium) risk or above of surface water flooding. Sources: the Defra risk of flooding from surface water data and the English indices of multiple deprivation 2019 geopackage published by the MHCLG and downloaded in January 2022.
Conclusion of analysis of investment levels in deprived areas
The analysis has shown that, aside from 2021 to 2022 (where we saw 19% of properties better protected in the 20% most deprived areas), in each year since 2013, the floods capital programme has better protected properties from the most deprived areas to a greater extent than the programme overall.
The most deprived areas are now at a lower risk of flooding from all sources except surface water. For surface water, they have a similar level of risk as less deprived areas, compared to any other deprivation decile.
Flooding has a disproportionate effect on people and local economies in deprived areas, which is why they continue to receive higher payment rates. This shows that our policy to allocate more funding to deprived areas is driving the profile of investment, recognising that these areas still struggle to secure partnership funding contributions and can take longer to recover from flooding. We have not found any structural issues behind investment into deprived areas, and our analysis shows that these areas have consistently benefitted to a greater extent than less-deprived areas.
Data used to inform the NAO’s recommendation
The NAO’s recommendation was developed from EA’s research which showed that the proportion of all homes better protected that were in the 20% most deprived areas in England declined from 29% in 2014 to 8% in 2019.
It has since been shown that the data for these figures only includes homes from deprived areas moving from very significant or significant to moderate or low risk bands (but measured as a percentage of all households moving to any lower risk band). This means the findings significantly underestimated the impact of investment in deprived communities.
An additional chart was later added to EA’s research which provided a more robust comparison. This shows properties in deprived communities moving from very significant or significant risk to moderate or low risk, as a percentage of all properties moving from these same risk bands. This provides a fairer comparison and can be used more reliably as an indicator of the impact of investment on deprived communities. These findings are reproduced as figure 1 in this report.
Investment levels by geography
The PAC recommended in January 2024 that Defra outlines how it will get a better understanding of its investment decisions based on geographical distribution.
The government invests in flood defences to reduce flood risk across all regions of the country. Every English region is forecast to receive more investment in flood and coastal erosion defences in this programme compared to the previous 6-year programme.
Investment is allocated where the flood risk is highest and the benefits of flood resilience are the greatest. A consistent methodology is used, applying a national funding formula under the partnership funding policy, to allocate funding to schemes proposed by all risk management authorities. This ensures a fair distribution of funding based on agreed priorities, principles and needs. The availability of feasible projects also influences the distribution of investment. There are therefore no specific regional investment targets.
Considering a few years of investment data, such as 3 or 6 years, only provides a snapshot of regional investment. As flood schemes take a number of years to design, plan and build, a longer-term perspective is needed. It is difficult to judge regional variation over a short time period. From 2021 the EA has reported on investment levels and the numbers of properties better protected by geographical region. The EA will undertake analysis on the longer-term geographical distribution of investment to understand the impact of investment decisions by geography.
Next Steps
The EA will continue to publish, and the department will continue to monitor, investment levels in deprived areas and across geographical areas. The EA will undertake analysis on the longer-term geographical distribution of investment to understand the impact of investment decisions by geography.
Annex A
Table to show risk bands as used in this report.
| Significant | High | Each year there is a chance of flooding greater than 1 in 30 | More than 3.3% |
|---|---|---|---|
| Medium | Each year there is a chance of flooding of between 1 in 30 and 1 in 100 | Between 3.3% and 1% | |
| Not significant | Low | Each year there is a chance of flooding of between 1 in 100 and 1 in 1000 | Between 1% and 0.1% |
| Very Low | Each year there is a chance of flooding of less than 1 in 1000 | Less than 0.1 |
Annex B
Data and methodology used
The annex has been created to show the datasets used in the report and describe how they have been applied.
The GIS datasets used are the English indices of multiple deprivation 2019 published by the Ministry of Housing, Communities and Local Government (downloaded in January 2022) and the EA’s maps of Risk of Flooding from Rivers and Sea and surface water Risk of Flooding from Surface Water. These maps were combined using ArcGIS software to calculate the number of people living in areas at risk by deprivation deciles.
For example, the area in blue in Figure 4 shows the area at significant risk of flooding in the EA map. The area in yellow represents IMD deciles 1 and 2 (from the DHLUC maps). The area in green shows where both overlap in the combined map. We counted the population in this green area of the combined map to obtain the number of people both at significant risk and in deprivation deciles 1 and 2.

Figure 4: Methodology used to calculate the number of people in deprived areas at significant risk of flooding.
Geographic data and digital map manipulation (to count the population living in areas at risk of flooding by deprivation deciles) was done by the EA Mapping and Modelling Team (in the case of risk from rivers and the sea) and by Defra’s Geography Team and Flood and Water Analysis and Evidence Team in the case of risk from surface water.
In this analysis we assumed that the number of people per household in areas at risk of flooding from rivers and the sea, is the average in England and that population density did not significantly change from 2019 to 2022.