Evaluating CDC’s Financial Institutions Portfolio
Published 4 March 2021

© Crown copyright 2021
This publication is licensed under the terms of the Open Government Licence v3.0 except where otherwise stated. To view this licence, visit nationalarchives.gov.uk/doc/open-government-licence/version/3 or write to the Information Policy Team, The National Archives, Kew, London TW9 4DU, or email: psi@nationalarchives.gov.uk.
Where we have identified any third party copyright information you will need to obtain permission from the copyright holders concerned.
This publication is available at https://www.gov.uk/government/publications/evaluating-cdcs-financial-institutions-portfolio/evaluating-cdcs-financial-institutions-portfolio
Foreword

I am pleased to introduce the first independent portfolio-level evaluation published as part of the FCDO-CDC Evaluation and Learning Programme. This programme is a focused collaborative effort between FCDO and CDC to strengthen the evidence base and deepen our understanding of CDC’s impact through a series of in-depth sector-level evaluations.
Longer-term evaluations of CDC’s impact are critical to help FCDO and CDC better understand how, and in what contexts, CDC’s investments deliver tangible, sustainable development impact on people, businesses, sectors and overall economies. This information is crucial to help CDC target investments and track results in those businesses and sectors where it can have the most impact and can be used to inform both portfolio management and investment decisions.
This report is the first portfolio-wide analysis of CDC’s investments in financial institutions and gives new insights into the structure and distribution of CDC’s portfolio in this sector. Drawing from an expansive internal and external data set, it has been structured to facilitate learning across CDC and draws out lessons across a number of themes aimed to inform the development of CDC’s 2022-2026 strategy, to help CDC better manage development impact within its existing investments and improve the systems it has in place for tracking the impact of its portfolio.
While it is encouraging to note that the majority of investments are on track to deliver their intended impact, the evaluation also highlights areas where CDC could strengthen its approach to assessing development impact and where further and deeper analysis is required to better understand the impact of CDC’s portfolio. It will be followed up with in-depth studies looking at CDC’s work to support MSMEs and trade finance.
I wish to thank the independent evaluators at Genesis Analytics and IPE Global for their work so far, and to my colleagues who sit alongside me on the FCDO-CDC Evaluation and Learning Steering Group who have provided valuable guidance on the direction of this work.
Rachel Glennerster
FCDO Chief Economist & Chair of FCDO-CDC Evaluation and Learning Steering
Executive summary
Introduction and scope
The Foreign, Commonwealth & Development Office (FCDO) contracted Genesis Analytics and IPE Global to design and implement an evaluation of CDC Group’s (CDC) investments in financial institutions (FI). The purpose of this evaluation is to better understand the development outcomes and impacts associated with CDC’s investments in the financial sector. The overall contract consists of 3 components, namely an evidence review, an FI portfolio-wide evaluation, and a series of in-depth studies that will be combined into a final report.
This report jointly presents the findings of the evidence review and the portfolio-wide evaluation. The objectives of this report are: to provide insights on the existence, quality and quantity of literature that supports CDC’s FI impact framework and the derived evaluation questions; to provide insights into the overall size, distribution and features of the portfolio; to assess the extent to which CDC’s direct and indirect FI investments in Africa and South Asia are on track or have achieved their respective development impact (DI) thesis; to assess the geographic footprint of CDC’s investments relative to CDC’s DI Grid, which prioritises harder countries within Africa and South Asia for investment; and, to identify key themes across CDC’s FI portfolio, to assemble lessons that aim to inform a series of in-depth studies and CDC’s future FI sector strategy.
This report is predominantly informed by secondary research and some primary research through interviews with CDC’s investment, development impact teams and third-party peer reviewers. Therefore, this report provides a high-level view of CDC’s impact and aims to identify themes for further investigation that are structured to support CDC with learning and understanding its portfolio.
The portfolio-wide evaluation covers all direct equity, direct debt, 10 financial institution-focused (FIF) funds,4 debt funds, 7 master risk participation agreements (MRPAs) and 53 generalist funds.[footnote 1] The evaluation is informed by a combination of secondary data, i.e. publicly available data, CDC’s internal monitoring data (which has been shared under confidentiality where permitted), and primary data, i.e. interviews with CDC’s deal and development impact teams, to provide a descriptive analysis aimed at identifying trends, lessons and areas for further assessment.
In order to ensure commercial confidentiality, this report has been predominantly written using public information. Any data that is confidential, and has been used, is aggregated to a point where no underlying investment can be identified.
The evidence review provides a unique perspective on the literature tailored to substantiate and augment CDC’s impact vision for its FI portfolio. The evidence review has been conducted in line with FCDO’s best practice methods for synthesising research. This is a systematic method designed to gather high- quality evidence that answers 17 specific evaluative questions. A total of 441 studies were identified and reviewed. A total of 271 studies (61%) were of sufficient quality to be included in the coding process.
The portfolio evaluation utilises a logical methodology for measuring performance. This involves identifying key indicators that measure the achievement of an investment’s development impact thesis. The evaluation then assesses to what extent these indicators have been met and concludes on an investment’s performance. In this evaluation, over 500 documents and over 5,000 variables[footnote 2] were analysed.
Portfolio description
As at December 2019, CDC’s current (excluding the investment values of exits and write-offs) FI portfolio stood at approximately USD 1.67 billion U.S. dollars (USD) – at original cost - across 160 unique investments (which include generalist fund investments). The current portfolio (including the investment values of exits and write-offs) stood at USD 1.86 billion[footnote 3] across 180 unique investments as at 2019.
Figure 1: Portfolio description
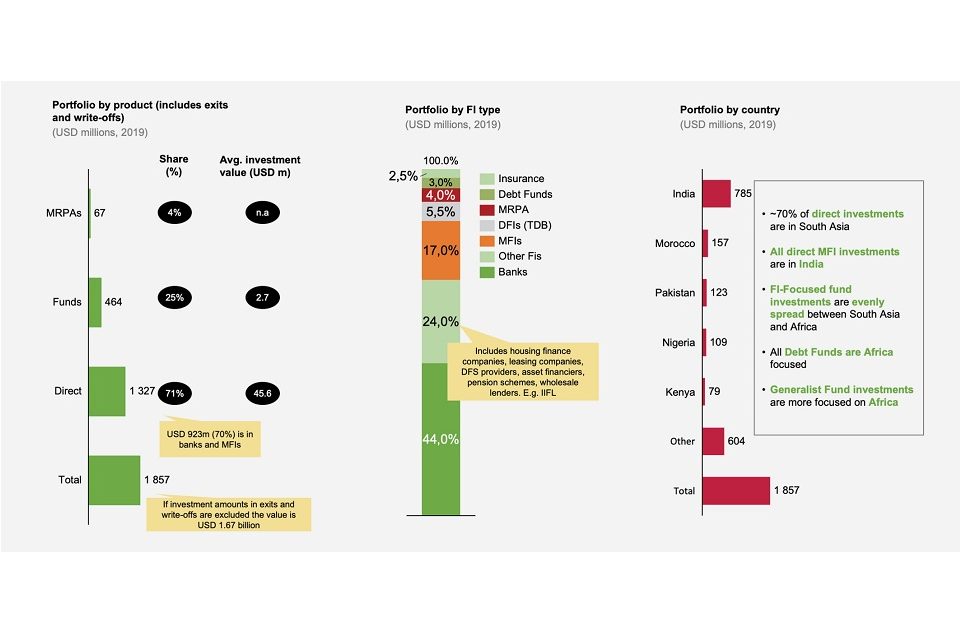
Approximately 71% of the portfolio is invested directly and the remaining is through funds and risk-sharing agreements. About 44% of the portfolio is invested in banks, 24% in other financial institutions and 17% is in microfinance institutions (MFIs). From a regional perspective, a large portion of the portfolio is invested in India, Morocco, Pakistan, Nigeria and Kenya.
Overall portfolio DI summary
Figure 2: DI performance summary
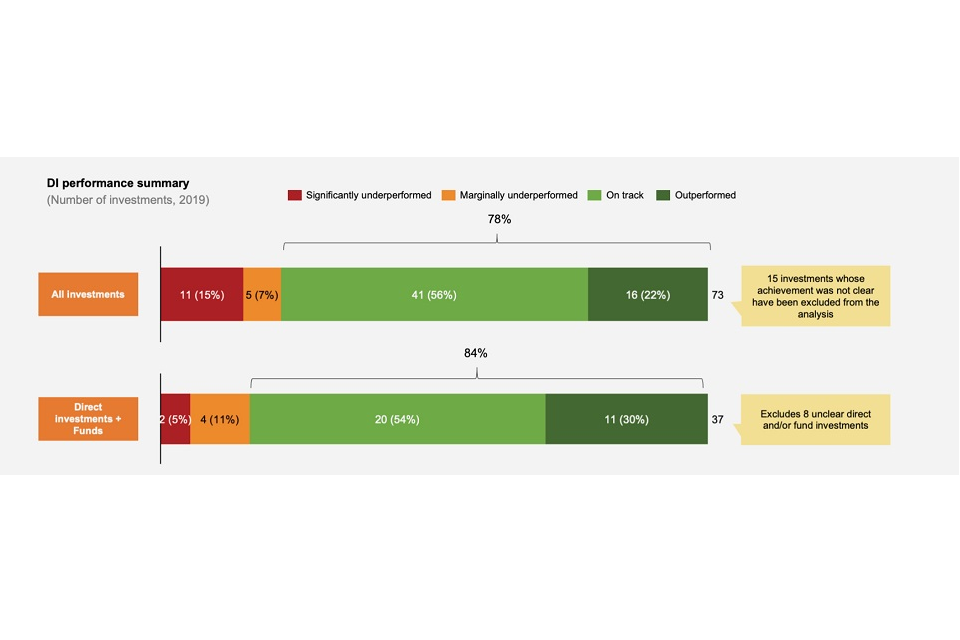
Note: All investments - this treats every investment on a standalone basis. Direct investments + funds - this treats fund investments as an average of the underlying investments it holds. This explains the difference between 84% and 78%.
From a DI perspective, 78% of the FI portfolio is either on track or has outperformed their DI thesis. Out of the portfolio, 15 investments have an unclear impact due to reasons such as too short an investment horizon (investment entered and exited in the same year) or the investment has been made more recently (i.e. in 2018 and 2019 where full data is not available).[footnote 4]
While the majority (78%) of the overall portfolio is on track or has outperformed with respect to the DI thesis, it should be noted that this high performance is partly driven by a lower hurdle prior to 2017 to measuring DI[footnote 5] i.e. some investments have relatively easier DI thesis to attain. To counter this, section 5 undertakes a thematic diagnostic of the performance of investments based on a broader number of impact parameters that are of relevance to investments in the FI sector. This thematic analysis allows a deeper understanding of the impacts of the portfolio and identifies strengths, weaknesses and areas for improvement.
Overall, MFIs and microfinance banks (MFBs – which are deposit-taking MFIs) in South Asia have done particularly well against their DI thesis. Most of the underperforming investments are in Africa and this applies consistently across investments in both commercial banks and MFIs. Underperformance has been primarily driven by operational, macroeconomic, business integrity[footnote 6] and regulatory issues (presented in the order of the largest contributing factor).
Of the 10 evaluated FIF funds, 6 are on track to achieving their DI thesis 4 of these are India-focused funds), 3 are marginally underperforming against their DI thesis (2 of which are Africa-focused funds) and it is too early to assess adequately one fund’s impact, as CDC’s investments in the fund were made post 2018. Of the 24 direct investments, 18 have outperformed or are on track to achieving their investment theses, 3 are underperforming and the remaining 3 were only added to the portfolio post 2018. Of the 7 master risk participation agreement (MRPA) investments, one investment outperformed, 3 investments are on track and the impact of the remaining 3 could not be determined. Three of the 4 debt funds outperformed or are on track with respect to their investment theses and the impact of the remaining one is unclear.
When collectively looking at direct investments, FIF funds,[footnote 7] MRPAs and debt funds, 84% of CDC’s investments are either on track or outperforming. The remaining 16% are underperforming (8 unclear investments were excluded from the calculation). This percentage differs from the 78% above as it calculates an average performance of a fund based on its underlying investments as opposed to treating each investment within a fund on a standalone basis.
Based on a review of key sector, DI and CDC’s general corporate indicators, several findings emerge.[footnote 8]
- loans and advances of the overall portfolio have grown, although it is not clear if these loans are reaching the targeted segments (e.g. small and medium enterprises (SMEs), households, women, etc.)
- FIF funds account for the largest share of loans in terms of the number of loans driven by relatively small investments in large banks
- as expected, average loan sizes are the lowest for MFIs given that they serve low-income retail customers
- the portfolio has seen strong growth in customers – measured as both depositors and borrowers – and the majority of the customers are reached by banks with large retail customer bases in South Asia. It is worth noting that digital financial service (DFS) providers account for only a small portion of the portfolio in value, but due to the nature of their business reach a considerable number of customers
-
altogether, MFIs and MFBs accounted for 62% of direct employment generated in 2018; possibly driven by their extensive branch and field officer networks. The 7 small finance banks (SFBs)[footnote 9] in India have done well in this regard.
-
South Asian investments have generally performed best in most of the metrics, driven by the relatively more stable macroeconomic environment compared to Africa, benefits arising from being able to reap economies of scale,[footnote 10] a more robust regulatory environment and better operational performance.
- overall, it was not possible to draw any firm correlations between profitability and DI and further analysis would be required to understand this relationship.
It should be noted that the above results look at the performance of the portfolio as a whole, rather than attributing performance to CDC. Currently within CDC there are efforts to begin applying an attribution approach whereby CDC’s impact can be ring-fenced from the total portfolio impact. However, these methods are yet to be developed further for them to be applied. Attribution is an important approach to measuring impact as it allows one to strip out CDC’s role clearly. Further applications and enhancement of impact measurement methodologies within CDC would support the accurate measurement of impact going forward and should be actively pursued by CDC.
Summary of the evidence review process
The evidence review uses FCDO’s best practice method on synthesising research. This method is designed to gather high-quality evidence that answers specific evaluative questions. Of the 441 studies identified and reviewed, a total of 271 (61%) were of sufficient quality to be included in the coding. The review of the evidence confirms many of the linkages within CDC’s FI impact framework. However, it also highlights several areas where the evidence base is weak, and further analysis is required in order to support the assumptions underlying CDC’s FI impact framework. For example, there is little evidence of specific FI types (e.g. commercial banks) contributing to the high-quality impact on firms and households based on FCDO’s methodology.
The key aspects of the evidence review method are explained below:
- framing of the evidence review: The evidence review consists of a review of formal evidence to validate the logic of the CDC FI impact framework across 17 key questions
- dimensions by which the evidence is assessed: The size[footnote 11] and quality[footnote 12] of the studies are the 2 dimensions by which the strength of evidence per research question is assessed. A key goal of the evidence review is to provide guidance on the plausibility of the causal relationship envisaged in the CDC FI impact framework. An important aspect here is whether the direction of evidence supports the assertion made in the evaluation questions
- the synthesis of evidence: The dimensions of evidence are mapped against the CDC FI impact framework. High-level aggregate findings from the evidence are overlaid with the findings from the portfolio evaluation. Thus, the perspectives on the evidence presented in this report relate to the existing body of available evidence from both the evidence review and the outcomes of the evaluation of CDC’s portfolio
- limitations of the evidence review: A lack of evidence does not imply that no impact occurs, but simply that this impact has not been documented in formal research that was found and reviewed through this process.
Portfolio evaluation based on themes and the lessons learnt
The portfolio evaluation is based on 7 selected themes that have been derived from CDC’s FI strategy and an in-depth analysis of individual investments. Based on this thematic analysis, a number of lessons have been noted. Within each theme, where relevant, high-level findings of the evidence review are presented. These are discussed in detail in the main body of this report. The portfolio evaluation is guided by the CDC FI impact framework and aims to assess impact against the framework to the extent possible. Given the overall data limitations, it was not possible to assess primary outcomes, secondary outcomes or ultimate impact, although in some cases this has been inferred. A final sub-section indicates the evidence available for the outcomes and ultimate impact portion of the CDC FI impact framework.
Theme 1: Geography
This theme explores whether CDC’s investments have reached the intended countries and Indian states as stipulated by their DI theses and from the perspective of the DI grid.
- there is a relatively even exposure of investments in harder ‘A/B’ (45%) compared with easier ‘C/D’ to reach countries and states[footnote 13] (46%) – India accounts for 42% of all investments by value. Outside India, ‘A’, ‘B’, ‘C’ and ‘D’ countries account for 6%, 23%, 10% and 11% of the portfolio respectively. The remaining 7% is invested in multiple countries. Using an estimation method[footnote 14] to include India, the total allocation of CDC’s investments in ‘A’, ‘B’, ‘C’ and ‘D’ countries is 22%, 23%, 17% and 29% respectively, with 8% in multiple countries/states Given that CDC prioritises ‘A/B’ over ‘C/D’ countries and states, this even exposure may not be ideal
- there are many MFI investments in the Indian direct and FIF funds’ portfolio – India has a large number of MFI investments by value and number. It is noted that India is a large country, and its GDP is on par with the whole of Africa. However, given the relative development of India’s financial system compared with financial systems in Africa, further analysis would be needed to understand the value added of allocating a large amount of funding to the sub-continent and in particular to the MFI sector. It is noted that the MFI investments have been successful, although there may now be an opportunity to refocus support to other types of FIs and sub-sectors
Theme 2: Reaching underserved households and scaling MFIs
This theme focuses on the extent to which CDC’s investments have reached underserved segments through the scaling of MFIs. This theme is meant to understand to what extent the investments are supporting household well-being in line with the CDC FI impact framework.
- MFIs have shown that they are able to reach the bottom of the pyramid although their scale is limited on an individual FI level – MFIs across the portfolio have shown to be reaching largely underserved segments. However, those in Africa have been less profitable and less able to reach scale. Further analysis on customer income levels is necessary to confirm this finding. It is also noted that certain banks engage in lending by using a microfinance model, have MFI subsidiaries, and/or engage in wholesale lending to MFIs and are thereby also reaching these segments
-
traditional, non-digitised MFIs in CDC’s African intermediated equity portfolio have had limited impact and have not reached scale – Across the continent, the stand-alone MFI lending model has been relatively unsuccessful (as measured by scale and financial sustainability). Most of CDC’s MFI portfolio in Africa has also suffered from poor performance with the exception of a few investments Additionally, in Africa, the MFI sector has recently experienced extensive competition from banks adopting MFI lending techniques and digital financial service providers. It is noted that CDC has recently been actively investing in DFS providers both directly and indirectly
- CDC played an active role in scaling Indian MFIs – CDC has played an active role in supporting the scaling of MFIs to SFBs through the provision of important technical assistance (TA – including as board members) and long-term stable capital. The sector is now relatively well developed, and MFIs are able to raise funding from the capital market. CDC could consider scaling back its support for a large number of MFIs in India in favour of other geographies/sub-sectors. However, these SFBs could still benefit from the TA provided by CDC
Findings from the evidence review: There is an abundance of high-quality studies that consider whether vulnerable groups are included within the financial systems in Africa and South Asia. The mechanisms used by FIs to reach underserved groups are considered in a moderate number of these studies. There is convincing evidence that MFIs and fintechs that offer tailored products targeted to underserved groups are successful in effectively reaching and providing valuable services to these cohorts.
Theme 3: Providing appropriate capital to SMEs
This theme focuses on the extent to which CDC’s investments have reached SME segments across CDC’s product range. This theme is meant to understand to what extent the investments are supporting firm well- being in line with the CDC FI impact framework.
- SME lending has grown in absolute terms, but has been flat relative to the banks’ loan portfolios – Of the 5 commercial banks in CDC’s direct and FIF funds portfolio which had a core development thesis focused on increasing SME lending, only one bank has shown a significant increase in the proportion of lending to SMEs. In this case, CDC played an active role and exerted influence through its board position. During this time CDC provided key TA and strategic support. While a constant share of lending to SMEs can be considered impactful, if the overall loan book is growing, it is not clear if these banks are reaching more SMEs (or simply serving their existing client base which might be small). Altogether, in order to understand the impact of bank SME lending it would be important to understand the number and types of SMEs that are being served
- specialised debt funds offer a successful way to target SMEs and underserved segments in specific sectors – CDC invested in 2 specialised funds: Regional Education Fund for Africa (REFFA) and the Medical Credit Fund (MCF). Both funds have a unique lending model that provides lending either directly or through partner FIs to specific economic sectors and benefited from grant-based TA under CDC’s Catalyst Programme. Both funds have gained a strong reach of women, youth and SMEs.[footnote 15]
- debt funds specialising in investment in SMEs struggle to scale when structured as close-ended funds, that can impact their financial viability and level of scale – From an impact perspective, such investments are important vehicles for extending finance to businesses that would not otherwise receive credit from banks, although, due to their structure, they tend to struggle. When structured as closed-ended funds they are constrained by the limited period for generating positive returns on their lending portfolios, i.e. a longer fund life or a permanent capital structure would allow these types of funds to preserve and build technical capacity and allow for recycling of repaid loans, helping to scale impact
- there are several upcoming digital lending models that are reaching SMEs in the portfolio, although overall investment in these FIs is low – CDC’s total investment in fintech and digital financial service providers is sparse (less than 3% of the portfolio). Part of this low penetration is driven by the fact that most of these investments are through funds (as the ticket sizes are too small for CDC to invest in) and CDC’s implied investment stake gets diminished alongside multiple other limited partners (LP)
Findings from the evidence review: There is significant evidence documenting the dynamics of interactions between FIs and SMEs. However, the outcomes and impact of these interactions are not traced or investigated in the literature. When it comes to larger SMEs or corporates and the contribution FIs make towards their development, there is limited available evidence.
Theme 4: Financial market liquidity for emerging markets
This theme focuses on the extent to which CDC’s investments are providing liquidity to the markets it invests in, thereby allowing FIs to increase lending
- some of the dollar-denominated debt to FIs in African countries has not been successful – Dollar- denominated debt facilities have been successful in specific instances in times of crisis, but overall foreign currency debt has limitations, as financial intermediaries on-lending in dollars assume significant credit risk when lending to enterprises without dollar-based export earnings. Hedging facilities are either expensive or unavailable, as forward foreign exchange (FX) markets are relatively fragmented and underdeveloped in the majority of African countries. Some investments across the African direct debt portfolio were repaid early due to low appetite for dollar-denominated debt. Other complementary instruments, such as partial credit guarantees, guarantees on locally issued bonds by FIs and local-currency lending could be considered to the extent that this is within CDC’s mandate and risk appetite
- debt investments in India might be less relevant than in Africa given the relatively large scale of Indian public debt markets – Market fragmentation is an issue in Sub-Saharan Africa (SSA) with an average corporate debt[footnote 16] to GDP ratio of less than 20% (with the exception of South Africa), while the equivalent ratio stands at 45% of India’s GDP (which is the size of the GDP of Africa). This implies that although the market is still developing, it is far larger and more liquid than markets in Africa, and corporate debt is therefore much more readily available. It is noted that some of the debt provided by CDC falls under the classification of Tier 2 capital[footnote 17] and hence further analysis would be needed to ascertain the shortage of this type of financing today, given that debt provides a much lower level of influence versus an equity investment
Findings from the evidence review: There is compelling causal quantitative evidence that financial inclusion increases economic growth. Modest evidence suggests that when FIs better manage their risks they are able to expand the credit they provide. This can contribute towards household investments into activities that improve future income opportunities (like education). There is a well- established need for capital in Africa and South Asia. There is also compelling evidence that small firms that receive capital injections are more likely to grow and employ staff. This indicates that there is a relationship between increased capital provision in a market and better outcomes for firms.
Theme 5: Developing capital markets
This theme focuses on the extent to which CDC’s investments are building capital markets across its relevant geographies to enable firms to access long-term financing.
- investments in the broader financial system and capital market have been lacking across the portfolio, particularly on the direct side – Almost all of CDC’s direct investments are in MFIs or banks. In line with CDC’s recently adopted FI strategy (2019), which emphasises the role of developing capital markets, there is an opportunity to consider increasing investment in insurance companies, pension managers, asset managers, fintechs and market infrastructure providers (credit bureaus and exchanges).[footnote 18]
- support to initial public offerings (IPOs) and listing of FIs is limited – CDC has supported SFBs in India to build their asset bases and speed up the listing process. As an anchor investor, CDC also supported Habib Bank Limited (HBL) in Pakistan in completing its privatisation process. However, there could be an opportunity to support more listings and private placements across both Africa and South Asia
-
multiple products can be used to support capital markets – While the products that CDC has used to support capital market development (such as private equity (PE) funds, direct investing and risk-sharing agreements) are relevant, there are other relevant products that could be utilised:
- direct lending/sector-specific lending, e.g. credit lines for directed lending to SMEs, mortgages, female borrowers, and so on. It is noted that CDC’s debt funds in the catalyst portfolio (REFFA and MCF) are already engaging in blended finance initiatives, i.e. lending jointly with partner FIs
- first loss and partial credit guarantees to FIs could be used to increase the risk-appetite of financial intermediaries targeting specific market sub-segments (such as SMEs)
- the role of SME debt and equity funds could be expanded across the portfolio as they are a conduit for directly providing long-term finance tailored to the needs of SMEs
- given the small size of local capital markets across most countries in Africa, CDC could consider investment in domestic wholesale development banks that encourage lending to SMEs. To do so, CDC could provide private banks with instruments such as partial credit guarantees and credit lines, thereby leveraging the private sector banks’ expertise in assessing credit risks, while intervening in a manner that is market-catalytic
Findings from the evidence review: The aggregate direction of evidence is positive, as an overwhelming number of studies show that market context significantly affects the ability of FIs to deliver impact. The main components supported by the evidence are infrastructure (both physical and financial), institutions, and regulations.
Theme 6: Risk-sharing agreements and counter-cyclical finance
This theme focuses on the extent to which CDC’s risk-sharing investments are delivering impact as envisioned by their development thesis, i.e. to alleviate issuing bank limits and reach a broad range of ‘A’ and ‘B’ countries. The main aim of this theme is to ascertain if CDC’s investments are making trade financing more accessible to firms and countries who need it.
- there has been good overall coverage of ‘A/B’ countries (accounting for 70% of trade finance (TF) in 2019) – In 2019, there was been good coverage of TF across ‘B’ countries that accounted for 67.7% of all trades, although the coverage to ‘A’ countries remains low at 2.6%. A sizeable share of trades supported are to relatively lower-priority ‘C’ countries. Bangladesh, Ghana, Kenya and Egypt (‘C’ countries) accounted for 29.7% of all trades supported, while CDC did not engage in facilitation of trade in any ‘D’ countries
- issuing bank limits is not the only challenge limiting TF[footnote 19] – CDC’s TF investments have placed a large focus on mitigating confirming bank limits on countries and issuing banks, although recent studies have cited multiple reasons for TF rejections. Studies such as the Asian Development Bank (ADB) 2018 survey[footnote 20] and International Chamber of Commerce (ICC) 2018 survey have cited a variety of other reasons for TF rejections which range from anti-money-laundering (AML) issues to country limits and global de-risking (confirming banks). CDC is working to address some of these issues, and there would appear to be an opportunity to work with issuing banks directly (banks that issue TF products) to understand the main drivers for rejected letters of credit and formulate a strategy that best addresses these challenges. It is noted that CDC is already beginning to engage in this space
- lack of diversity in partner banks supported – Of the 7 MRPA investments made by CDC,4 are to Standard Chartered Bank (SCB) – a dominant player in the global TF market. SCB’s total TF facility was USD 400 million compared with the other 3 partners (2 of which are African partner banks[footnote 21]), which collectively amounted to USD 300 million.[footnote 22] It is noted that, according to the AfDB, SCB is the largest TF confirming bank in Africa, and further analysis would be required to ascertain if CDC could be potentially reinforcing this market leader position. It should be noted that the TF strategy envisages entering into new partnerships with other partner banks and, since forming a standalone trade and supply-chain finance team, CDC has been ramping up new partner deals rapidly
- CDC’s supply-chain finance product is partly limited by a lack of local partner banks – The supply- chain finance product has had limited reach. Additional local partner banks and partnerships with more anchor buyers could be explored to scale up the facility that could potentially be impactful in securing financing for SMEs and helping them manage their working capital. Another approach CDC might consider is supporting the establishment of factoring platforms, which build on the creditworthiness of the buyer while circumventing the high costs associated with the provision of banking services
- counter-cyclical finance products are important, but a broader toolkit may be needed – CDC has been able to play an active role in mitigating the effects of various crises on economies and firms. One such example is the Sierra Leone (SL) risk-sharing facility during the Ebola crisis in West Africa. Although these investments were highly relevant during these periods, CDC may benefit from a broader toolkit of products that would increase its response to various types of financial crises. Different crises require different responses depending on whether they are local, regional or global and also depending on the macroeconomic structure of the country and market being supported
Findings from the evidence review: There is limited evidence regarding the impact of TF. However, a high-quality generally applicable study indicates that medium to long-term trade credit is causally linked to export growth in Africa and Asia. There is limited but positive evidence that targeting TF towards those industries that rely heavily on the availability of working capital is more likely to eliminate a binding credit constraint for promising SMEs.
Theme 7: Gender
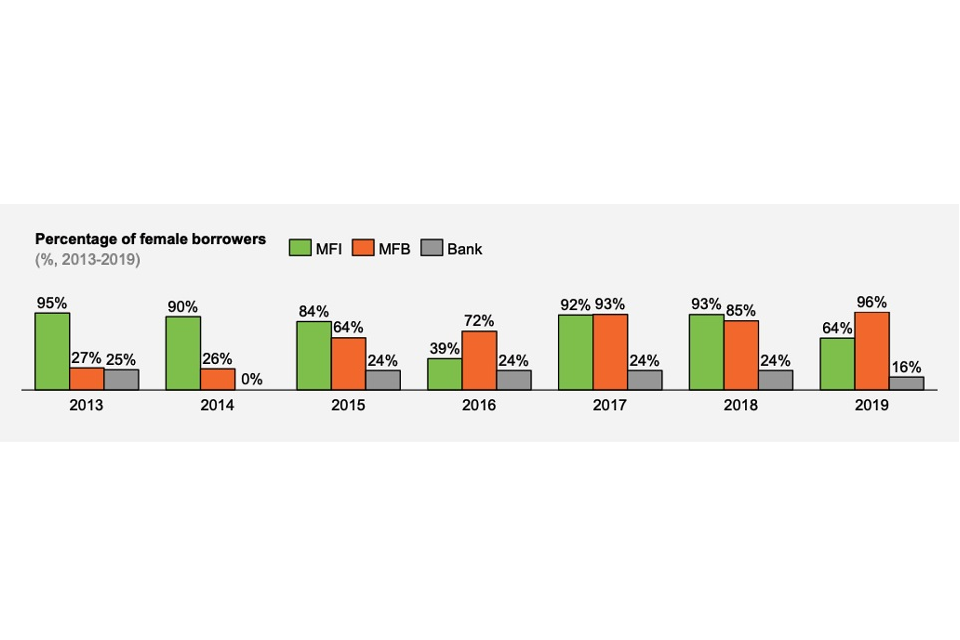
This theme focuses on the extent to which CDC’s investments have reached women in general across all investments.
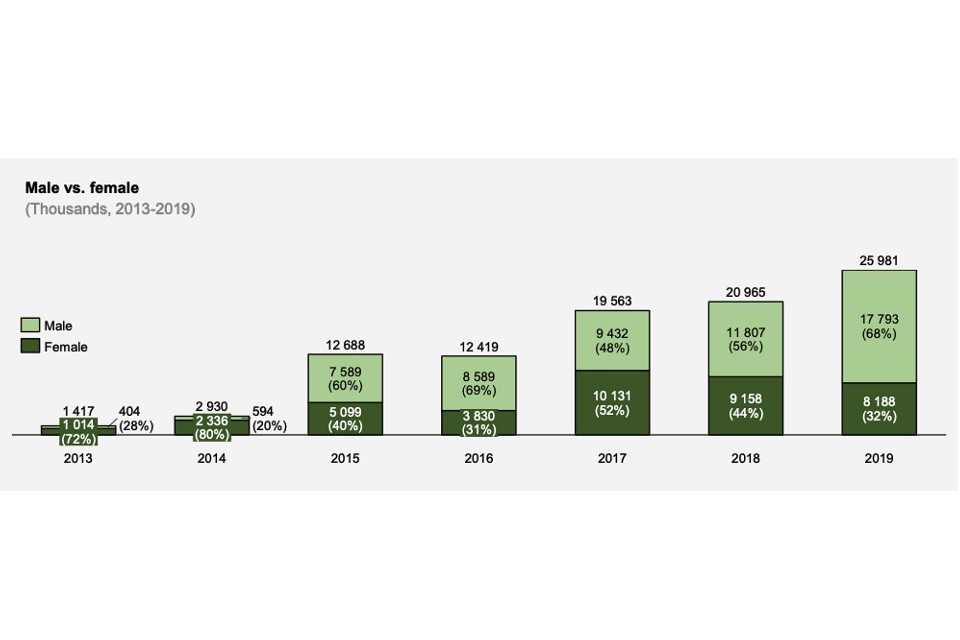
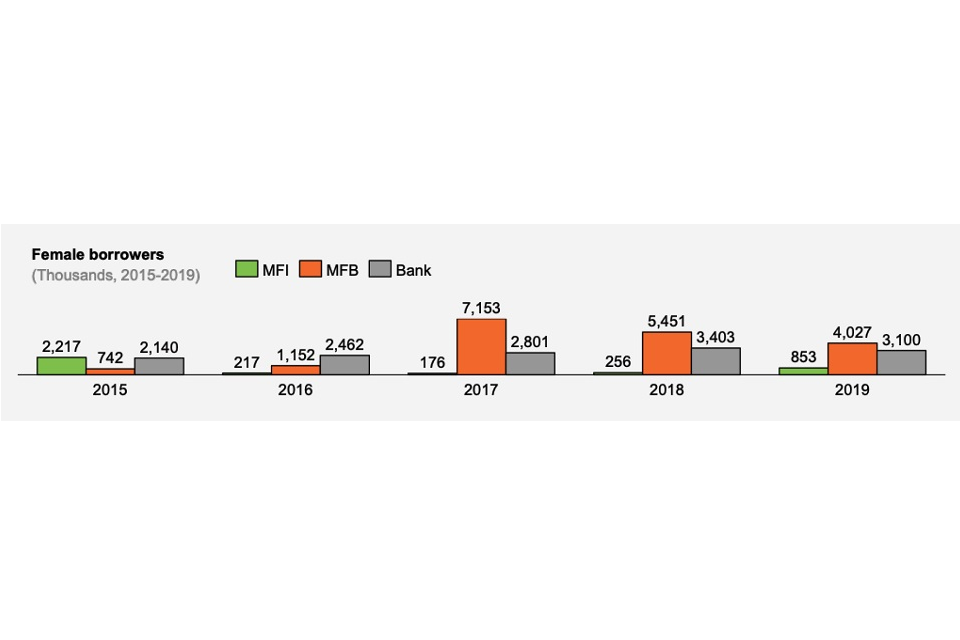
- there is a lack of evidence around efforts to increase gender-based lending in banks – On average, women made up 22% of bank customers from 2013 to 2019. This is in stark contrast to MFBs, which averaged 66% over the same period.[footnote 23] As at 2019, women accounted for 96%[footnote 24] of customers in MFBs while in banks they accounted for 16%. However, in terms of the absolute number of customers, microfinance banks (MFB) served only about 900 more female customers than banks. Thus, owing to their scale, banks have been able to reach almost as many women as MFBs
- there is a lack of a consistent approach to gender inclusion across DI theses of investments – Additionally, the extent to which a concerted effort was made with CDC’s investments to target women is unclear. A more consistent approach to DI regarding gender should be adopted to ensure that all CDC’s investments are working towards this common goal – noting that the gender function is still ramping up: CDC launched its gender strategy in 2018, while more than 90% of investments (by number) pre-date the adoption of the gender strategy
Validating the intended outcomes and impacts in CDC’s FI impact framework using external evidence
The CDC FI impact framework envisages that investment in FIs leads to a strong, inclusive financial system, GDP growth and poverty alleviation that results in improved well-being for households and firms. A review of existing literature offers additional insights into whether the causal linkages within CDC’s FI impact framework hold true.
-
there is limited evidence linking FIs to firm and household well-being – The CDC definition of well-being encompasses multiple aspects (i.e. growth, resilience, consumption and wealth). The evidence available for each of these aspects originating from an interaction with FIs is not substantial, although there is greater evidence available for firms than for households. However, the evidence for firms is dominated by evidence for micro-enterprises. Further, the definition of firm well-being when it comes to micro-enterprises is not easy to disaggregate from household well-being, as such small firms are frequently intermingled with households financially. There is no formal evidence regarding larger SMEs or corporates.[footnote 25]
-
the logic behind the ultimate impact of strong inclusive financial systems on GDP growth (and eventually on poverty alleviation) is verified by the evidence – The evidence proves a causal relationship between strong, inclusive financial systems and GDP growth. On the other hand, the evidence that strong, inclusive financial systems lead to poverty alleviation is inconclusive, although the evidence does indicate that access to financial services in the correct context can support poverty alleviation
CDC’s value addition activities
Value addition activities are support provided by CDC in addition to the capital it provides. The main value addition activities that CDC provides includes (not exhaustive):
- supporting FIs by strengthening their financial crimes compliance and integrity controls to ensure they adhere to regulations in the markets that they operate in
- supporting FIs in building environmental and social (E&S) standards, capacity and processes. Typically, this includes environmental and social management systems (ESMS), policies and procedures, capacity building, and for FI equity investments, potentially an E&S committee to help drive change. The E&S team also supports financial inclusion, literacy, and increasingly, climate change
- supporting FIs to consider gender from an employment and customer perspective and report on key gender metrics with the aim of achieving a balance between males and females across their business operation
- ensuring FIs understand, adopt and implement customer protection principles where necessary
- supporting FIs to monitor and measure development indicators
While some of these functions are recent, and in a ramp-up phase (gender), they play an important role in achieving the DI thesis set for the FIs. They ensure that CDC is taking a holistic view to development, that FIs are able to deliver impact as envisioned in the DI thesis and that these FIs are setting an example in the markets in which they operate. Based on the materials reviewed, it is noted that most of these interventions are concentrated on direct investments, and going forward, CDC could consider more support to funds, even though standardisation of monitoring across funds will be harder to achieve, given multiple LPs in a fund, not all of whom will have the same strategies.
Findings from the evidence review: Most of the evidence regarding value addition centres on TA. The evidence indicates that appropriate medium to long term TA paired with an investment is causally linked with an increase in impact created by the FI’s involvement.
General observations and data limitations
While analysing the FI portfolio several items emerged that were general in nature, and these have been captured within this section. Some of these include:
- inconsistent and general lack of information on underlying households and firms being reached – CDC’s current impact reporting is largely informed by public information for direct investments (partly resulting from stringent insider trading requirements – where all shareholders should only have access to the same information) and fund reporting for indirect investments. With the exception of a few selected direct and fund investments, general reporting on end beneficiaries (e.g. reporting on whether FIs are fulfilling their DI theses with regard to reaching SMEs and low-income customers, etc.) is missing. Impact reporting could be improved by requesting FIs and funds to provide more detailed information on underlying borrowers and customers. Such information is integral to measuring impact and to strengthening CDC’s strategy both as regards the choice of investees and in understanding and supporting product development
- lack of a consistent definition for underserved and SME segments – While analysing the data it was noted that several DI theses referred to SMEs, women and underserved segments generally without referring to their relative size or defining these segments clearly. While it is a challenge, it would be beneficial to standardise this across CDC’s FI focus countries and FI types in order to enhance impact reporting
- there is a general lack of data on Indian investments’ regional loan exposures – Based on the investment reporting and public information, it was not always possible to understand how loans were being disbursed across Indian states (partly resulting from stringent insider trading-related data sharing requirements)
- lack of data on the benefits of TF to partner banks and beneficiaries being reached – Overall it was not possible to ascertain the benefit that CDC provides to partner banks without understanding the total support these partner banks receive from other development finance institutions (DFIs) and to what extent their TF portfolios have grown. Also, the extent of the benefits to the underlying beneficiaries was not clear due to lack of data
- inconsistent public information – Several companies were unlisted or did not publish financials, which limited the exhaustiveness of the analysis. Also, most companies published inconsistent data from year to year and when compared with each other. This limited the consistency of data collected across years, across FIs and markets
- DI theses in several cases are vague – Overall it is difficult to measure impact due to the opacity of these DI theses, and the specificity of the theses could be improved. The theses could also be standardised to a greater extent so as to enable comparison across investments and to encourage the collection of comparable data across investments
Topics for in-depth studies
There are multiple topics that have been identified for further analysis and exploration through in-depth studies. The aim of these studies will be to provide more insights into which investments are having/had the most impact, what types of data FIs collect and how CDC can in future improve its impact, as well as its monitoring and evaluation (M&E) processes. The list below identifies areas for potential in-depth studies, and further work needs to be carried out to prioritise and understand which are the most important topics for CDC given the distribution and size of the portfolio by region, product, FI type and other factors. The topics and overarching evaluation questions have been listed below.
- scaling MFIs – What is the impact of scaling MFIs on firm and household well-being? This topic aims to understand CDC’s role in scaling MFIs in India and what impact this has had on improving household well-being
- SME financing – What is the optimal financing method to support SMEs? This topic aims to understand the benefits and drawbacks associated with alternative methods of reaching SMEs and which methods have the greatest reach
- SME impact – What is the impact of finance on firm well-being? This topic aims to understand the impact of CDC’s support to banks on firm-level well-being, i.e. SMEs
- trade finance – What are the benefits and impact of trade finance at the partner FI, issuer FI, and importer level? And what are the benefits and impact of trade finance during COVID-19 at the partner FI, issuer FI, and importer level? This topic aims to understand the extent to which CDC’s trade finance facilities are having an impact on its partners and firms
Introduction
Objectives
The Foreign, Commonwealth and Development Office (FCDO) contracted Genesis Analytics and IPE Global to design and implement an evaluation of CDC’s investments in FIs. The purpose of this evaluation is to better understand the development outcomes and impacts associated with CDC’s investments in the financial sector. The evaluation consists of 3 components, namely a portfolio evaluation, evidence review and a series of in-depth studies.
This document presents the combined findings of the detailed portfolio and evidence evaluation conducted over the period of January 2020 to April 2020.
The evaluation has the following objectives:
- to understand the extent to which CDC’s FI investments are on track or have achieved their respective developmental impact (DI) thesis
- to understand the extent to which CDC’s investments have had an impact in line with the CDC FI impact framework
- to enable cross-portfolio comparisons of impact to the extent possible, e.g. comparing the impact of: direct vs. indirect investing, debt vs. equity, Asia vs. Africa, banks vs. MFIs vs. digital financial services (DFS), and specialised SME funds vs. generalist SME funds
- to identify emerging themes and investments for in-depth studies that could provide a deeper understanding of lessons learned from the FI portfolio
- to provide insights on the existence, quality and quantity of evidence that support CDC’s FI impact framework and the derived evaluation questions
The findings of the evaluation have been informed by a combination of publicly available data, peer-reviewed journals, CDC internal monitoring data[footnote 26] and meetings with CDC’s relevant investment teams.
Scope of the evaluation
In order to achieve the above objectives, the following scope of investments were defined for the evaluation.
- all current direct FI investments in Africa and South Asia (including any exits from post-2012 direct investments) across the FI Equity team, FI and corporate debt teams and the trade and supply-chain finance team
- all current fund commitments in Africa and South Asia with at least one underlying FI investment across FI focused equity funds,[footnote 27] selected debt funds (these are funds that lend directly or in partnership with FIs to SMEs and retail clients) and generalist equity funds with at least one active FI investment – a detailed evaluation of these investments has not been conducted, although the overarching development indicators have been assessed.[footnote 28]
- in evaluating each FI, over 500 documents and over 5,000 variables were reviewed
- in reviewing the evidence supporting CDC’s FI impact framework, 441 studies were identified and reviewed. A total of 271 studies (61% of the total studies found in the search process) were of sufficient quality to be included in the coding process for the evidence review
There are some investments that have been made recently (i.e. in 2018, 2019 and 2020). These investments are covered briefly, as it would be too early to assess impact given the availability of data and the limited duration for an FI to implement its strategy post CDC’s investment. It is important to note that this evaluation focuses only on the underlying investments in the case of fund investments and provides an overall performance of the funds based on these investee reviews, where applicable.
CDC’s approach to financial sector development
This section presents a high-level view of CDC’s approach to development from an FI sector perspective. The section describes:
- CDC’s FI impact framework
- the DI grid
- CDC’s approach to monitoring DI and the DI thesis for each investment
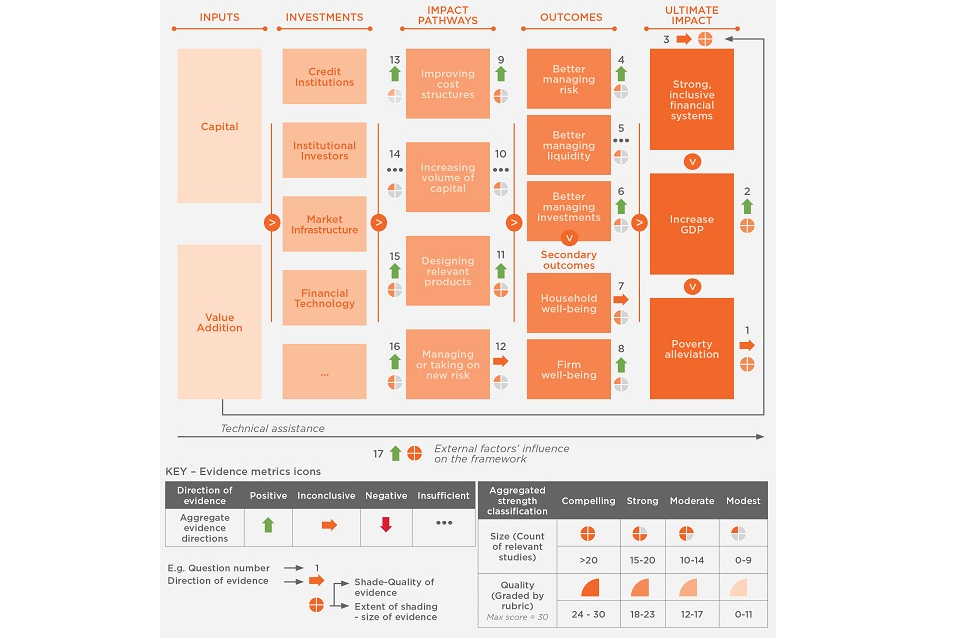
CDC’s FI impact framework The figure below presents CDC’s FI impact framework. The framework is built on the rationale that through the provision of capital and value addition[footnote 29] (TA) to financial sector investees and intermediaries, impact is achieved through 4 main pathways. These pathways include:
- improving costs structures – Working with institutions or enablers to reduce the cost to serve, improving unit economics and becoming more cost-efficient, ultimately accruing benefits to the customer
- increasing the volume of capital – Providing capital required to scale FS, particularly by increasing the provision of capital to underserved or high-growth segments or facilitating the entry of new capital
- designing relevant products – Diversifying the suite of financial products available in the market, including retail, corporate, and investment products. Focusing on appropriate delivery and availability of those products in a scalable and sustainable way
- managing or taking on new risk – Motivating and incentivising FIs and market enablers to manage their risk better, or learn to take on new risk; normalising perceived risk, enabling more sophisticated risk- based pricing
Through these pathways, it is envisioned that CDC’s FI investments will lead to improved household and firm well-being, which will lead to inclusive financial systems, more economic growth and an overall reduction in poverty. The size[footnote 30] and quality[footnote 31] of the studies are the 2 dimensions by which the strength of evidence per research question is defined. A key goal of the evidence review is to provide guidance on the plausibility of the causal relationship envisaged in the CDC FI impact framework. To aid this process, the aggregate direction[footnote 32] of the evidence has been represented per question. The evidence review metrics are mapped against the CDC FI impact framework in Figure 3. The question numbers are linked to the question text in Table 1. The 3 metrics summarising the strength and direction of evidence per question are shown under each question number[footnote 33] in Figure 3. For example, Question one (Does access to FS reduce poverty?) has a compelling size of evidence, a strong quality of evidence, and the direction of evidence is inconclusive.
Figure 3: CDC’s FI impact framework
The portfolio evalution has been grounded in CDC’s FI impact framework. Each investment has been assessed along its DI thesis and mapped according to the CDC FI impact framework. A detailed review of all investments has not been included in this evaluation report. However, the findings of the evaluation have been presented based on themes that emerged while reviewing the investments. The portfolio evaluation is guided by the CDC FI impact framework and aims to assess impact against the framework to the extent possible. Given the overall data limitations, primary outcomes, secondary outcomes or ultimate impact was not possible to assess, although in some cases this has been inferred.
The evidence review has been conducted in line with the FCDO’s best practice methodology for synthesising research. This method is designed to gather high-quality evidence that answers specific evaluative questions. A total of 441 studies were identified and reviewed. A total of 271 (61%) of the 441 studies were of sufficient quality to be included in the coding process.
Table 1: Summary of quality, quantity, and direction of evidence for evidence review questions
| Evidence metrics | |||
|---|---|---|---|
| Question # | Evidence review questions | Size & Quality | Direction |
| Ultimate impact | |||
| 1 | Does access to FS reduce poverty? | ||
| 2 | Do strong, inclusive financial systems generate GDP growth? | ||
| 3 | Do investments in FIs help build strong inclusive financial systems? | ||
| Outcomes: Do FIs influence firm and household well-being? | |||
| 4 | Do FIs influence risk management of end-users? | ||
| 5 | Do FIs influence liquidity management of end-users? | ||
| 6 | Do FIs influence investment management of end-users? | ||
| 7 | Does better managing risk, liquidity and/or investment affect household well-being?* | ||
| 8 | Does better managing risk, liquidity and/ or investment affect firm well-being? | ||
| Impact pathways to delivering primary set of outcomes | |||
| 9 | Do FIs that experience an improvement in cost structures generate positive outcomes for firms and households? | ||
| 10 | Do FIs with increased volumes of capital generate positive outcomes for firms and households? | ||
| 11 | Do FIs that design relevant and sustainable new products generate positive outcomes for firms and households? | ||
| 12 | Do FIs that better manage or take on new risks sustainably generate positive outcomes for firms and households? | ||
| Inputs to support impact pathways | |||
| 13 | Can an intervention in an FI from a DFI such as CDC be associated with an improvement in cost structures? | ||
| 14 | Can an intervention in an FI from a DFI such as CDC be associated with an increase in volumes of capital? | ||
| 15 | Can an intervention in an FI from a DFI such as CDC be associated with the design of relevant products? | ||
| 16 | Can an intervention in an FI from a DFI such as CDC be associated with an improvement in managing or taking on new risks? | ||
| External factors’ influence on the framework | |||
| 17 | Does market context affect FIs’ ability to deliver outcomes and impacts? |
Table 1: *[footnote 34]
The evidence review and portfolio evaluation are complementary but originally set out to understand the CDC portfolio through different approaches that relate to the CDC FI impact framework. The evidence review unpacked external evidence for the causal pathways linking investments to the ultimate impact envisaged by CDC. The portfolio evaluation considered internal CDC investments and their relationship with the ‘Impact Pathway’ segment of the CDC FI impact framework through the DI theses per investment. The portfolio evaluation summarised the findings from this analysis in 7 key themes.
For the purposes of alignment, the key findings related to the evidence review questions have been mapped to the 7 themes identified by the portfolio evaluation in this combined report. The evidence related to each theme of the CDC FI portfolio evaluation is summarised in a box at the end of each theme’s section.
DI grid[footnote 35] For each investment that is made by CDC, the DI grid is utilised to map and rate the investment in terms of potential impact. The grid is made up of 2 main variables as explained below:
- geography – Investments are classified according to their geographies, i.e. the most difficult markets and/ or the least developed from a financial sector perspective
- business sectors – This includes the propensity to generate employment, rated as high, medium or low
Throughout this document, reference is made to the geography component of the grid when assessing the impact of certain investments and also the overall exposure of CDC’s FI portfolio.
The DI thesis and FI portfolio monitoring processes The main monitoring processes that CDC uses for its FI portfolio include the following:
- Quarterly Portfolio Reviews (QPRs) – Records key developmental indicators to track whether the DI thesis is on track for an investment
- Annual Monitoring Reports (AMRs) – An annual process of recording broader metrics such as employment, gender-related metrics, taxes paid, youth employment and so on
It is also important to note that CDC started developing a concise, explicit statement of its intended DI (a ‘DI thesis’) for all investments from the beginning of 2018 and retrospectively for investments made after 2012 with certain exceptions. This evaluation is informed by the mentioned monitoring reports and publicly available information (further elaborated in the methodology section of the annex).
Portfolio description
As at 2018,[footnote 36] CDC’s total portfolio across all sectors stood at USD 5.64 billion (GBP 4.3 billion). Roughly 46% of the portfolio is invested through funds and the rest is through direct equity and debt investing. Based on the same annual report, the FI portfolio accounts for 22% (USD 1.24 billion) of the total portfolio.[footnote 37] It should be noted that CDC’s portfolio value in its annual report is based on market valuations and excludes portfolio realisations.
Description based on product
Based on the provided data, as at December 2019, CDC’s total active (excluding exited and written off investments) portfolio at original cost stood at USD 1.67 billion.
For the purpose of this document, CDC’s FI portfolio is presented based on historical original cost and includes investments that have been realised or written off in order to show how CDC has historically deployed its funds. Based on this adjustment, CDC’s FI portfolio amounted to USD 1.86 billion[footnote 38] across 180 unique investments. 71% of the portfolio consists of some form of direct equity or debt investments, 25% is through all funds (debt funds, FIF funds and generalist funds) and 4% of the portfolio is in MRPAs[footnote 39] – such as TF (TF), supply- chain finance (SCF) and corporate debt-risk sharing facilities.
This evaluation focuses on only 88 out of the 180 investments, given that the other 90 investments belong to generalist funds that do not have a specific financial sector focus, one investment has no quarterly reporting data as yet, and one fund investment had a close to zero investment value.
Figure 4: Portfolio breakdown - by product
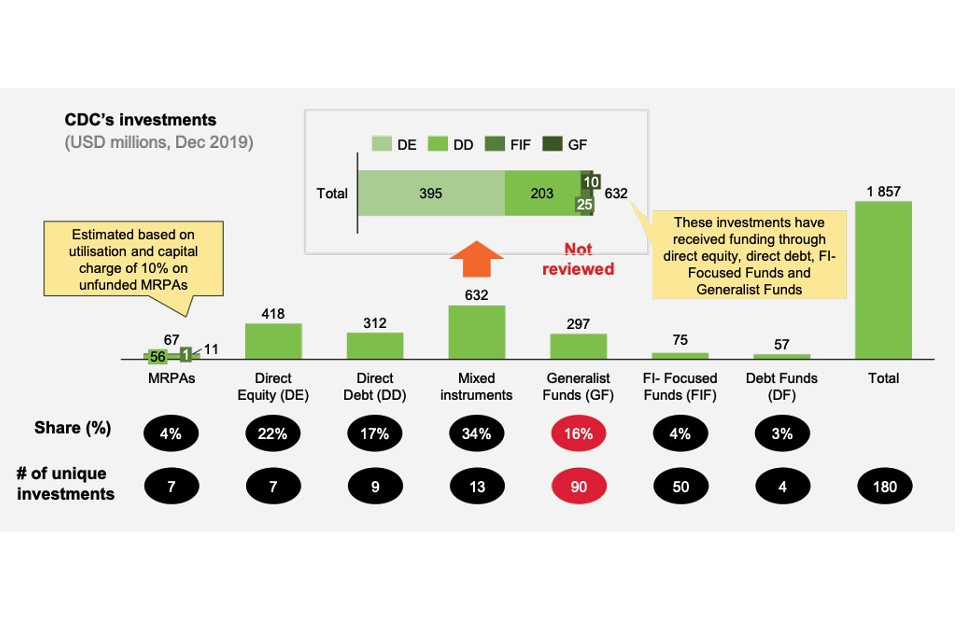
Note: The figure above is based on original cost data rather than current market valuations. It also includes exited/realised investments. Funded MRPAs adjusted for utilisation rates and unfunded MRPAs adjusted for utilisation and a capital charge of 10% (MRPA data is shown exclusive of fees). Mixed refers to investments receiving funding from more than one product.
Description based on FI type
In the figure below, we present CDC’s FI portfolio by the different institutions that it invests in.
Figure 5: Portfolio breakdown - by FI type
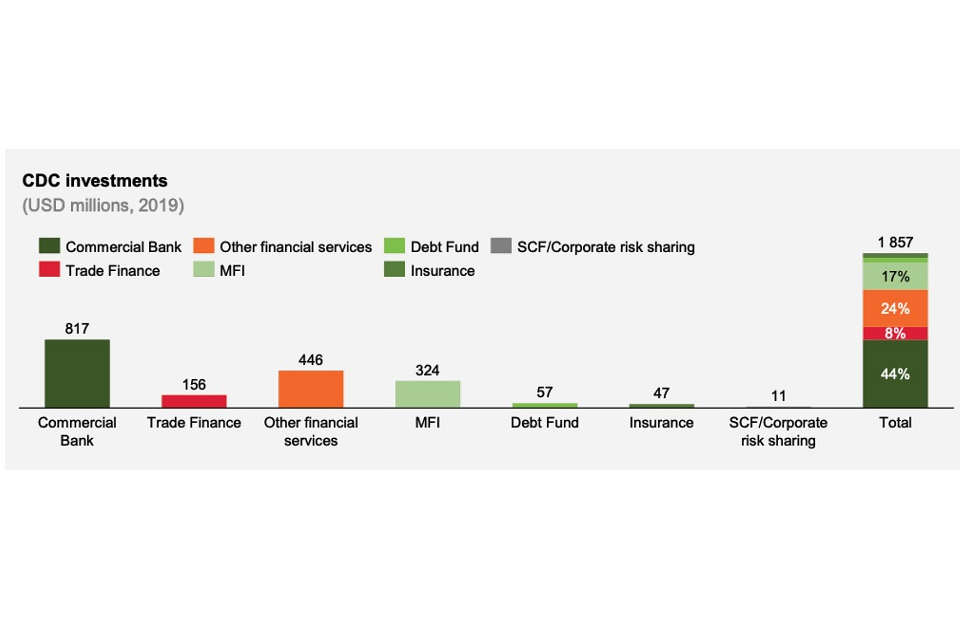
Note: Other FIs include digital financial service providers, pension funds, payments companies, housing finance (HF) companies, diversified product lenders, asset financiers and leasing companies. In this image TDB Africa (a direct debt investment)[footnote 40] has been grouped with TF as the funds are primarily used for TF.
About 44% of CDC’s FI portfolio is invested in commercial banks, followed by other FIs that account for 24% and MFIs that account for 17%. One direct investment in India Infoline Finance Limited (IIFL)[footnote 41] accounts for approximately USD 198 million of the total amount invested in other FIs (USD 446 million) – i.e. approximately 44.4% of other FIs.[footnote 42]
Description based on region
Figure 6: Portfolio breakdown - by country of main operations
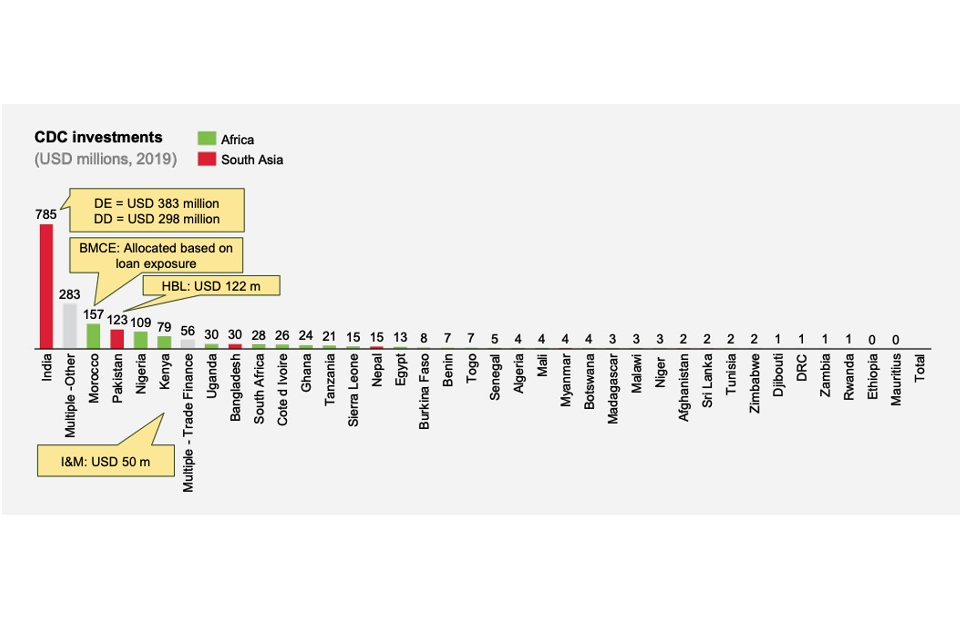
Note: Called out Investment values available from CDC’s website
Based on a regional view of the portfolio, investments are concentrated in 5 main countries that account for 67% of investments by value. These are India, Morocco, Pakistan, Nigeria and Kenya.
Overview of direct investments
A detailed overview of CDC’s direct investments indicates that all direct African investments are in banks, and all direct investments in South Asia are in banks, MFIs or other non-bank credit providers. A review of the risk- sharing agreements show that a large proportion of these investments are with SCB.
Overview of fund investments
- debt funds – Collectively, these account for USD 57 million in investments. These funds tend to focus on lending to SMEs and/or individuals either in partnership with other FIs or directly
- FIF funds – A total of 10 financial institution-focused (FIF) funds are reviewed in this document. Collectively, these funds account for 59 unique investments worth USD 100 million (average ticket size of USD 1.7 million). From an FI perspective, 50% of the investments are in other FIs,[footnote 43] 26% are in MFIs, 14% are in commercial banks and 10% are in insurance companies. From a regional perspective, 52% are in India and the rest are relatively evenly spread across multiple countries
- generalist funds – Collectively, these funds account for 96 investments,[footnote 44] accounting for USD 307 million, resulting in an average investment value of USD 3.2 million. It should be noted that these investments have not been reviewed beyond this section. From an FI perspective, 45% are in commercial banks, 40% in other FIs, 12% in insurance and 3% in MFIs. On a regional level, generalist fund investments are concentrated in Nigeria (25%), India (17%), South Africa (7.5%), Kenya (6.5%), Ghana (6.2%), Cote d’Ivoire (6.2%) and Egypt (4.2%).
Overview of instruments used by CDC to deliver impact
In order to deliver impact, CDC has used 6 main instruments across its portfolio that are described below:
- equity capital – Generally used to gain an equity stake in a business and a board seat so as to influence the strategy of an FI. Through this instrument, a financial institution is generally able to strengthen its equity base in order to comply with regulatory capital adequacy requirements. Additional capital allows the bank to expand lending, increase leverage and grow its overall balance sheet
- Subordinated debt to existing senior debt and qualifying as Tier 2 capital – Generally used to strengthen the capital base of an FI to allow it to expand its balance sheet. A slightly more limited instrument than equity, as the ability to influence the strategy of an investee may be limited
- intermediated equity – Provided through funds to invest in underlying companies with the same effects as equity capital, although CDC would have less influence depending on its implied stake
- intermediated debt – Provided through funds or holding companies for on-lending purposes
- senior unsecured debt, ranking in pari-passu[footnote 45] with all senior obligations of the borrower – Generally used for on-lending to any customer or specific customer segments. This type of instrument is used to encourage FIs to lend to a particular sector/segment and provide liquidity
- risk-sharing agreements – This instrument is generally used to encourage FIs to target specific segments and increase lending to customer segments that would not have otherwise received credit. The aim of this instrument is to build capacity for FIs, to allow them to experiment with on-lending to certain segments and eventually for the FIs to be able to do it on their own. This form of support also allows an FI to be able to release regulatory capital and allocate it to other forms of lending.
Portfolio description summary
From a descriptive analysis of CDC’s FI portfolio, the following emerges:
- seventy one percent of all investments are direct, 25% through funds and 4% are through MRPAs
- thirteen investments receive multiple funding lines either through direct or indirect products
- direct investments have larger average investment values (USD 45.6 million) than fund investments (USD 2.7 million)
- FIF fund investments are evenly spread between South Asia and Africa, while generalist fund investments are more focused on Africa
- microfinance institutions (17%) and commercial banks (44%) account for 61% of the portfolio by value
- funds are invested in a more diverse range of FIs using lower average investment values
- forty two percent of investments by value are in India and the remaining majority are in Africa and South Asia
Overall portfolio DI summary
This section provides an analysis of the overall performance of CDC’s FI portfolio against:
- their respective DI thesis
- CDC’s corporate and FI sector development indicators, which include total loans and customers (FI sector DI indicators) and jobs sustained/created, female employees and taxes paid (CDC corporate indicators)
The findings are analysed from a region, product and FI type perspective. The final part of this section provides an overall summary and lessons.
Performance against DI thesis
CDC started developing a concise, explicit statement of the intended DI (a ‘DI thesis’) for all investments from the beginning of 2018. Prior to this, information about the investments’ intended impact was included in the investment committee (IC) paper for each investment and discussed at the IC; the articulation of the intended impact varied across investments.
DI theses have been developed retrospectively for all post-2012 commitments (which includes all direct deals in this study, except for a few investments made pre-2012 and any direct investments that had already been exited). For those investments without a DI thesis, the evaluation team reviewed the original IC paper and inferred a DI thesis for the purposes of this assessment.
The assessment against the respective DI thesis was conducted by the evaluators across the 88 reviewed investments and 10 FIF funds. In order to facilitate a measure of achievement, the following discrete performance criteria are defined to describe the performance of an investment against its DI thesis. In certain cases, a qualitative adjustment was made for those investments at the border of categories.
- outperformed – 100% achievement against the respective DI thesis indicators
- on track – 50%-99% of the DI indicators are achieved
- marginally underperformed – 25-49.9%% of the DI indicators are achieved
- significantly underperformed – 0-24.9% of the DI indicators are achieved
- unclear – Investment was made after 2018; the nature of investment was not aligned with the development thesis or there was insufficient data to conclude on an outcome
Both direct and fund investments have been evaluated using similar indicators and in line with their respective formulated DI thesis. An increasing or decreasing trend in an indicator counts towards its achievement depending on whether a lower or higher number is considered better. Indicators will vary per investment depending on the DI thesis, relative importance and data availability. Indicators were also compared with market or competitor benchmarks where applicable and where data was available.
FIF fund performance is determined based on a simple average of the scores of the underlying investments with respect to their contributions to achieving the funds DI thesis. An illustrative example is shown on the next page.
Table 2: Fund performance example
| Investee | Performance against DI thesis | Assigned/average score |
|---|---|---|
| Investment A | Outperforming | 4 |
| Investment B | On track | 3 |
| Investment C | Marginally underperformed | 2 |
| Investment D | Significantly underperformed | 1 |
| Investment E | Unclear | NA |
| Overall Fund | On track | 2.5 (rounded to the nearest integer) |
The figure below showcases the performance of funds and investments against their respective DI thesis. Debt funds have been treated as single investments.
Figure 7: Overall performance against DI thesis
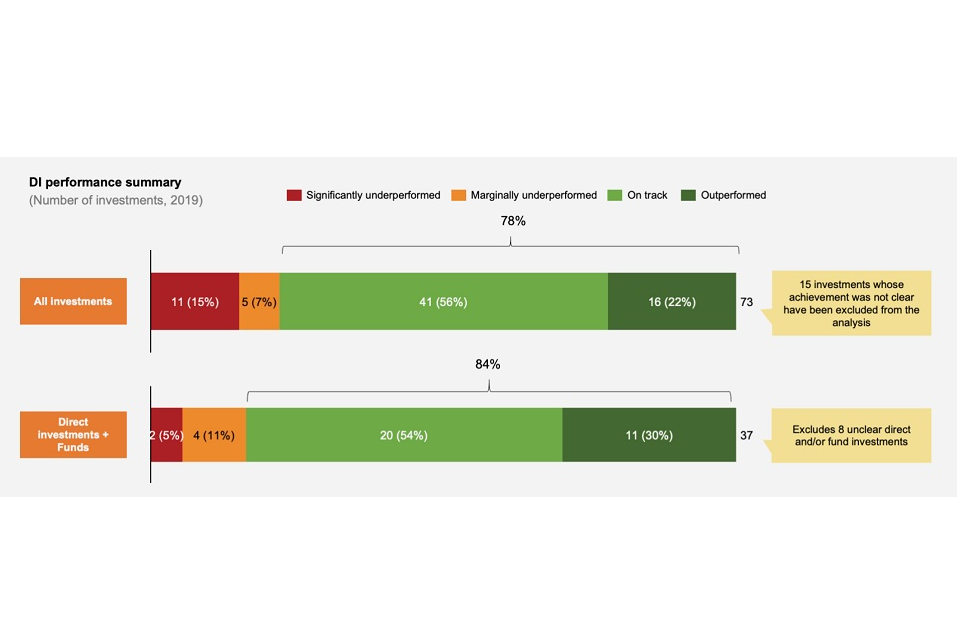
Note: All investments - this treats every investment on a standalone basis. Direct investments + funds - this treats fund investments as an average of the underlying investments it holds. This explains the difference between 84% and 78%.
From an individual investment perspective, CDC’s investments have done well with 78% of the portfolio having outperformed or on track (22% plus 56% above) to achieving the DI thesis across all relevant indicators.
When collectively looking at direct investments, MRPAs, debt funds and FIF funds (treating funds as individual investments that are scored based on an average of their underlying investee scores), 84% of CDC’s investments are either on track or outperforming (30% plus 54%). The remaining 16% are underperforming. This 84% is higher than 78% as underlying investments within a fund are aggregated to calculate the average score of a fund.
A breakdown of the portfolio-level performance through different perspectives is presented below, which aims to unpack any initial lessons.
Outperforming and ‘on track’ Investments
Figure 8: Analysis of outperforming and ‘on track’ investments
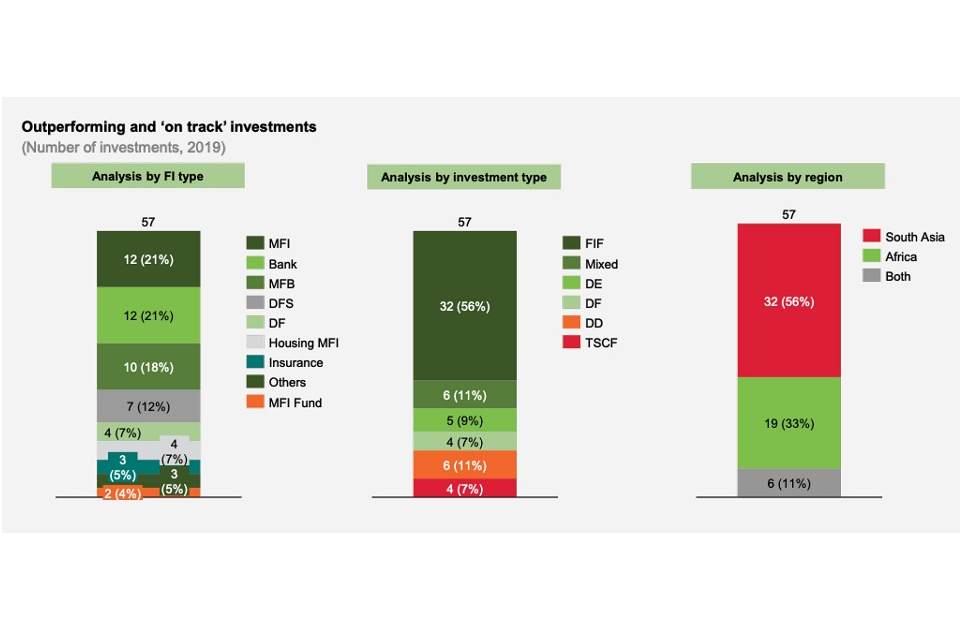
From an FI lens, microfinance institutions (MFI/MFB/MFI holding companies) have accounted for 43% of this category and commercial banks making up 21%.
Based on a product perspective, direct investments accounted for 31% of the number of investments[footnote 46] in this category (includes mixed investments, direct equity and direct debt). FIF fund investments made up 56% of this category. However, this reflects the fact that FIF fund investments make up the majority of the portfolio. From a regional perspective, South Asia made up 56% of the number of investments in this category with Africa making up 33%. Approximately 20% of the number of South Asian investments outperformed with 18% of African investments having done the same.
It is worth noting that 18 out of 24 direct investments fell within the category of ‘on-track investments’, accounting for 75% of all direct investments, while 59% of FIF fund investments fell within this category, with the equivalent proportions for debt funds and MRPAs at 75% and 57% respectively. This implies that overall, direct investments and debt funds have performed the best from a product perspective.
It is useful to note that 12 out of the 54 FI focused fund investments in this category exhibited some divergence between the achievement of DI and financial performance. While these investments are having an impact, their future survival and DI could be negatively affected.
‘Underperforming’ Investments[footnote 47]
Figure 9: Analysis of underperforming investments
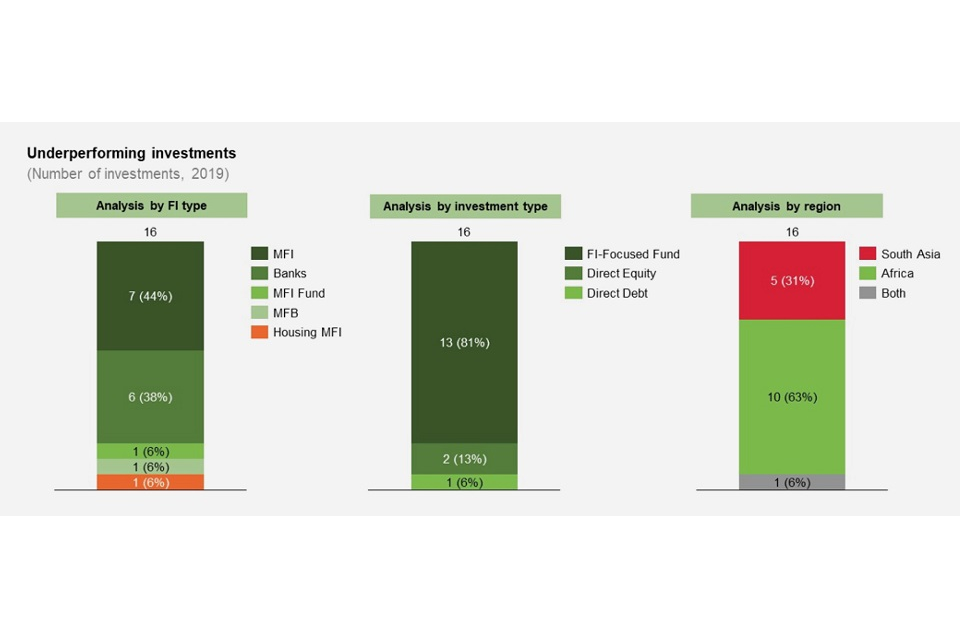
From an FI perspective and product perspective, MFIs and banks make up this entire category of underperforming investments, while FIF fund investments accounted for 81% of all the underperforming investments. However, this is largely driven by the portfolio structure of the FIF funds that primarily consists of banks and MFIs.
African investments made up 63% of this category – this may be a consequence of the fact that African economies are relatively more fragmented (simply due to their number) and less developed, and so African FIs are more susceptible to macroeconomic and operational risks. 14% of direct investments were underperforming, with 24% of FIF fund investments underperforming. The main reasons for poor performance within this investment category are detailed in Table 3 below. While 8 out of the 16 underperforming investments reviewed were loss making, it is not possible to conclusively say if there is a correlation between losses and relatively low DI. On the other hand, as noted above, 12 of the 54 outperforming FIF funds’ investees were also loss making. Three funds fall within this category, where 2 out of the 3 funds are Africa focused.
Table 3: Drivers of DI thesis achievement underperformance*
| Main factor driving poor performance | Number of investments |
|---|---|
| Operational/strategic factors | 7 |
| Macroeconomic factors | 4 |
| Business integrity factors | 3 |
| Regulatory factors | 2 |
Table 3: *[footnote 48]
Note: Operational/strategic factors have been used as a catch-all (general) category. Further analysis would be needed to conclude on the precise factors for poor performance within these FIs.
Half of the institutions underperformed as a result of operational inefficiency resulting mainly from a decline in loan asset quality that could be caused by serving underserved/relatively high-risk customers. However, based on the information at hand, this was not possible to verify. Four investments were adversely affected by macroeconomic factors within their respective countries, with 3 investments being adversely affected by business integrity failures[footnote 49]
Box 1: Understanding the impact of regulatory and macroeconomic factors on the performance of FIs
Aside from business integrity and operational issues, these factors were the main drivers for underperformance. This box explains how some of the main macroeconomic and regulatory factors impacted the performance of the FIs.
Interest rate caps in Kenya – 2016 In September 2016, the Government of Kenya passed a bill that capped interest rates chargeable by banks (excludes all other FIs) at no more than 4% above the base rate set by the Central Bank of Kenya (CBK). The cap was intended to address low affordability and availability of credit to working people and small businesses. While the cap lowered the cost of credit, it also encouraged banks to invest in government securities instead of lending to enterprises and consumers. The cap had a dampening impact on private sector credit growth as banks were unwilling to lend to relatively riskier segments at lower interest rates. The impact of the cap tended to affect smaller banks to a larger extent, as they pay a higher premium to source deposits and therefore need to lend at higher rates. Smaller banks faced the challenge of reduced, and in some cases negative, interest margins. The cap was repealed in September 2019. During the period the cap was in effect, banks became more cautious in their approach to lending.
Demonetisation in India - 2016 In 2016, India went through a demonetisation process that sought to replace the 500 and 1,000 rupee notes in an effort to flush out untaxed wealth. Based on the Reserve Bank of India’s (RBI’s) 2016 annual report 99.3% of the currency in circulation was returned to the RBI. The effects of the demonetisation were felt particularly by the MFI sector, which traditionally makes and receives payments in cash. The instalments on microfinance loans are collected on a weekly, fortnightly or monthly basis in small denominations. As small-cash denominations were unavailable following the demonetisation, borrowers were not in a position to service their loans, collections were delayed and dropped away, and MFI experienced an increase in non-performing loans (NPLs). While the demonetisation impacted most MFIs in India in 2017, most of them recovered soon after. Some MFIs were impacted more than others, driven by their respective regional, product and segment exposures. Overall, most MFIs in which CDC has invested are still on track to meet their DI thesis, as their financials were only impacted for a period of one year.
Andhra Pradesh crisis in India - 2010
The MFI sector in India was significantly affected by the Andhra Pradesh (AP) crisis of 2010. In 2010, at least a third of the 30 million households using some form of credit in India originated from AP. Reports of abusive practices by intermediary agents of private MFIs started making the news before any action was taken, initially in the vernacular press and subsequently the national media. Suicides in AP are often determined by agrarian trends and are unfortunately common. However, in this case over 70 suicides were alleged to be linked to people’s inability to repay MFIs. The state government cited these suicides as the basis for intervening to protect citizens from the unethical practices of private MFIs. The AP Microfinance Institutions (Regulation of Money Lending) Ordinance, 2010 was promulgated with effect from 15 October 2010 to address the MFIs’ coercive recovery practices. In the immediate aftermath of the ordinance, lending and recovery came to a halt. Politicians encouraged people not to pay back the MFIs. As a result, MFI collection rates fell dramatically (collection rates for organisations based in AP fell from 99% to 20%), and those clients who did not repay their loans became ineligible for future loans. Several MFIs that did not receive funding to restart operations ended up failing and exiting the market.
‘Unclear’ Investments There were 15 investments in this category; 9 investments were made in 2018 or later – their impact cannot be ascertained from the short investment horizon. Of the remaining investments, 3 investments were not aligned to the fund DI thesis and 3 investments were either exited in the same year of investment or due to insufficient data.
Note on performance While the majority (78%) of the overall portfolio is on track or has outperformed with respect to the DI thesis, it should be noted that this high performance is partly driven by a low hurdle prior to 2017 to measuring DI, i.e. some investments have relatively easier DI thesis to attain. Therefore, section 5 of this evaluation undertakes a thematic evaluation of performance to draw out weaknesses and potential areas for improvement when looking at DI. Therefore, any divergence of performance shown here and in section 5 of this evaluation is driven by the approach to looking at DI. Section 5 of this evaluation homes in on the areas for improvement, i.e. for those investments that are on track but not outperforming, e.g. investments that have grown their overall lending but have not managed to increase lending to specific segments and so on.
Trends in key CDC corporate, FI portfolio sector and development indicators
This section analyses CDC’s investment performance against key indicators to assess the extent to which FIs are delivering impact along CDC’s FI impact framework and against CDC’s development impact indicators. The key indicators under review are the following: total loans and advances, taxes, employees, female employees and the number of customers.
It should be noted that the results below look at the performance of the portfolio as a whole, rather than attributing performance to CDC. Currently within CDC there are efforts to begin applying an attribution approach whereby CDC’s impact can be estimated from the total portfolio impact. However, these methods are yet to be developed further for them to be applied. Attribution is an important approach to measuring impact as it allows one to strip out CDC’s role clearly. Further applications and enhancement of impact measurement methodologies within CDC would support the accurate measurement of impact going forward and should be actively pursued by CDC.
Total loans and advances
This sub-section analyses loan data of credit-providing institutions within the portfolio; 59 such investments from the portfolio were identified, with the remainder consisting of payment companies, TF investments, other non-lending companies and investments made in 2019 or later. The evolution of loans and advances in these institutions is highlighted below. This analysis is important as it provides an indication of how CDC’s funding has contributed to the growth of these FIs. In general, banks would be expected to grow even without any intervention on the part of CDC in line with GDP and therefore the analysis compares loan growth with GDP growth as a benchmark for success.
Figure 10: Portfolio total loans and advances outstanding*
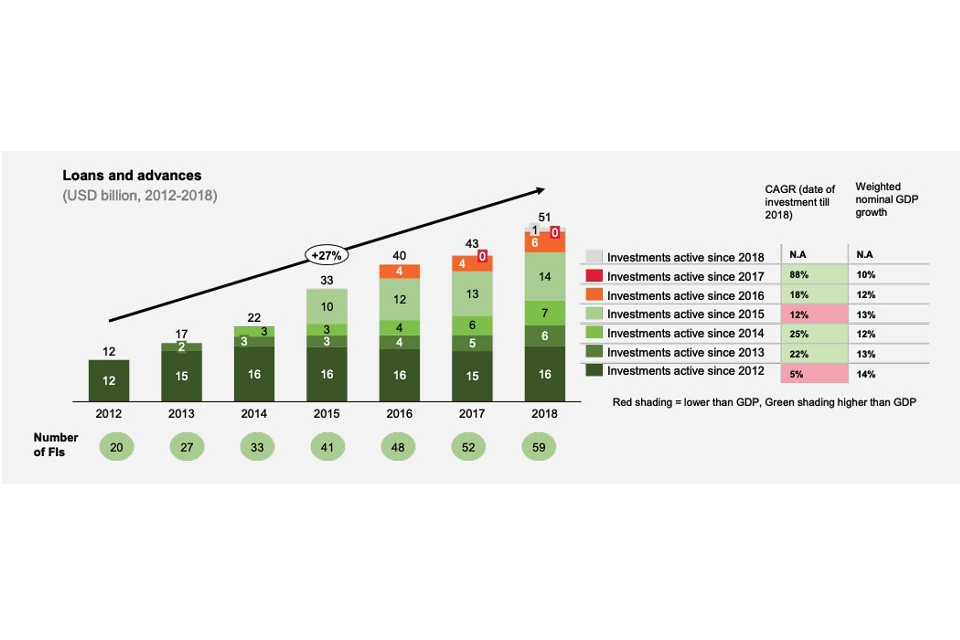
Figure 10: *[footnote 50]
Note: Weighted nominal GDP growth calculated based on countries of all the investments assessed in this analysis
Overall, the portfolio has grown at a compound annual growth rate (CAGR) of 27% from 2012 to 2018. Based on an organic growth analysis, the portfolio has in 4 out of 6 years grown faster than nominal GDP, implying that the sample analysed here has exceeded market growth on average. The subpar growth of 2012 and 2015 investments is largely driven by one indirect equity investment in a bank where growth has been marginally negative over this period and one direct bank investment which also experienced negative growth since 2015. The superior growth (albeit off a low base) of the investments made in 2017 is as a result of a housing MFI and a non-bank SME lender, both in India.
Notably, banks account for the largest portion of loans over the 2012-2018 period, accounting for 76% of loans as a consequence of their scale, despite being considerably fewer in number than MFIs.
Additionally, FIF fund investments have had the largest loan portfolios, as fund managers are able to invest in multiple large and small institutions.
It is worth noting that Africa has made up 58% of total loans. This is a consequence of the fact that African banks account for more than 80% of the number of investments in commercial banks within the portfolio.
Customers
Fifty six investments provided customer data over the analysis period. The remaining investments within the portfolio consisted primarily of non-listed investments that did not provide this data and/or were recent investments.
Figure 11: Total number of customers, 2012-2018
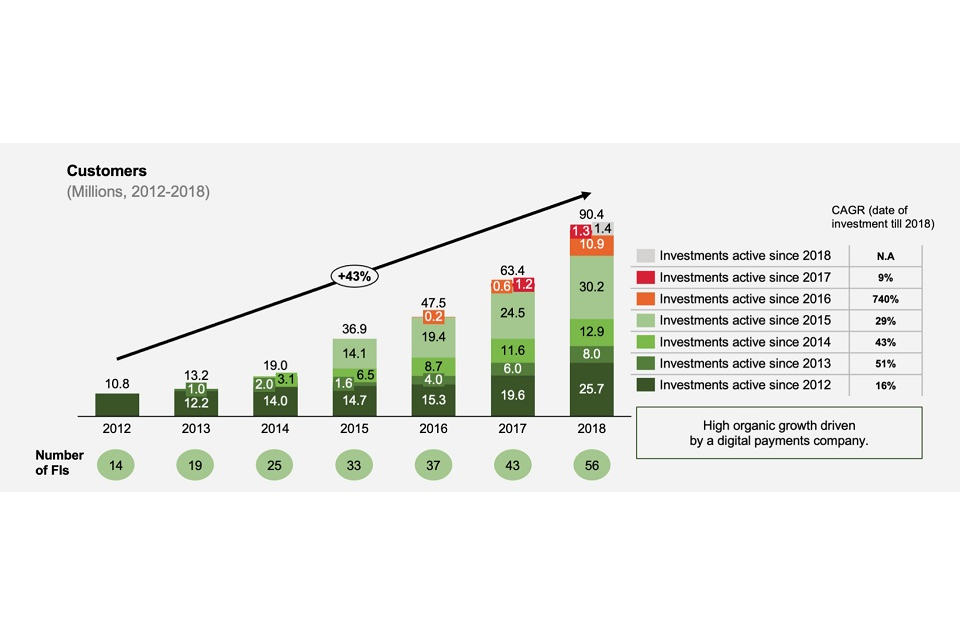
The total number of customers has grown at a CAGR of 43% from 2012 to 2018. While the primary focus of the DI theses is on growing the number of borrowers, it should be noted that customers include both borrowers and depositors for deposit-taking institutions. Given data limitations, it was not possible to separately show borrowers and depositors growth, and it is quite likely that these trends may differ from the overall trends in customer growth as shown above.
Banks accounted for 42% of total FI customers as of 2018. It is worth noting that despite making up a small percentage of the portfolio, 2 DFS institutions were able to reach 21 million customers in 2018 compared with 12 MFIs/MFI funds that reached 24 million customers. This is a consequence of mobile technology use, which has enabled the institutions to scale considerably.
FIF fund investments accounted for 64% of customers in 2018, likely attributable to the fact that FIF fund investments made up a greater proportion of total investments than direct investments. From a regional perspective, South Asian institutions accounted for 51% of total customers, with Africa making up 46%.
Overall and female employment
Out of the 88 investments reviewed, 54 investments provided year-on-year direct employment data over the analysis period. The remaining investments did not report on this data or were investments made post 2018.
Figure 12: Total number of employees
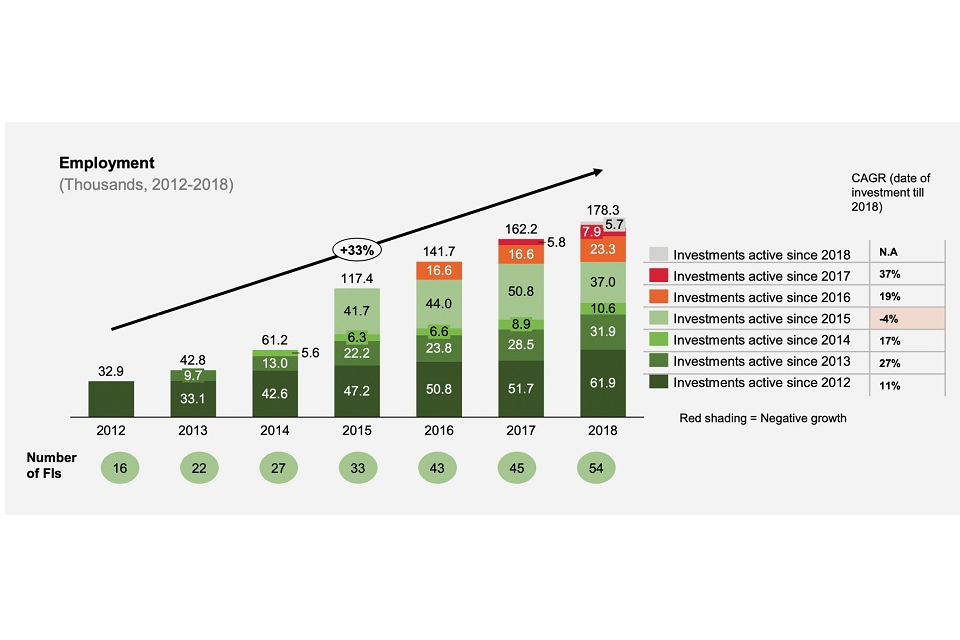
Notably, total employment has grown at a CAGR of 33% from 2012 to 2018, with the addition of relatively large institutions contributing to the overall growth. Investments made in 2015 saw a drop in 2018 employment numbers driven by missing data for some investments.
From an FI perspective, MFIs/MFBs accounted for approximately 62% of total employees (direct employment) as of 2018, with banks accounting for 29%. This may be a consequence of the extensive branch network of microfinance institutions.
From an investment type basis, direct investments and FIF funds contributed nearly equally to total employees, with FIF fund investments accounting for 45% to direct investments’ 55%.
South Asian institutions’ employees made up 73% of total employees in 2018. This is possibly a consequence of the relatively larger scale of the South Asian institutions. It should be noted that out of the 54 investments for which data was available, 35 were in South Asian.
The average proportion of female employees to male employees for those FIs that did provide data ranged from 21% to 30% from 2012-2018, which is evidence that female employees are significantly underrepresented.
Taxes
This sub-section analyses the evolution of taxes paid by FIs within the portfolio; 55 out of 88 investments reviewed provided tax data for the analysis period. The evolution of taxes paid is highlighted below.
Figure 13: Total taxes paid
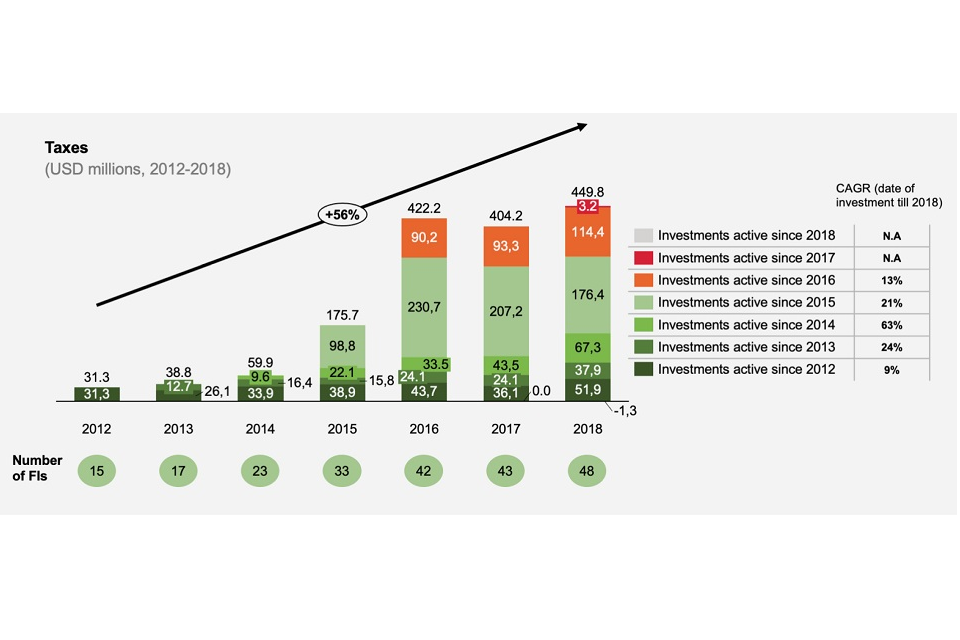
Overall, there has been strong growth in taxes paid by FIs over the analysis period. 2016 growth is driven by the addition of relatively larger profitable institutions.
The slight dip in 2017 was a result of multiple factors. Firstly, relatively large institutions within the portfolio experienced a decline in profitability. Additionally, some of the MFIs invested in India transitioned to MFBs in 2017 and did not pay taxes during their first year in operation as an SFB.
Banks made up 73% of the total taxes paid, when comparing with other FIs in the portfolio. This is largely expected due to the scale of the banks’ operations. Some FIs received net tax credits over the analysis period. The 2 main reasons behind this are the unprofitability of these institutions and significant deferred tax benefits due to previous loss-making years.
Direct investments accounted for 77% of taxes paid within the portfolio and South Asian FIs made up 70%. This is a result of the relatively larger size of the South Asian financial intermediaries in which CDC is invested.
Summary of overall portfolio impact
Summary of the portfolio against the DI thesis
- fifty seven (of 73 investments) of CDC’s investments are on track or outperforming against their DI thesis as measured against the sample reviewed
- of the 10 FIF funds reviewed, 6 are on track to achieving their DI thesis, 3 are marginally underperforming, and one could not be assessed. Of the 5 debt funds, 4 are on track, with the impact of the remaining debt fund being undiscernible
- MFIs and MFBs in South Asia have done particularly well against their DI thesis
- most of the underperforming investments are in Africa and consist of both commercial banks and MFIs. Through an in-depth study, it would be worth exploring how these FIs in Africa are performing against their peers from a financial and impact perspective and the extent to which impact and financial sustainability are related
- underperformance has been driven by a mix of operational, macroeconomic, business integrity and regulatory issues (presented in the order of the largest contributing factor).
Areas for further research
- further analysis is required on the types of customers and borrowers being reached across the portfolio to understand impact (e.g. segregated by borrowers and lenders, income levels, employment status, living standards and so on)
- further information on banking portfolio data, segmented using a consistent definition of customer segments, is required to understand the type of customers being reached
- further information on gender metrics, such as employment, quality of female employment and other metrics, is required to understand impact from the gender lens
- further information on how CDC’s funding is being utilised by the FIs would be useful in understanding impact from an attribution perspective
- it would be useful to understand the relationship between financial sustainability and DI across the entire portfolio
- it would be useful to understand which investments are better at delivering impact, e.g. South Asian banks versus African banks
Portfolio and evidence thematic evaluation
The portfolio evaluation is presented across 7 themes to analyse the impact of the investments from different perspectives and enabling the identification of strengths and weaknesses of the investees in achieving the intended outcomes that would be otherwise overlooked.
The themes analysed include:
-
Geography – Aims to examine whether CDC is reaching these markets and taking a strategic approach to geographical exposure in line with the DI grid.
-
Reaching underserved households and the scaling of MFIs – Explores to what extent CDC has been successful at reaching underserved segments and CDC’s role in scaling MFIs that are supporting these segments in line with the FI impact framework.
-
Providing appropriate capital to SMEs – Assesses whether CDC’s investees have supported SMEs and which form of capital is the most appropriate to reach SMEs.
-
Financial market liquidity – To ascertain the impact that CDC’s investments are having in solving the liquidity challenges in developing markets and the most appropriate type of liquidity instrument to utilise.
-
Developing capital markets – According to CDC’s FI sector strategy, a core focus of CDC going forward is on market-based intermediation (building capital markets) and therefore it is important to assess to what extent CDC has been able to play this role in the past.
-
MRPAs and counter-cyclical finance – These products form a portion of CDC’s total commitments to the financial sector and therefore it is imperative to understand how they contribute to impact within the financial sector. Counter-cyclical finance has also been cited as a key strategy that CDC deploys and therefore this analysis aims to understand the impact of this form of support.
-
Gender – As part of a holistic development approach, CDC has a core focus on gender inclusivity across its investments. Therefore, it is important to assess CDC’s investments based on the types of customers they are reaching from a gender perspective.
The relevant evidence available for each theme is discussed in boxes at the end of each sub-section. A final sub-section indicates the evidence available for the outcomes and ultimate impact portion of the CDC FI impact framework. This level of data is not available for CDC’s portfolio and therefore has not been analysed in the portfolio evaluation.
Geography
The analysis here aims to provide an overview on whether CDC’s investments are reaching the target countries as per the DI grid.
Figure 14: CDC’s priority countries and allocation of investments across these countries
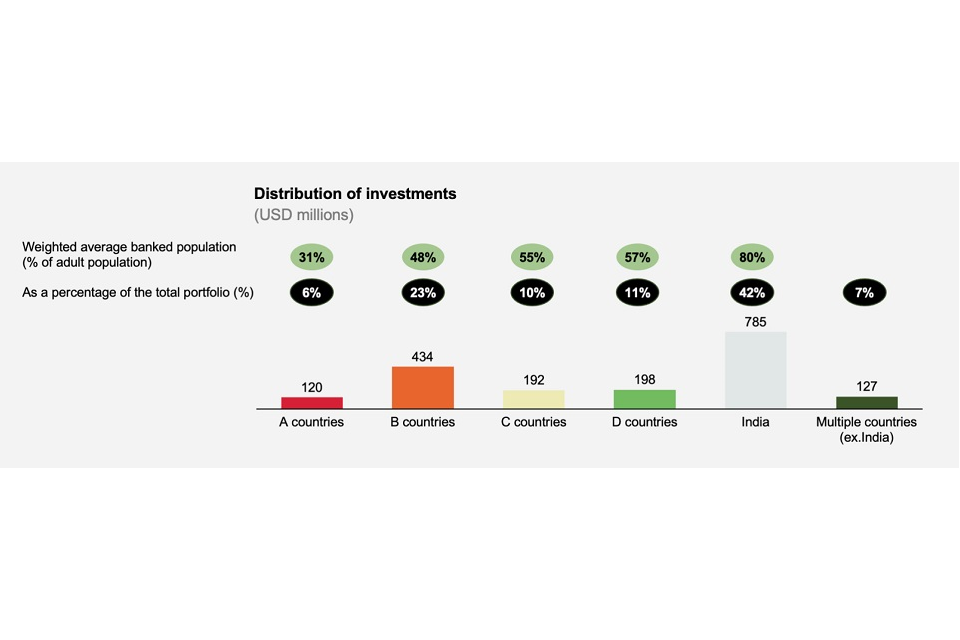
Notes: ‘A’ = highest and ‘D’ = lowest priority. India is sub-divided into various states of differing priorities. Debt Fund commitment amounts are allocated based on the latest portfolio exposure from fund manager reports. Funded MRPAs reported based on utilisation and unfunded MRPAs adjusted for both utilisation and a capital charge of 10%. BMCE Morocco allocated based on loan exposure per country.[footnote 51] Since 2018 Nigeria is classified as a ‘B’ state and Kenya as a ‘C’ state. Investments have been allocated according to the prevailing DI grid at the time of investment.
Based on the distribution of the investments the following is worth noting:
- ‘A’ countries: A total of USD 120 million of investments and commitments are directed towards these countries
- ‘B’ countries: A total of USD 434 million of investments and commitments are directed towards these countries TF and direct equity dominate in reaching ‘B’ countries
- ‘C’ countries: A total of USD 192 million of investments and commitments are directed towards these countries, of which 58% is accounted for by generalist funds
- ‘D’ countries: A total of USD 198 million of investments and commitments are directed towards these countries. About 78% of this is to BMCE Morocco. The rest is through funds
- India: A total of USD 785 million of investments and commitments are directed towards India. Direct investments account for USD 681 million (87%) across 11 FIs. The remaining 13% is through funds across 43 FIs. Based on a review of CDC’s priority states, about 60% of branches of the invested FIs fall in ‘C’ and ‘D’ states, and ‘A’ and ‘B’ states account for 37%
- Multiple countries: These account for USD 127 million. These investments are largely through funds and are regional FIs, and at times regional exposures are not available. It is noted that there is some, albeit low, exposure to ‘A’ countries through these investments.
Based on a geographical analysis the following findings emerge:
- ‘A’ countries are largely being served by direct equity, generalist funds, and TF. Overall support to these countries remains low
- There is a high concentration on Pakistan and Kenya. Lusophone and Francophone Africa are relatively underserved
- In India, FI branches are largely concentrated in ‘A’ and ‘D’ states. According to the DI grid (2013-2017), only 4 states were classified as ‘B’ states, and the updated grid post 2017 contained only 2 ‘B’ states – which is an explanation for the low penetration in ‘B’ states. Further analysis would need to be conducted to understand the overlap between FIs in the same states and regions
- Nigeria and Bangladesh are relatively overserved with TF products
- As expected, funds are able to provide exposure to a large number of FIs across many countries
- Overall, it is not clear if there is a holistic strategy adopted by CDC in terms of geography. Based on the material analysed there are no explicit investment allocations per priority country or state
Box 2: Evidence related to geography
Evidence review questions aligned to theme: All questions
Main points arising from the evidence related to theme
Geography was an inclusion criterion for the evidence review. Studies relevant to the evaluation questions conducted in Africa, Asia, or developing countries were included. The evidence is considerable and disaggregates easily between Africa and Asia for the components of the CDC FI impact framework related to ultimate impact. However, the evidence becomes less comprehensive per geography for the remainder of the research questions associated with the CDC FI impact framework. The evidence cannot be generalised across geographic regions for the portion of the CDC FI impact framework associated with inputs, investments, and impact pathways.
Reaching underserved households and the scaling of MFIs
This theme aims to understand the extent to which CDC’s investments are reaching underserved segments across the various FI types, products and regions. This theme provides some insights on the extent to which household well-being is being positively impacted. The second half of this section focuses on the role that CDC has played in scaling MFIs to reach more underserved segments or customers.
Reaching underserved segments
Overview of lending across the portfolio
From the FI portfolio, 47 out of 88 investments were identified to have a clear offering and/or reported on loan data to underserved segments. This consisted of 17 MFIs, 11 MFBs, 5 commercial banks, 5 debt funds, 5 housing MFIs and 3 MFI funds. It should be noted that there may be other investments within the portfolio that may support underserved segments, but this was not the core of their DI thesis or directly observable. CDC’s total exposure to these FIs amounted to approximately USD 980 million. When interpreting the information, it should be pointed out that no universal definition of ‘underserved segments’ exists; the data presented here is subjected to segmentation biases of the various FIs reporting the information. The evolution of loans to underserved segments is depicted below.
Figure 15: Loans and advances to underserved segments
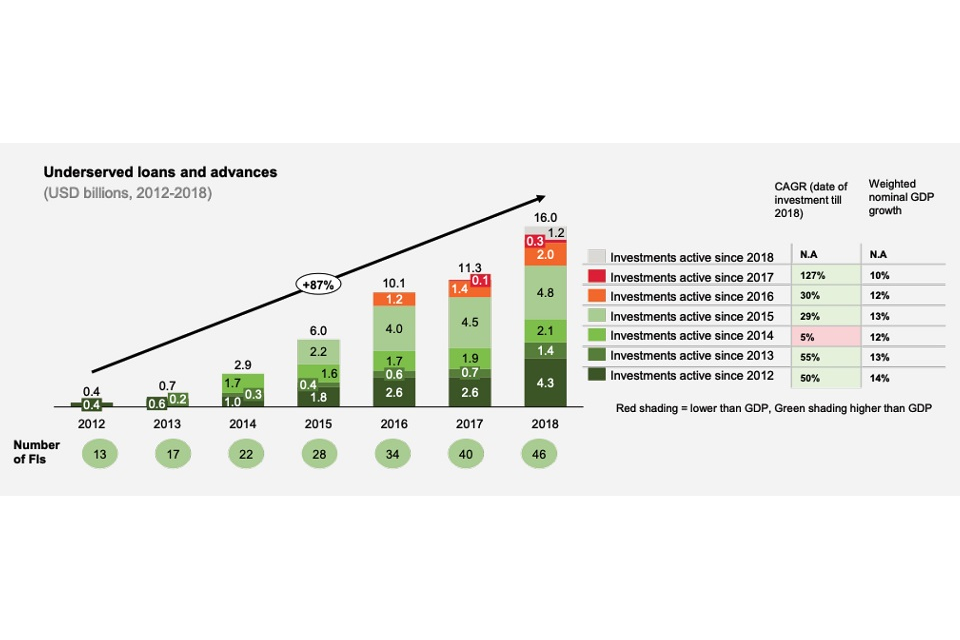
Note: This figure also features in section 4. One investment is excluded from this graph as this graph considers loans outstanding while the excluded investment data is based on loans disbursed.
The portfolio has grown at a CAGR of 87% from USD 0.4 billion in 2012 to USD 16 billion in 2018. It should be pointed out that the addition of relatively large institutions over the analysis period have significantly contributed to overall growth. Generally, the majority of the FIs have been able to scale their portfolios healthily.
A deeper analysis reveals that most MFI lending is to underserved segments. Banks in South Asia relative to Africa dedicate a higher portion of their total books to underserved lending. Further analysis would be needed to understand why this is the case. Finally, debt funds have been largely successful in reaching underserved segments.
Investments that identified ‘loans to underserved customer segments’ as part of their DI theses This section analyses the relative growth of loans to underserved segments in institutions that included underserved customer segments as a key aspect of their development thesis. From the portfolio, 30 investments were identified under such a DI thesis and provided data on their lending to this segment.
The following figure exhibits how lending to these segment compares with total loans outstanding from the first year of investment to the latest available data.
Figure 16: Loans outstanding - selected FIs
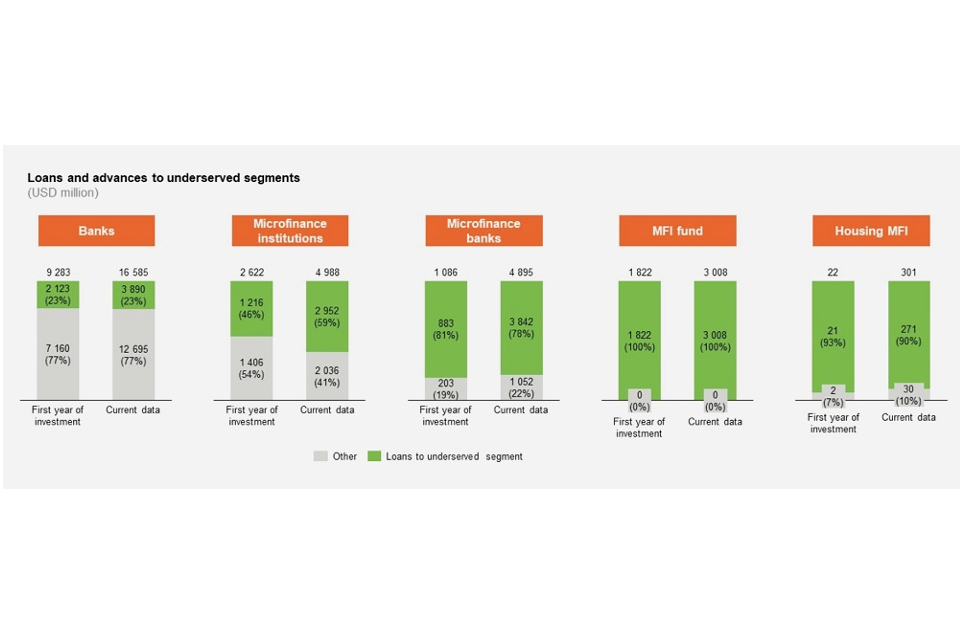
Note: The inclusion of a diversified lender in the MFI chart skews the share of underserved loans for MFIs, making the share appear lower than it is.
Apart from MFIs, all other types of FIs have either maintained or experienced a slight decline in the proportion of loans to underserved segments. The figure analyses loans to underserved segments in relative terms. It is worth noting that, as measured in absolute dollar terms, the combined loans to underserved segments for all these FIs have increased substantially.
The sample of commercial banks did not expand their exposure to underserved market segments; this may reflect their credit risk management systems that limit how much credit they are able to extend to this customer segment. Additionally, these banks have also exhibited growth in other segment portfolios. MFIs have increased the proportion of their lending to underserved segments from 46% in the first year of investment to 59% in the latest year of available data. MFBs, have recorded a slight decrease from 81% to 78%. However, MFBs still have an overwhelming majority of their loan book committed to this customer segment. Housing MFIs exhibited the same trend as MFBs with this ratio declining slightly from 93% to 90%. Finally, as a consequence of the business model of the underlying MFIs, 100% of loans under MFI holding companies were attributable to underserved customer segments.
Based on the analysis of loans to underserved segments, the following lessons emerge:
- there is a need to review investments in FIs in Africa to ascertain whether a greater focus could be placed on reaching underserved segments
- South Asian MFIs have managed to reach more customers and disburse more loans, which is driven by CDC’s overwhelming number of MFI investments in South Asia. There is an opportunity to reconsider a) whether the extent to which MFIs deliver services to the underserved segment is as a result of CDC’s investment and influence on the MFI; b) whether the CDC can target fewer FIs that would be able to reach underserved segments more efficiently; and c) the extent to which CDC can encourage MFIs already fully committed to serving the underserved segment to do more of the same
- there is a need to have a standard definition of ‘underserved segments’ across the portfolio so as to clearly analyse how these FIs have been able to serve these segments and to enable impact comparisons across the portfolio. More specificity/clearer definitions of the underserved segments in the DI thesis would allow for better impact analysis
Commercialisation and scale of MFIs
To assess how CDC’s investments have supported the commercialisation and scaling of MFIs to support more underserved customers, an analysis of key indicators was conducted across 36 investments that were identified as relevant for this investment theme and/or had a component of this in their DI thesis. Of these, 3 are multi-continent MFI holding companies (MFI funds), 7 institutions went on to become small- finance banks (SFBs), 22 are MFIs, and 4 investments were written off.
SFBs in India
CDC invested in several MFIs that then became some of the first institutions to be licensed as SFBs in 2017. The figure below illustrates the SFBs’ growth across key metrics post CDC’s investment.
Figure 17: Combined growth of the 7 SFBs
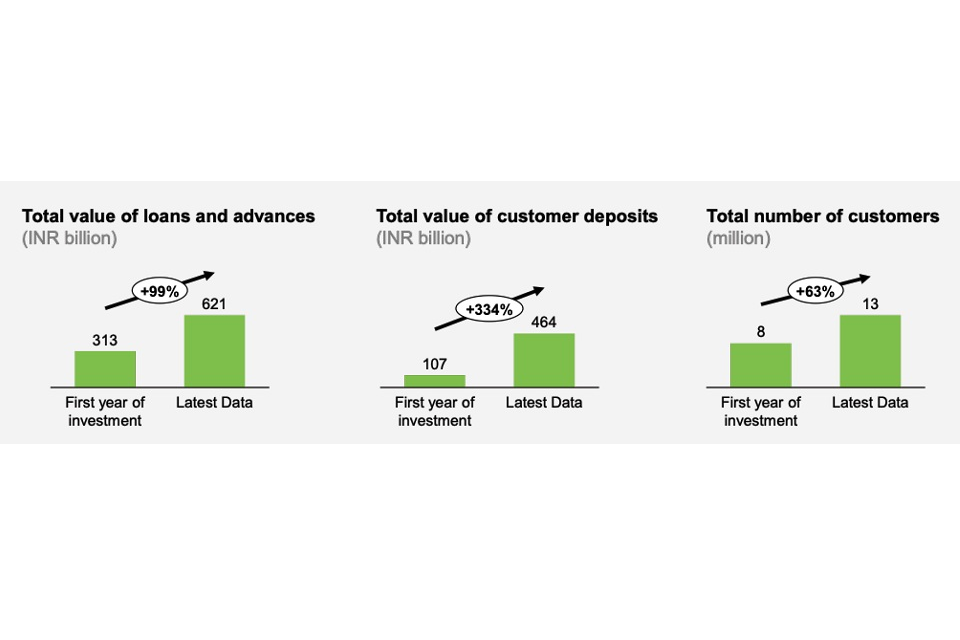
Source: Data available from public annual reports of the SFBs
From an impact perspective, CDC’s role in scaling MFIs in India has largely been successful, resulting in high customer and loan growth and supporting these organisations to become self-sufficient through raising their own deposits. It is also interesting to note that post licensing, 4 out of 7 of CDC’s SFBs grew faster than the market in terms of loans (market CAGR, 103%). The exceptions were Janalakshmi, Equitas and Ujjivan.[footnote 52]
CDC took a deliberate role to invest in these large MFIs.[footnote 53] Post the AP crisis, it was a good time to invest given the various reforms in the sector. The main issue with MFIs was that they lacked experience in liability management, as this was an area of business completely unknown to MFIs (which were non-deposit-taking institutions reliant on wholesale funding). MFIs faced significant maturity mismatch risks in transitioning to SFBs. Through CDC’s direct equity investments, it managed to attain a board seat in these SFBs and provided various forms of TA to enhance and support these SFBs to scale.
While CDC did have less influence through its debt investments in other SFBs, it still played an important role in providing relatively long-term (7 to 8 years) Tier 2 capital, which was scarce in the market. Through these investments, some SFBs were able to withstand the various macro shocks such as the demonetisation of the Indian currency and now the COVID-19 crisis. A major hurdle to CDC’s replication of this SFB scaling strategy was being able to attract talent from urban to rural areas where most of these SFBs are located.
MFIs in Africa
Across Africa, the MFI lending model has been relatively unsuccessful. According to mix-market data,[footnote 54] portfolio at risk (PAR) and the cost of serving individual borrowers are the second highest across all continents, partly explained by the fact that the number of borrowers per MFI is the second lowest. The relative inefficiency of the MFI sector in Africa can be attributed to many factors.[footnote 55] In recent years, an important factor has been the emergence of mobile money and mobile lending that have severely impinged upon the MFI business model.
Figure 18: MFIs performance in Africa*
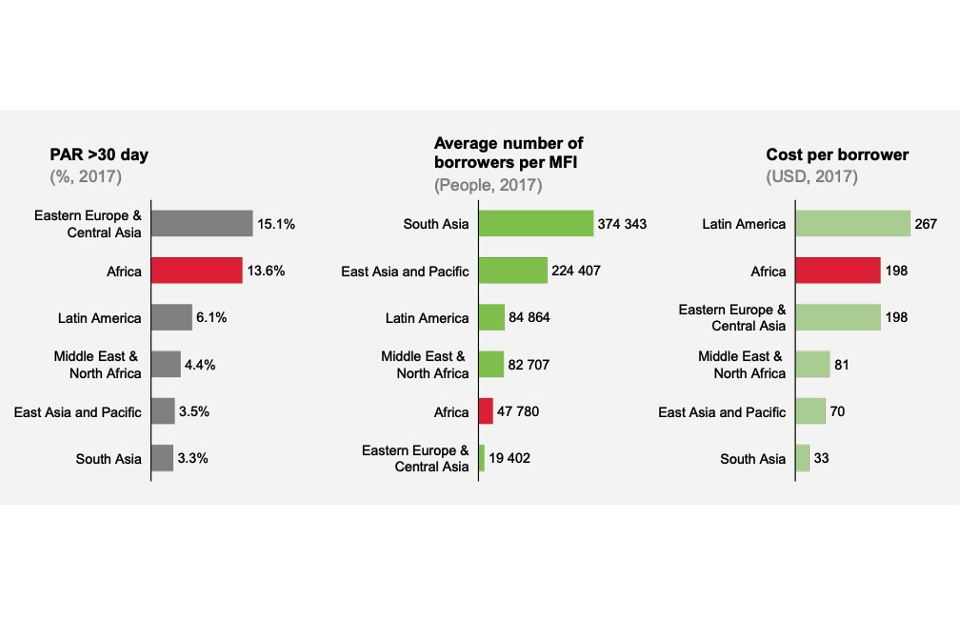
Figure 18: *[footnote 56]
Most of CDC’s MFI portfolio is in India, with only 6 main MFI investments in Africa.[footnote 57] The investments in African MFIs have been entirely through funds.
The performance of CDC’s MFIs is not very different from the mix-market data provided above. With the exception of one investment, CDC’s MFI investments in Africa have not achieved their developmental impact, with their loans and customers growing relatively slowly and PAR increasing. The single MFI has been an outlier in terms of performance, partly driven by a high-level integration of technology in its lending processes. The FI has a scalable business model that focuses on enterprise lending. This successful MFI uses a cash-flow-based lending model that assesses the ability and willingness to repay for microbusinesses.
Some of the poor investment performance of the MFI investments can be traced back to the fund that invested in them. Some of these issues included:
- the fund invested relatively small amounts in many FIs across many markets, making execution difficult
- the fund suffered a key person event (one of the founders left the fund), which impacted the sustainability and strategy of the fund
- the fund had a weak strategy and implementation
Overall, the scaling of MFIs in Africa has not been achieved, and making investments in MFIs with scalable impact would also appear challenging going forward.
Multi-continent MFI holding companies
Cross-continent MFI holding companies invest in a network of MFIs in developing markets to reach underserved segments. Two out of the 3 investments in this category have been largely successful at scaling greenfield investments in microfinance, while the third investment has had less than optimal performance. The primary objectives of these funds were to roll out replicable, low-cost (through achieving scale) MFIs across several countries.
A common theme across all these investments is that most of their African operations remain modest and some are struggling to reach scale and profitability.
Based on the review of scaling MFIs, the following key lessons emerge:
- Indian MFIs have performed relatively well for various reasons. While there may be lessons to be learnt, it is not entirely clear that these could be replicated in Africa, given the relatively limited scale of African financial markets and different social, cultural, economic, demographic, technological and regulatory factors at play
- on average, African MFIs have not performed well against their DI theses. MFIs that have managed to digitise and adopt a differentiated lending model have thrived. Digital microfinance/fintechs appear to have been more successful than traditional MFI models at scaling
- MFI holding companies do offer lessons for scaling. These FIs have managed to be successful through greenfield investments, although it should be noted that most of the successes have been driven by MFIs outside of Africa. Most of the African MFI subsidiaries still remain relatively small and marginally profitable. It should be noted that these funds were set up over a decade ago and their growth has proven to be relatively low over this time period
- it is not clear if the MFI sub-sector strategy in Africa and India was to support the entire sub-sector or whether to invest in a selected few ‘demo’ investments that the market could then replicate. Given CDC’s role as a catalytic investor, it would seem that CDC’s investments were largely intended as innovations to be replicated by the private sector. Going forward, such considerations could be important when considering whether to undertake multiple similar investments within one sub-sector
Box 3: Evidence related to reaching underserved households and scaling MFIs
Evidence review questions aligned to theme: Questions 1, 2, 3, 4, 5, 6 and 7
Main points arising from the evidence related to theme
There are a compelling number of high-quality studies that investigate the relationship between financial inclusion and poverty alleviation. The evidence regarding financial inclusion focuses on MFIs and the provision of credit to underserved households and firms. This evidence indicates that credit used for consumption smoothing does not support movement out of poverty in the long term, although it supports well-being by helping reduce the impact of negative shocks. Since a large share of finance in impoverished communities is used for consumption smoothing, the direction of evidence as regards poverty alleviation is inconclusive. However, access to finance can be linked to poverty alleviation if the following conditions hold:
- the finance provided is sufficient to support investment in longer-term initiatives for the firm or household that contribute to financial security (e.g. business expansion or education)
- finance is targeted at those households and firms for which lack of access to finance was a binding constraint, causing them to remain stuck in the poverty trap
There is an abundance of high-quality studies that consider whether vulnerable groups are included within the financial systems in Africa and South Asia. The mechanisms used by FIs to reach underserved groups are considered in a moderate number of these studies. There is convincing evidence that MFIs and fintechs that offer tailored products targeted at these groups are successful in reaching these cohorts effectively.
Providing appropriate capital to SMEs
A portion of CDC’s FI investments are committed to supporting SMEs through the provision of credit. This theme analyses these investments to assess how each investment performed with regard to extending SME credit and to some extent if this is contributing to improving firm well-being.
Out of CDC’s portfolio, 29 investments (combined investment amount of USD 858.7 million) were identified as having a clear offering and/or reported on serving the SME segment; these consisted of 25 FIs and 4 debt funds. It is worth noting that other CDC investments may also support SMEs, but this was not the core of their DI thesis. Additionally, some investments are not included here because they are primarily focused on housing finance and individual MFI loans.
When interpreting the information, it should be pointed out that no universal definition of the SME segment exists. The data presented here is subjected to segmentation biases of the various FIs reporting the information or their respective regulators. India, for instance, defines SMEs as any enterprise whose investments in plant and machinery do not exceed INR 100 million (USD 1.4 million). The Central Bank of Nigeria (CBN) defines SMEs as any enterprise whose investment in plant and machinery does not exceed 500 million Nigerian Naira (NGN) (USD 1.34 million). In Kenya, the definition for SMEs prescribes any enterprise with plant and machinery, and registered capital not exceeding 50 million Kenyan Shillings (KES) (USD 485,000). Not only do these definitions differ between countries, but within each country financial intermediaries may well choose not to adopt standardised definitions.
Figure 19: SME loans, 2012-2018, total, by product, by FI type*
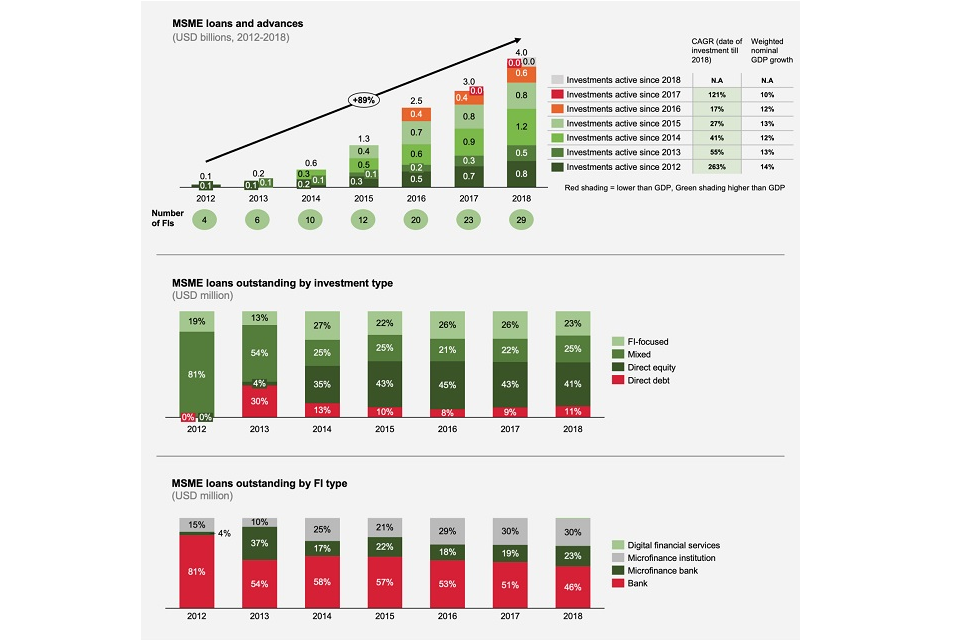
Figure 19: *[footnote 58]
Note: Debt funds not included in this analysis as consistent data on the evolution of loans on a year-on-year basis is not available from the information provided. DFS is less than 1% and not visible on the chart.
SME loans have grown at a CAGR of 89% from USD 87 million in 2012 to USD 4 billion in 2018. This overall growth is driven by large investments by commercial banks. From an organic growth perspective (i.e. looking at investments from their first year of investment to their last) all FIs in this sample experienced significant growth in SME lending.
Overall, the analysis indicates that CDC’s direct investments are contributing the most towards credit disbursed to SMEs, although this is driven by relatively large direct investments in banks and the lack of an attribution approach to impact assessment. It is also important to note that this analysis might not be an accurate representation of SME loans as this growth could perhaps be a symptom of reclassifying of old loans into new categories. Despite banks providing the most SME loans by value, debt funds are mainly focused on providing SMEs that would not ordinarily receive credit, with access to finance and focused technical support.
SME lending in relatively large banks
This section reviews the banks that CDC has been supporting to become more SME-centric. These banks have been selected as their DI thesis specifically focuses on increased lending to, or targeting of, SMEs. All the banks covered here are direct investments.
Figure 20: Loans outstanding – selected commercial banks
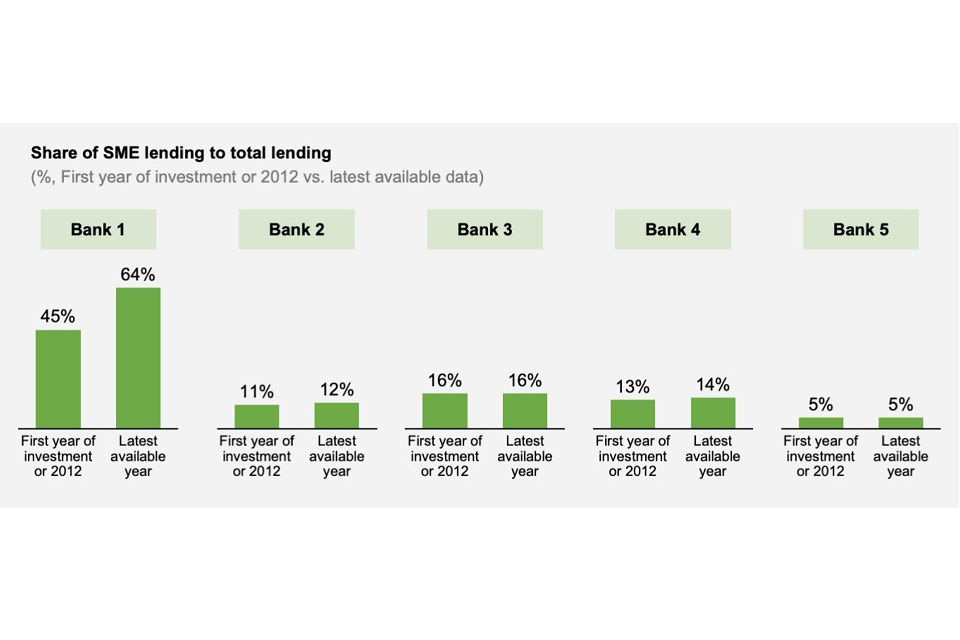
Aside from Bank 1, the share of SME lending in all the other banks that CDC has invested in largely remained the same. Apart from Bank 2, the absolute SME loan portfolios have grown as the banks’ loan portfolios grew. However, it is important to note there are investment-specific issues that may have prevented the realisation of an increased share of SME lending, including the duration that CDC has been invested in an FI:
- bank 2: Here CDC had limited strategic influence given its minority shareholding. The macroeconomic environment in the country has also been challenging under the current governing regime
- bank 3: The investment was impacted by the stringent regulatory environment in the country
- bank 4 and bank 5: No specific issues would appear to have impacted the growth of SME loans based on the public information analysed and CDC’s monitoring reports
Overall, it appears that scaling SME loans across large banks is a relatively difficult task, given their limited risk appetite combined with relatively stringent risk and credit qualification requirements. From an impact perspective, while banks do provide scale to reach more enterprises, their SME growth tends to fulfil the needs of only a small portion of the market. Further analysis of bank-level data would be needed to understand the number of SMEs that are being served, the different median and average loan sizes across the SMEs being served, and whether competitor banks have innovated to a greater (or lesser) extent than those banks supported by CDC’s investments.
It is also interesting to note that Bank 1 has had one of the largest impacts on the financing of SMEs in both relative and absolute terms and has also shown healthy profits over its investment horizon. This investment is interesting, as it offers opportunities to further explore the drivers for this success (not limited to), the size of CDC’s equity stake, influence at the board level, the level and nature of TA provided over the life of the investment, and any other factors.
In the case of Bank 1, CDC was a sizeable shareholder, had hands-on management control, and provided TA (in the early years of investment) leading to the introduction of new products, such as leasing and mortgage finance. This was the traditional DFI investment model that worked well for a number of years. CDC has notably not taken on such investments in recent years, and it may be worth reconsidering CDC’s involvement in this space. Other DFIs have recognised that direct investments of this kind have a role to play in catalysing development finance and that direct investment in private sector institutions may have only limited impact in reaching SMEs.
SME lending in MFIs
This section aims to explore the MFI/SFBs that CDC has been supporting to become more SME-centric and where SMEs form a core component of its DI thesis. FIs explored here include 2 SFBs and one non-bank lender in India that are all direct investments. While there might be MFI investments in Africa that have an SME focus, these have not been covered, as supporting SMEs was not a core focus of their DI theses.
Overall, only one MFI has seen a marked increase in both the absolute volumes of SME loans and the relative share of SME loans. This has led to a decline in the MFI’s microfinance loans. However, a large part of this MFI’s lending was still directed at microfinance from 2015 to 2019. It would be interesting to understand from the MFI’s management what has led to the marked increase in SME loans.
While the second MFI has seen an increase in SME loans in absolute terms, the share of overall lending to SMEs has declined.
The non-bank lender was already largely an SME lender. Post investment the business has grown significantly, indicating a growing number and value of SME loans. This has also resulted in larger value loans to customers, with the average loan size growing by 20% from 2017 to 2018.
From an impact perspective, it appears that MFIs in India are able to shift their business models to reach more SMEs and still operate an MFI business. It would also be useful to understand how the non-bank lender has been able to scale its business to grow its total SME book and if there are any lessons for the rest of the portfolio on this SME lending model.
Box 4: Evidence related to providing appropriate capital to SMEs
Evidence review questions aligned to theme: Questions 1, 2, 3, 4, 5, 6 and 8
Main points arising from the evidence related to theme
The provision of financial services to SMEs is discussed at length in the literature. Modest evidence indicates that SMEs that receive finance are likely to expand their businesses with a positive impact on the local economy. There is evidence that this is due to greater investment and increased productivity, leading to increased remuneration of employees and even increases in employment.
There is no formal evidence available regarding larger SMEs or corporates. This is most likely because for micro-enterprises the data arising from these smaller transactions is readily available and more conducive to causal analysis techniques such as RCTs and other academic experiments. Further, large corporations are often unable to provide detailed financial data to the researchers conducting these studies. Data regarding these corporations is often commercially sensitive and therefore strictly confidential.
Financial market liquidity for emerging markets
This theme focuses on CDC’s FI investments that serve to increase the liquidity of FIs and markets to allow for more on lending in markets where funding is difficult to come by both in terms of quantity and pricing. Therefore, the focus of this section is on CDC’s direct debt investments.
CDC’s direct debt investments
Across the portfolio there are a total of 16 direct debt investments that amount in total to USD 514 million. The purpose of these investments is largely to provide liquidity to banks in emerging markets at competitive rates and tenures and to expand lending to certain segments within the market and/or strengthen the capital bases of these FIs.
Approximately 58% of direct debt investments are in India, 27% are in African countries and the rest in other South Asian countries. The rest of this section discusses CDC’s debt investments based on these 3 regions, India, rest of South Asia and Africa, and provides a summary of the overall lessons at the end of each regional discussion.
Figure 21: IMF Financial Market Development Index (2017)*
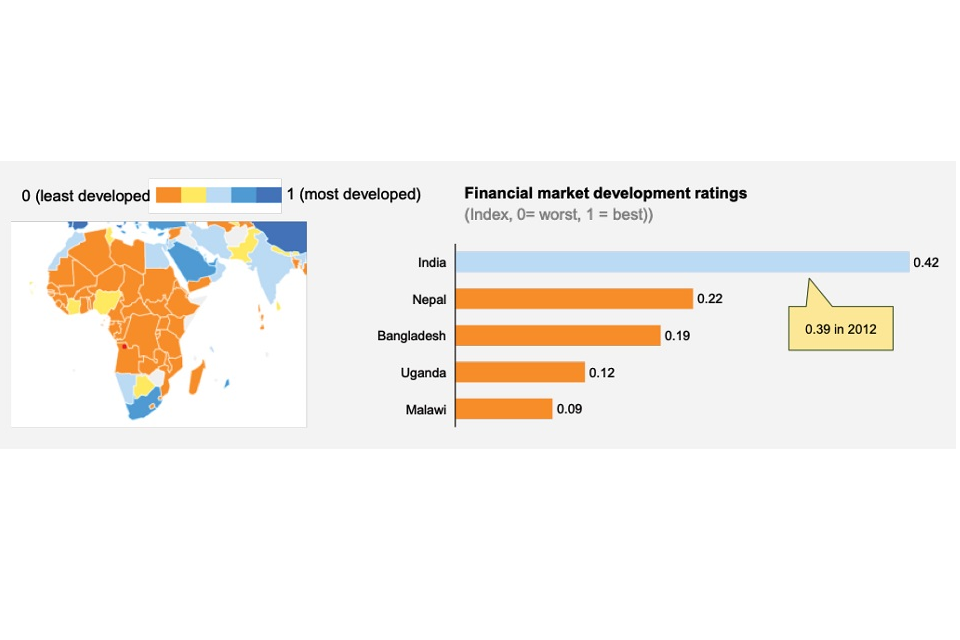
Figure 21: *[footnote 59]
Impact of CDC’s debt investments in India
According to the International Monetary Fund (IMF), the Indian financial market is relatively sophisticated compared with the other markets in CDC’s focus geographies. An analysis of several of the investees supported by CDC through debt funding was conducted. Based on the findings, it was noted that most FIs were able to raise similar or higher levels of debt, at similar pricing and similar tenures to CDC debt in the domestic bond markets.
In India, the average tenure of the debt provided by CDC is 6.9 years and the average price of fixed-rate loans is 11.6% in Indian rupee (INR) terms, while the current 5- and 10-year government bond yields are 5.7% and 6.4% respectively.[footnote 60] Based on this data, CDC’s local funding is at an average premium of 5-6% above the Indian government bond yields, which is largely on par with the cost of local currency funding available to the FIs on commercial terms.
Based on the reviewed investment committee (IC) papers of the large Indian debt investments, the main financial and value addition drivers for providing the debt were that the type of capital was not available, the quantity of the capital was not available, investees wanted a reputable investor such as CDC, and they wanted the TA and expertise offered by CDC.
While the IC papers do indicate that CDC is offering financial additionality at the IC stage, it is not possible to definitely show this based on the market data. It is noted that in some cases CDC provided Tier 2 capital, which was in short supply, and by providing longer-term debt as Tier 2 capital, CDC is providing funding combined with regulatory relief to the advantage of recipient FIs. Also, historical tenures have been relatively short in India and evidence suggests that funding from domestic markets might not be available for the FIs that CDC is supporting. Further research would also be needed to understand to what extent CDC’s debt is contributing from a value additionality perspective.
Impact of CDC’s debt investments in South Asia
CDC made a commitment to an FI in order to provide liquidity support. However, the impact of the facility was hampered. It turned out that there was limited appetite for foreign-currency lending and therefore a local- currency debt instrument was considered more appropriate.
Soon after, the facility was partially converted into local currency for on-lending, with the FI absorbing the cost of hedging the foreign-currency risk, and funds have since been on-lent to SME businesses.
Overall, this transaction highlights important lessons on the trade-off between local-versus-foreign currency lending. When there are not enough firms in the local market generating revenues in hard currency, a local currency lending model could be more appropriate. Generally, in markets where the currency is relatively stable, this can be considered, or where the FI is willing to take on the foreign currency risk.
Alternatively, CDC could consider providing guarantees to allow FIs to issue corporate bonds in local currency in the local capital markets. It is noted that CDC requires a credit rating to do this, and this could be something that CDC could explore in the near future, barring any legal and policy limitations.
Impact of CDC’s debt investments in Africa
In Africa, the financial markets are undeveloped and opportunities for raising funds through bond issuance locally and efficiently in smaller markets, such as Malawi and Uganda, are scarce. Under these circumstances, CDC’s investments could be more relevant. However, a major challenge hampering the potential impact of some of CDC’s African debt facilities is that almost all loans are in US dollars and banks do not have borrowers with secure dollar incomes able to service the loans. Borrowers in markets, such as Malawi and Zimbabwe, are unable to adequately hedge their currency risk, and in the context of CDC’s lending this has been a main driver for pre-payments of loans. The discussion in South Asia potentially holds replicable lessons for Africa.
Some of these options include:
-
where foreign-currency liquidity is required – Ensure that banks have a sufficient pipeline of business clients with dollar revenues
-
where local-currency liquidity is required – a) Provide guarantees on local corporate bond issues/private placements issued by FIs so that these FIs can raise debt in local/regional markets, b) Consider capitalising partial credit guarantee funds that would reduce FIs’ risk exposure to SMEs without FIs having to pass on the currency risk to their borrowers, and c) Lend in local currency; CDC already provides local-currency equity capital to FIs and accepts currency risk on direct equity transactions and dividends paid out, therefore a case could be made for local currency lending
Box 5: Evidence related to financial market liquidity for emerging markets
Evidence review questions aligned to theme: Questions 2, 3, 9, 10, 11, and 12
Main points arising from the evidence related to theme
There is a well-established need for capital in Africa and South Asia. There is also compelling evidence that small firms that receive capital injections are more likely to grow and employ staff. This indicates that there is a relationship between increased capital provisions in a market and better outcomes for firms. However, there is limited evidence, within the parameters of the methodology of this evaluation, which investigates the specific dynamics of the relationship between an increase in the volume of capital provided by FIs and the effects on firms or households.
Most of the evidence base reviewed focuses on commercial banks and MFIs in Africa. FIs in SSA have received significant support from DFIs with regard to equity and debt. There is moderate evidence that DFIs have played a key role in proving demonstration effects to attract private capital. In such cases, this role has been achieved by providing first-round seed capital and TA to many new fintechs and non-banking financial institutions (NBFIs) through fund managers in emerging markets, particularly in SSA.
Developing capital markets
This theme assesses the extent to which CDC’s investments have promoted the development of capital markets by making long-term financing more accessible for firms and households.
Besides banks and MFIs, CDC’s current portfolio is relatively underinvested in institutions supporting capital markets. From the 180 FIs in the portfolio, there were 15 investments in insurance companies and 3 in pension managers (all investments were through funds). There are few investments in asset managers through diversified financial services holding companies.
Across the direct portfolio, there were several investments that had a component of developing the capital markets in their DI thesis (the privatisation of HBL Pakistan[footnote 61]) and CDC’s direct investments in SFBs in India to assist them in listing with the ultimate aim of increasing lending to certain segments and increasing the scale of the FIs. On the funds’ side, one FIF fund had a specific capital market focus. At a general level, all of CDC’s investments in funds can be considered as long-term financing as they predominantly provide long- term debt or equity to FIs and companies. Finally, CDC’s corporate debt-risk sharing facility in Sierra Leone, which provides medium-term financing to corporates for up to 2 years, can be considered to have a capital market focus.[footnote 62]
In order to understand CDC’s impact on developing capital markets by making long-term financing more accessible to firms and households (as stated in the relevant DI theses), it is important to first understand the nature and the state of the capital markets in CDC’s focus countries. As a second step, it would be useful to understand how CDC is impacting capital markets in its respective markets (through its investments mentioned above) and finally what more CDC can do to increase its role in developing capital markets.
State of the capital markets across CDC’s target geographies
Having access to capital – whether through quoted or unquoted markets (such as through private placements) - is essential to securing long-term capital on a sustainable and efficient basis both in funding FIs and in sourcing funding for capital investment for non-financial companies. Symptomatic of the lack of long-term funding in lower and low-income countries is that only about 12% of the total bank loans have a tenure of greater than 5 years versus 33% in developed countries (according to the World Bank). Inadequate access to long-term funding is a major hurdle to the development of low-income economies.
Table 4: Capital market development indicators across key geographies
| Country | United Kingdom | South Africa | Morocco | Ghana | Nigeria | India | Kenya | Pakistan |
|---|---|---|---|---|---|---|---|---|
| GDP (USD billion, 2018) | 42,943 | 368 | 118 | 66 | 397 | 2,719 | 88 | 3,14 |
| GDP per capita (2018, USD) | 2,855 | 6,374 | 3,238 | 2,202 | 2,028 | 2,009 | 1,710 | 1,482 |
| Proportion of fixed investment financed by banks, equity, or stock sales (%) | NA | 26 | 13 | 10 | 1 | 29 | 16 | 9 |
| Adults with home loans (%) | 31 | 4 | 5 | 3 | 1 | 2 | 1 | 2 |
| Issuance volume of corporate bonds by private non-financial firms to GDP (%) | 4 | 2 | NA | NA | 0 | 1 | 1 | 0 |
| Avg. maturity of issued corporate bonds by private non-financial firms (years) | 13 | 7 | NA | NA | 5 | 8 | 11 | 4 |
| Bank loans to non-financial firms with maturity >1 year (%) | 70 | NA | NA | NA | NA | 68 | NA | NA |
| Stock market cap to GDP (%, 2018 or latest available) | 89 | 234 | 52 | 10 | 17 | 77 | 23 | 33 |
| Non-financial corporate debt, loans and debt securities to GDP (%, 2018) | 83.7 | 38.4 | 37.8 | NA | NA | 45.5 | NA | 21.1 |
| Non-financial corporate debt, loans and debt securities to GDP (USD billion) | 2,414 | 141 | 45 | NA | NA | 1,237 | NA | 66 |
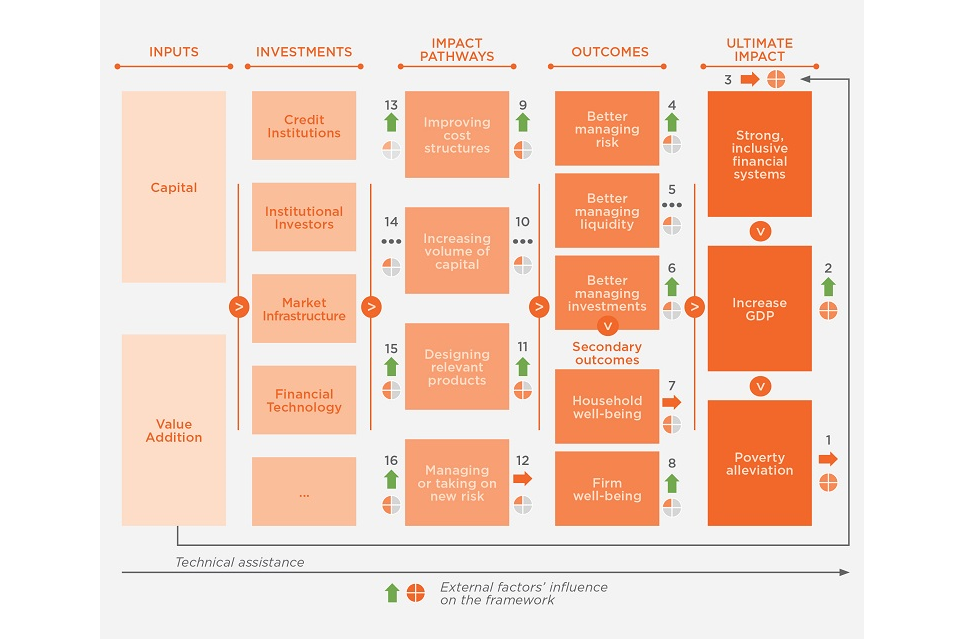
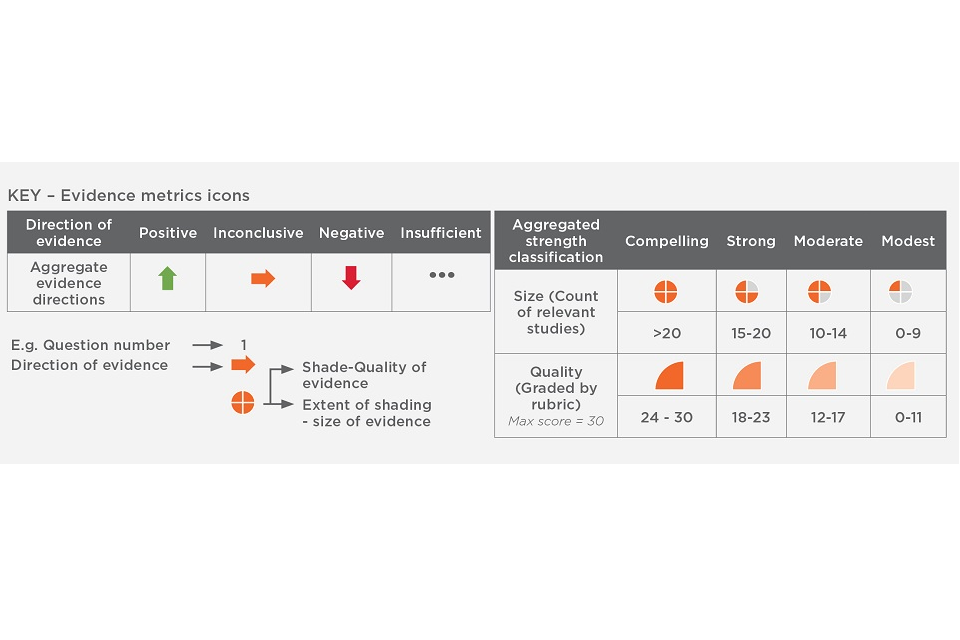
Note: Green shading indicates top 3 in each category. UK included for comparison purposes.
Based on the table above, while the lack of access to listed markets for long-term financing holds true for most low- and middle-income countries. India is an outlier, where banks’ loans and advances with maturities exceeding 5 years account for 26% of total loans outstanding and the share of deposits with maturities greater than 5 years account for 21% of total deposits. Additionally, India has a relatively well-developed market for quoted corporate stocks and bonds.
Nonetheless, given this underdevelopment of the listed capital markets, CDC’s potential contribution to capital market development could be achieved in numerous ways. This could include; investing in institutional investors and fund managers, investing in capital market infrastructure providers, direct or indirect deployment of long-term equity and debt, provision of partial credit guarantees and risk-sharing agreements in support of local currency bond issuances, directed lending to specific sectors through intermediaries, anchor investing in private placements and IPOs and refinancing of long-term debt. Based on the possible contribution that CDC can make, the next sub-section looks at CDC’s actual contribution to capital market development through its direct and fund investing.
CDC’s current contribution to capital markets
Supporting IPOs and book building
Within this kind of support, there are 2 clear instances where CDC aimed to support the IPO processes of FIs in their respective markets. The 2 examples here include the privatisation process of HBL Pakistan and the listing of SFBs in India.
Anchor investing in HBL Pakistan’s pre-IPO process
In 2015, CDC invested in HBL Pakistan for a total value of USD 122 million in return for a 5% equity stake in the bank. Part of the DI thesis of this investment was to support the bank in its journey towards full privatisation.[footnote 63]
The initial privatisation process of the bank began in December 2003, when the Government of Pakistan granted the Aga Khan Fund for Economic Development (AKFED) rights to 51% of the shareholding in HBL for 22.4 billion Pakistan rupees (PKR) (USD 389 million).[footnote 64] CDC’s primary role was in the second phase of the privatisation process where the bank sought to list on the securities exchange and both CDC and the International Finance Corporation (IFC) acted as anchor investors and supported the book-building process.[footnote 65]
The overall outcome of this second phase of the privatisation phase was successful, whereby the government was able to sell all of its remaining shares in the bank.
While the role that CDC and IFC played in the privatisation process should not be understated, the motivation for CDC’s investment was equally driven by the DI that CDC could have on the bank by supporting the launch of more inclusive products and scaling up lending to women, SMEs and agriculture,[footnote 66] which requires further evaluation given data limitations.
Overall, CDC’s contribution to the privatisation was mainly as an anchor investor to support with the book -building process, and it is not possible to determine if the privatisation would have gone ahead if CDC had not invested. Nonetheless, CDC did contribute to the privatisation of the largest bank in Pakistan. Post CDC’s investment, HBL’s loans and advances have grown at about 14% per annum in local-currency terms, marginally faster than the overall market which grew at 13% between 2012 and 2018.[footnote 67]
Listing of SFBs in India
The second example where CDC contributed to the listing of FIs is seen in India. Since 2012, CDC has made investments in 7 SFBs (prior to 2017 these were all MFIs) either directly or indirectly (funds). Since the investments were made, all of the FIs have successfully transitioned from previously being MFIs into SFBs (where they were allowed to mobilise deposits from retail clients).
As of April 2020, 2 of the 7 SFBs that CDC has invested in have managed to list, i.e. AU SFB and Ujjivan SFB. The listing of these organisations allowed them to raise additional capital – more than 5 times CDC’s initial investment.[footnote 68]
While it should be noted that these listings were mandated by the regulator[footnote 69] as part of their licensing terms, by providing equity to Ujjivan and debt financing to Au Financiers, CDC directly contributed to the overall asset base of these SFBs to enable them to list much faster than they would otherwise have been able to. CDC also worked with some of the 7 SFBs to support them to build products, manage risk, manage compliance and manage the entire process of changing their organisational culture.
From a DI thesis perspective, it should also be noted that the initial development thesis for CDC’s investments in the SFBs was to promote access to finance for otherwise financially excluded households and SMEs, which has been largely achieved.
Summary of CDC’s contribution to IPOs and book building
Overall, it can be said that CDC has contributed to the listing and the book building of HBL and some of the SFBs in India. CDC’s specific role in scaling these FIs has also been discussed under section 5.2.
Investments in institutional investors
Of the 88 out of 180 investment reviewed, there were 4 investments in the insurance sub-sector and 2 investments in the pension sub-sector. These 6 investments amounted to USD 12 million.
Summary of CDC’s contribution to investing in institutional investors
Overall, CDC’s investments in the insurance and pension sector are considered relevant, given that the markets that CDC has invested in have extremely low penetration rates of insurance and pension. However, that being said, the size and diversity of investments in institutional investors is low, and in several instances, the investments are not financially self-sustaining.
Across the entire portfolio, there was a general lack of investments in capital-market infrastructure providers. Examples of such investments would include credit reference bureaus (CRBs), stock exchanges, bond exchanges, commodity exchanges, central securities depositories and fintechs providing capital- market products (e.g. mobile-based money-market providers). Such investments in broader capital markets infrastructure ecosystems are areas that CDC might explore going forward and have been identified as a focus in CDC’s FI strategy.
The role of PE and debt funds in the capital markets
The third way in which CDC is currently contributing to capital-market development is through its fund investments. According to the African Private Equity Venture Capital Association, the total equity raised through PE funds in Africa has surpassed the total value of funds raised through IPOs. In 2019, there were a total of 9 IPOs in Africa raising a total of USD 1.9 billion versus 198 PE deals across the continent amounting to USD 3.4 billion.[footnote 70]
With this observation in mind, CDC has made significant investments in PE and debt funds (specialising in the funding of SMEs) in Africa and South Asia. Close to half a billion dollars has been invested through funds in the FI portfolio and more than USD 2 billion across CDC’s other sector portfolios.
From a debt funds perspective, CDC has been a pioneer in investing in such funds which make access to finance possible for companies that would not have otherwise received credit from banks. However, one of the lessons from debt fund investments is that it is important to get the structuring right. Setting up debt funds as closed-ended vehicles significantly diminishes the scalability of the fund. A closed-ended structure prevents a debt fund from being able to recycle loan repayments to reach more SMEs and also prevents the scaling up of technical capacity built within the fund. A closed-ended structure may also have negative impacts on the financial viability of a fund.
Summary of CDC’s contribution to development through fund investments
Overall, CDC is playing an important and contributing role to supporting the deployment of long-term finance in Africa and South Asia through investments in its PE and debt funds. CDC has invested close to half a billion dollars in FIs through its FI-focused, generalist and debt funds and more than USD 2 billion in other non-FIs.
Lessons from CDC’s contribution to capital market development
Based on the analysis of CDC’s contribution to capital markets, the following lessons emerge:
- while CDC has played a role in the IPOs and book building of some FIs, a more prominent role can be taken by targeting more FIs to list and raise capital in private and public markets
- there is a lack of diversity in investments in supporting the capital-market, although this forms a core component of the FI strategy going forward
- while the tools that CDC has used to support capital market development are relevant, there is a need to expand the diversity of these tools. Some examples include direct lending through intermediaries, credit guarantees, increased scaling up of debt funds and other instruments
Box 6: Evidence related to developing capital markets
Evidence review questions aligned to theme: Questions 13, 14, 15, 16 and 17
Main points arising from the evidence related to theme
There are a number of compelling studies that investigate the impacts of the local market context on the FI’s ability to deliver impact. These studies have a strong average quality and are a mix of case studies, qualitative analysis, and quantitative data methods. The aggregate direction of evidence is positive, as an overwhelming number of studies show that market context significantly affects the ability of FIs to deliver impact. The main components discussed in the evidence are infrastructure (both physical and financial), institutions, regulations, and inequality. For example, there is convincing evidence that credit bureaus are linked to an increase in overall welfare in markets. Credit bureaus can decrease the cost of transactions for end-users, as well as provide opportunities through levelling the playing field for those who typically may not have had access to financial services previously (for example, women).
MRPAs and counter-cyclical finance
This theme analyses CDC’s investments in its risk-sharing facilities that include 1) TF, 2) supply-chain finance, and 3) corporate debt risk-sharing facilities (RSF). From a DI perspective, both trade and supply-chain finance focus on allowing a partner bank or other financial intermediary to take on more or new types of lending risk. This DI thesis aligns with the FI impact framework and risk sharing framework delivering impact in one or more of the following ways:
- allowing the partner to increase its current lending exposure limits to underlying recipients or sub- borrowers
- allowing the partner to increase its current lending exposure limits to new geographies, nascent markets, or countries perceived as ‘higher’ risk
- allowing the partner to lend new types of products to customers, or new types of customer segments altogether, so the partner can learn how to assess credit risk appropriately and serve its customer base with more relevant and/or higher-impact products and services
Ultimately, DI is achieved when a partner institution is able or willing to lend more or assume a new type of lending risk and scale it commercially.
The rest of this section is structured according to these 3 sub-products offered by CDC. Each sub-section begins by providing some context on the sub-product, an overview of the CDC’s facilities, and an overall assessment of the impact of these facilities.
Within this section, the topic of counter-cyclical finance is also covered as it inherently forms part of some of the risk-sharing facilities CDC offers (TF and corporate debt-risk sharing). Based on this same sub-theme of counter-cyclical finance, CDC’s other investments that fall in this area are also briefly described, such as the IFC capitalisation fund.
Trade finance
Context: Trade finance explained Box 7:
Trade finance explained
What is trade finance?
Trade finance (TF) represents the financial instruments and products that are used by companies to facilitate international trade and commerce.
How TF reduces risk
TF can help reduce the risk associated with global trade by reconciling the divergent needs of an exporter and importer (based on numerous studies and surveys). Ideally, an exporter would prefer the importer to pay upfront for an export shipment to avoid the risk that the importer takes the shipment but refuses to pay for the goods. However, if the importer pays the exporter upfront, the exporter may accept the payment but refuse to ship the goods. Therefore, TF introduces intermediaries to manage risk and ensure settlement of payment and delivery of goods and services.
How it works in practice
In practice, TF transactions generally work as follows:
- The importer and exporter enter into a commercial contract.
- The importer requests a letter of credit from its local bank (issuing bank).
- The LC is approved and opened.
- The issuing bank communicates this letter of credit (LC) to the exporter’s bank (confirming bank).
- A reputable and recognised partner bank, insurance company or other entity is requested to insure/guarantee the LC, e.g. Standard Chartered.
- Standard Chartered provides a guarantee on the transaction.
- The confirming bank confirms the LC.
- The exporter gets paid by the confirming bank.
- The goods are delivered.
NB: The confirming bank and the guaranteeing/partner bank can, in certain circumstances, be the same entity.
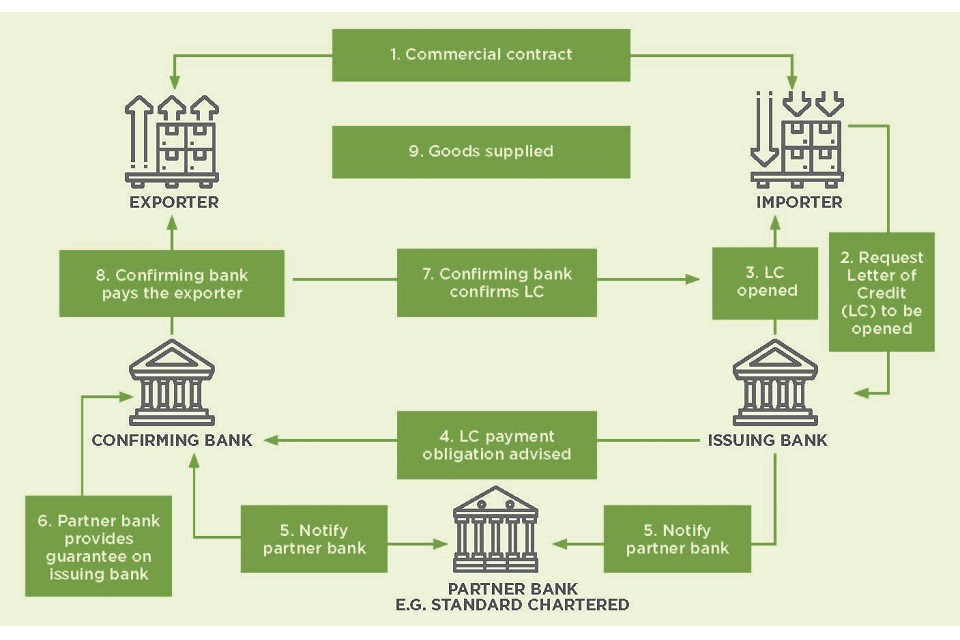
While most transactions take place as described above, often there are various limits driven by regulations that impede TF:
- Issuing banks have single obligor limits on their clients (importers) prohibiting them from financing trade over a specific value, for a specific importer, in a given time period.
- Issuing banks have limited foreign currency to issue LCs, limiting the amount of trade they can finance.
- Issuing banks may have capped limits with confirming banks, which limits how much trade they can finance.
- Confirming banks may not deal with certain issuing banks without guarantees, given the credit quality of the issuing bank.
- Confirming banks may have capped exposure limits for certain countries that issuing banks operate in, over specific time periods. This limits how much trade can be confirmed.
CDC’s role
CDC plays a role of enabling confirming banks to increase their risk allocation limits for specific issuing banks and countries when they have reached their limits. CDC also plays a role in absorbing risk from the confirming bank’s balance sheet by guaranteeing part of the TF transactions.
Context: The Global TF market and Asia
According to the Asian Development Bank (ADB), the global TF gap stood at USD 1.5 trillion[footnote 71] as at 2018. Access to TF remains disproportionately skewed in favour of large firms. SMEs account for 37% of TF demand based on the TF proposals received by banks surveyed (51% for banks in Asia and the Pacific). The rejection rate of SME proposals is 45%, which is high relative to mid-sized and larger-sized firms (39%) and multinational corporations (17%).[footnote 72]
Context: The African TF market
In 2014, the African Development Bank (AfDB) conducted a study of 276 commercial banks in 45 African countries. It discovered that although 87% of banks in Africa (including international banks) provide TF, there is a significant deficit in supply compared with the demand for TF. The AfDB estimated the TF gap in Africa at USD 91 billion in 2014 against the total value of trade financed amounting to USD 362 billion.[footnote 73] It should be noted that this data is likely to underestimate the TF gap, as over the past 5 years there has been a significant withdrawal of confirming banks in the African market as part of their de-risking strategy.
Based on the same study, it was found that the main drivers of the gap are a lack of borrower collateral and creditworthiness, accounting for 66% of rejections. Based on the ICC’s global TF survey,[footnote 74] the most common reasons issuing banks cited for rejecting TF transactions were limitations on credit-line availability (27% of rejections) and unacceptable risk profiles of their clients (23%).
Beyond these reasons, the AfDB survey noted that in times of commodity price weaknesses, banks in oil exporting countries (e.g. Nigeria and Angola) are specifically more constrained by their limited forex liquidity (accounting for 9% of the gap) compared with banks in net oil importing countries. This result suggests that, in times of a drop in the global prices of commodities, and as the availability of foreign currency on the market becomes more limited, banks will be inclined to reject more TF facility applications.
CDC’s TF facilities
Given this context, as at December 2019, CDC had 4 active TF facilities across 4 partner banks: SCB (USD 400 million), FirstRand (USD 100 million), Sumitomo Mitsui Banking Corporation Europe (SMBCE) (USD 100 million) and Afrexim Bank (USD 100 million). CDC is also in the process of entering into new partnerships with additional partner banks.
CDC’s impact
The main DI thesis for CDC’s involvement in the TF market is to support partner banks to alleviate issuing bank limits (in most cases CDC’s partner bank is the same as the confirming bank) and country limits, thereby allowing TF to reach more fragile (‘A’ and ‘B’) countries. However, as noted above, confirming banking limits account for only a small part (estimated at 8% by AfDB) of the TF gap in Africa, or equivalent to USD 7.3 billion in 2014.
In 2019, CDC supported a total of USD 4 billion in trades across 4 partner banks, 10 countries and over 70 issuing banks. African trades accounted for USD 2.1 billion and South Asian trades accounted for USD 1.9 billion. It is important to note that the total trade facilitated by CDC accounted for roughly 0.4%-0.6% of total trade values (imports plus exports) of these countries. African trades were largely accounted for by Nigeria (78%), Ghana (6%), Cote d’Ivoire (6%), Kenya (6%), Egypt (4%), and Tanzania (<1%). South Asian trades were accounted for by Pakistan (55%), Bangladesh (44%), and Nepal (1%).
Based on this data, the TF gap related to confirming bank limits is USD 7.3 billion and CDC contributed a total of USD 2.1 billion. With other DFIs working towards the same problem, it is not clear if this gap is already fully addressed.
Based on the TF data provided by CDC, there are key things to note:
- the weighted median value of all trades (since the inception of the facility) is USD 1 million. According to the IFC, the average medium-sized enterprise’s revenues and total assets range from USD 3 to USD 15 million, indicating that a majority of trades are to medium businesses. It is also interesting to note that the smallest trade in the portfolio was USD 2,000 and the largest trade was USD 100 million. This information indicates that a range of enterprises are being supported, from SMEs to large corporates. Based on discussions with the respective investment teams, CDC is playing an important role in alleviating issuing bank limits for some trade
- by supporting a large number of relatively lower credit-rated issuing banks, CDC has been facilitating the provision of trade credit to issuing banks that would, in normal circumstances, struggle to provide TF products due to risk limits and issuing-bank limits that partner banks would not want to breach
- from a geographical standpoint, CDC’s TF facilities have largely supported a handful of countries that are primarily classified as ‘B’ and ‘C’ countries with some reach to ‘A’ countries. The reach of the facility does not appear to be as broad as intended in the DI thesis that places a focus on reaching more ‘A’ and ‘B’ countries.
- it is noted that CDC’s TF facility weighted[footnote 75] average utilisation rates were 42% in 2017, 54% in 2018 and 65%[footnote 76] in 2019. Between August 2013 and December 2019, the overall facility size has increased from USD 50 million to USD 700 million – with more facilities still being added to the portfolio. Given the absence of benchmarks to compare against, further studies are needed to understand the trend in utilisation rates to conclude if these are at optimal levels
- the weighted average trade participation of CDC across all facilities in 2019 was 27%.[footnote 77] This participation may indicate that CDC provides additionality to its partners. However, further analysis is required to understand whether this percentage is optimal and what the respective impact of this participation is
- it is interesting to note that according to the Bank of International Settlements (BIS), the TF market is facing increasing concentration where the number of confirming/partner banks are declining (primarily due to AML compliance costs and business model challenges) and the total value of cross-border transactions are increasing in CDC’s target geographies. Furthermore, DFIs have largely been supporting only a handful of confirming banks, which could be further reinforcing this concentration. Further investigation is needed to understand the amount of support partner banks are receiving from DFIs and if this has an impact on the current levels of CDC’s participation
Overall, the TF product provided by CDC is structured similarly to other DFIs that focused on addressing mainly one particular barrier of confirming bank limits (these range from country limits, issuing-bank limits and so on). Evidence suggests that there are a number of other explanations of the limited availability of TF, and further investigation would be needed to confirm this. From a geographical standpoint, the facilities appear to be overly concentrated in a few countries[footnote 78] and the MRPAs appear to be supporting mainly medium- sized companies that could have access to multiple banks and products for TF. However, further investigation would be required to ascertain this.
Supply-chain finance
Context
SCF is a cash-flow solution that helps businesses/suppliers free up working capital trapped in supply chains. It is a solution designed to benefit both suppliers and buyers; suppliers get paid early and buyers can extend their payment terms. This solution allows businesses that purchase goods/inputs to unlock working capital as well as reduce the risk associated with buying goods in bulk and/or transporting them. SCF is generally defined as ‘an arrangement whereby a buyer agrees to approve their suppliers’ invoices for financing by a bank or other financier’.
CDC facilities
As at December 2019, CDC had such a facility in its portfolio. The facility is meant to allow SMEs in several African countries to gain access to finance through CDC’s partner bank immediately after selling their goods and services to large corporates, instead of waiting to receive payment. This is meant to unlock working capital for SMEs.
CDC’s impact
Further partnerships with local banks, and other ways of providing working capital finance to SMEs, such as establishing factoring platforms, could be explored in order to scale impact.
Counter-cyclical finance
This sub-theme discusses CDC’s investments that are counter-cyclical in nature, i.e. are set up to support in times of economic and/or social crises. The investments covered here include one MRPA, the Sierra Leone Ebola corporate debt-risk sharing facility, and one FIF fund – Africa Capitalisation Fund.
Ebola corporate risk-sharing debt facility
Context
This section focuses on CDC’s investments that were largely created to provide counter-cyclical finance[footnote 79] to countries or sectors in times of economic difficulty. This section is presented based on one of the main economic crises that CDC supported, i.e. the Ebola crisis of 2014.
Box 8: The Ebola crisis
Evolution of crisis
On March 23, 2014, the World Health Organisation (WHO) reported cases of Ebola Virus Disease in the forested rural region of south-eastern Guinea. The identification of these early cases marked the beginning of the West Africa Ebola epidemic.*
The disease quickly spread to Guinea’s neighbouring countries, Liberia and Sierra Leone, spreading to the capitals of all 3 countries by July 2014. The total number of cases reported in Sierra Leone stood at just over 14,000, accounting for half of all cases in the world.**
The Ebola crisis severely impacted the Sierra Leone economy, resulting in the economy shrinking by over 20% and a secondary shock whereby there was a downturn in the global commodity cycle (given the country’s reliance on iron ore exports).
There was an evident downturn in the current account balance of Sierra Leone after 2014, with imports declining by about 25% from USD 2.6 billion in 2014 to USD 1.5 billion in 2015. Additionally, the country experienced a 20.5% decline in real GDP growth in 2015.
Box 8: *[footnote 80], **[footnote 81]
CDC’s facilities
In light of this crisis, CDC mobilised the Standard Chartered Bank Sierra Leone Corporate Risk Sharing Facility. The facility was meant to support borrowers in the manufacturing, trading, logistics and oil/petrol (retail) sectors that were considered critical to the economy of Sierra Leone. The facility initially allowed SCB to lend up to USD 50 million to corporates (on a 50/50 risk-sharing basis with CDC) over a period of 2 years for its working capital needs.[footnote 82]
CDC’s impact
Given the macroeconomic conditions, the investment was considered eminently relevant in the market to assist corporates to access dollar loans to import goods and services. While the impact of these types of products is high, they can be sometimes inhibited by a low appetite for dollar loans, few firms that generate dollar revenues in order to be able to qualify for the loans, and a low lending risk appetite.
Overall, the facility is considered to be impactful, although there is a need to explore how the facility contributed to alleviating liquidity constraints in financing trade.
The facility continues to be in place to provide ongoing support to the economy, and the relevance will most likely increase under the COVID-19 pandemic. It should be noted that the type of investment/support CDC can provide in an economic crisis will vary based on short-term liquidity constraints in the market for TF, the dynamics of demand and supply, and the respective economy under consideration. Therefore, a standardised approach to an economic crisis may not be appropriate as the intervention will depend on whether the crisis is global, regional or local.
Global Financial Crisis (GFC) – Africa Capitalisation Fund
Context
The financial crisis of 2007-2008, also called the subprime mortgage crisis, led to a severe contraction of liquidity in global financial markets that originated in the United States (US) as a result of the collapse of the U.S. housing market. It threatened to destroy the international financial system, caused the failure (or near- failure) of several major investment and commercial banks and FIs, and precipitated the Great Recession (2007-2009). The GFC posed a global threat given the sharp drop in global demand and commodity prices that African economies are most affected by. The interlinked impact of the drop in African commodities demand, systemic issues in African economies and financial sector NPLs posed a real risk for the collapse and/or undercapitalisation of the African banking sector.
CDC’s facilities
Based on this context, the Africa Capitalisation Fund was set up to provide pre-emptive support to large African banks and recapitalise their balance sheets to prevent the adverse effect of the financial crisis. The fund was sponsored by the IFC and managed by IFC’s Asset Management Company – and targeted African banks in post-conflict countries and small economies.[footnote 83] CDC contributed USD 30 million[footnote 84] to the fund.
CDC’s impact
Based on the public financials of the banks that the fund invested in and media releases, there is an indication that some of the investments of the fund have been largely unsuccessful.[footnote 85] Within the fund, some banks collapsed due to business integrity issues, and others struggled due to various internal and external issues.[footnote 86]
A lesson that emerges from this investment is the need to understand the role and impact of taking relatively small equity positions in large African banks.[footnote 87]
Box 9: Evidence related to risk-sharing agreements and counter-cyclical finance
Evidence review questions aligned to theme: Investigated as a topic of interest
Main points arising from the evidence related to theme
TF was considered as a topic of interest across all questions in the evidence review. A high-quality generalisable study indicates that medium to long-term trade credit is causally linked to export growth in Africa and Asia. There is limited but positive evidence that targeting TF at industries that rely on high working capital is more likely to eliminate binding credit constraints for promising SMEs. There is no evidence for the effect TF has on end-user outcomes. Evidence is limited regarding the impacts of TF in developing countries, with little contextual analysis regarding the factors that contribute to an increased impact associated with TF.
There is moderate evidence that DFI support for TF is valuable in reducing the binding risk constraints banks face in developing countries. The main mechanisms of risk management DFIs are associated with are the provision of exchange rate risk management or incentivising the support of typically riskier firms such as SMEs.
Gender
In analysing the impact of the investment portfolio from a gender perspective, it was necessary to identify the FIs with sufficient data available to assess their impact across a period spanning 2013-2019.[footnote 88] Out of 88 investments reviewed in detail, there were 25 that had data available on the number of female clients in at least one year. The analysis faced a substantial data constraint due to the fact that most investments did not report female client numbers across all years. As a result, there are substantial changes to the universe of investments being considered on an annual basis. Nonetheless, the analysis that follows is useful as an indicator of how trends have changed over time. It is also important to note that out of the remaining investments, several had launched initiatives to drive gender-based impact in other ways, for example, through financial literacy or business skills development initiatives.
The 25 institutions in question are spread over a number of countries, though the dominant share was found to be in India. Of these 25 investments, 20 are fund investments.
In addition to the high number of investments located in India, it is worth noting that on an individual basis, these investments generally lend overwhelmingly to women. While data was not consistently available for every investment across every year between 2013 and 2019, it became clear that these investments each had a large number of female borrowers on their books. Out of the 12 Indian investments identified, 10 had a female borrower percentage of at least 80% in all years for which data was available.
By contrast, the ratio for multi-country investments generally hovered between 45% and 55%, with one exception: a microfinance holding company that had 98% female customers, albeit only over one year of data (2014). The 2 investments from Pakistan returned female borrower ratios of 15% to 24% and 25% to 34%. It should, however, be noted that both the Pakistan-based investments (HBL[footnote 89] and Khushhali MFB[footnote 90]) showed strong and consistent absolute growth in the number of borrowers that they served, resulting in substantial growth in the number of female borrowers served, despite the modest ratio.
Across all investments, the ratio of female to total borrowers ranged from a low of 31% in 2016 to a high of 52% in 2017.[footnote 91] It is, however, important to caveat this finding by noting that some years had better data availability than others, the years 2015 and 2017 in particular, and that the data for 2013 and 2014 was skewed by the lack of large investments with data available.
Figure 22: Male/female borrower split across investments with data available*
Figure 22: *[footnote 92]
Overall, the available data suggests an upward trend in the proportion of female borrowers being served from 2013 to 2014, followed by a decline in 2015 to 40%. This is due to the influence of HBL Bank, added a large number of customers to the overall pool, relatively few of whom were women.[footnote 93] Female borrowers as a percentage of the total peaked at 52% in 2017, before declining in 2018 and 2019. The reversal in the female borrower proportion in 2018 and 2019 is largely due to the growth in customer numbers experienced by HBL Bank, which added approximately 8.4 million customers in those 2 years,[footnote 94] even as other investments dropped out of the investment universe. Given that the bank has a relatively low female borrower ratio, this drags the overall proportion of female borrowers down. Regardless, 2019 ultimately ended with a larger absolute number of women being served than in 2015, despite a falling overall proportion.
Notably, the majority of investments (12 out of 25) that reported detailed gender data were MFIs, with 6 MFBs, 2 HF companies, 2 commercial banks and 2 other funds. From a relative point of view, MFIs and MFBs generally have a larger proportion of their borrower base made up of women, with clear majorities for MFIs in all but one year and majorities for MFBs in all but 2 years.[footnote 95]
By contrast, the commercial banks have less than 25% of their borrower base represented by women in any given year. It is noticeable that there is a sharp drop in the proportion of female borrowers for MFIs in 2019. This is due to the addition of an MFI holding company (driven by data availability) that has only 53% of its borrower base made up of women in 2019. Similarly, the drop in the MFI percentage for 2016 is due to a data gap for a few MFIs that served mostly women.
Figure 23: Female borrowers as a percentage of total customers, across investments with consistent data available*
Figure 23: *[footnote 96]
Notes: No data available for banks in 2014. MFI percentage share fell in 2019 due to the addition of an MFI holding company (based on data availability). The drop in 2019 data for banks is due to a reporting methodology change by HBL, whereby the evaluation team had to estimate the 2019 percentage based on Nisa account customer numbers.[footnote 97]
The relative dominance of female customers in MFIs and MFBs is largely a consequence of the strategy of these institutions. It is worth noting that in recent years, MFBs have led the way in the total number of female borrowers, followed by commercial banks,[footnote 98] with MFI[footnote 99] female borrowers substantially reduced between 2015 and 2019, which was due to data gaps for large MFIs that had previously served a larger number of female borrowers. Consequently, the MFI results for recent years in the figure are not fully representative.
Figure 24: Female borrowers by type of investment*
Figure 24: *[footnote 100]
Notes: 2013 and 2014 excluded due to lack of data for banks. The drop in 2019 data for banks is due to a reporting methodology change by HBL, whereby the evaluation team had to estimate the 2019 percentage based on Nisa account customer numbers.[footnote 101]
In comparing the ratio of female borrowers with the total borrowers served between 2013 and 2019, fund- based investments generally have a larger proportion of women being served (67% in 2019) relative to direct investments (30% in 2019). This may be a consequence of the small number of direct investments being considered, as well as the type of FIs that have been considered.
Though fund investments generally serve a larger proportion of women in relative terms, absolute numbers are dominated by direct investments (7.6 million vs. 0.5 million for funds in 2019). These numbers are skewed by the presence of HBL Bank entering the investment universe in 2015. The bank has a large number of customers, allowing it to serve many female borrowers despite women making up a minority of its borrowers.
Key takeaways
- across all investments, the share of female borrowers generally fell between 2015 and 2019, even as the absolute number served grew. This suggests women remain a minority overall
- from a relative point of view, a large share of the MFI and MFB borrower base is made up of women
- women generally form a larger proportion of fund-backed investments’ borrower bases relative to direct investments. However, the larger absolute borrower bases of the direct investments (driven largely by banks) means that they have served far more women in recent years
Box 10: Evidence related to Gender
Evidence review questions aligned to theme: Question 4, 5, 6 and 7
Main points arising from the evidence related to theme
Gender was considered across all questions in the evidence review. The majority of evidence regarding gender was found in the evidence that considered the outcomes level of the CDC FI impact framework. There is moderate evidence available regarding access to financial services for women. The question of increased access of financial services to women fell under the category of underserved cohorts that was discussed under theme 2. The evidence indicates that financial services and products that target women are successful in generating positive outcomes for households. However, the association of gender to outcomes at the firm level is limited in the literature.
Validating CDC’s FI impact framework from external evidence
The CDC FI impact framework envisages that investment in FIs leads to the following outcomes and impacts: improved well-being for households and firms that results in a strong, inclusive financial system, GDP growth and poverty alleviation. A review of existing literature offers additional insights into whether the causal linkages within CDC’s FI impact framework hold true. The evidence review provides a summary of the external evidence available linking investment in FIs to the envisaged outcomes and impacts. This evidence is used to validate the theory behind the CDC FI impact framework at the outcome and impact level. This is summarised in the sub-sections that follow. The strength and direction of evidence available for the outcomes and impacts are highlighted in the diagram below.
Figure 25: Summary of external evidence available to validate the intended outcomes and impacts of the CDC FI impact framework
Outcomes level
The CDC FI impact framework allows some flexibility as to the choice of impact pathway to be pursued by individual investments. However, there is limited evidence that the impact pathways applied to individual investments will target underserved, higher-risk groups. There is no evidence regarding how effective these pathways may be when compared with one another in targeting specific vulnerable cohorts.
The search for external evidence was bounded to ensure the studies analysed could be readily linked to the action of investing and, therefore, are reliable sources to verify the causal flow of the CDC FI impact framework.
Table 5: Summarised explanation of direction and key topics from the evidence for primary outcomes
| Primary outcome | Direction of evidence explanation | Key topics in the evidence |
|---|---|---|
| Risk | * Evidence from microcredit for both firms and households is positive (although sometimes only marginally). * Evidence for savings also has a positive impact on risk management for households. |
The evidence is primarily drawn from firms and households using microcredit. * Microcredit can play a role in consumption smoothing and in managing loss from shocks. Households with some access to finance are better able to smooth consumption than those without. * Both firms and households respond better to shocks and are more resilient because of either financial innovations or access to financial products. |
| Liquidity | * Insufficient evidence. | * Limited evidence indicates a positive relationship between savings groups and increased liquidity in a household. |
| Investments | * Evidence is positive – the studies for both households and firms find a positive correlation between formal savings and investment management. | * Households with formal banking products are more likely to use savings for investment. * Modest evidence indicates commercial bank accounts are causally linked to larger investment for households and firms. |
The evidence considering household and firm well-being (secondary outcomes in the CDC FI impact framework) is more substantial than the primary outcomes level. However, the evidence for firms is dominated by evidence for micro-enterprises. At this level, the definition of firm well-being is not easy to disaggregate from household well-being, as firms are frequently intermingled with households financially. There is no formal evidence regarding larger SMEs or corporates. This is most likely because micro-enterprises administer a larger number of small engagements than medium and large firms. The data arising from these engagements is readily available and more conducive to causal analysis techniques such as RCTs and other academic experiments. Further, large corporations are often unwilling to provide detailed financial data to the researchers conducting these studies.
Well-being is a complex contextual concept. The CDC FI impact framework is underpinned by a definition of well-being for both households and firms developed by Ogden (2019).[footnote 102] This definition is broken down into 4 significant aspects of financial well-being. A summary of the definitions across these aspects for households and firms is shown in Table 6 below.
Table 6: Aspects of well-being defined for households and firms
| Aspect | Overarching definition | Household (H) and firm (F) definition | |
|---|---|---|---|
| Growth | Increase in consumption and outputs. | H | Increase in incomes. |
| F | Revenues and spillover effects on the economy and employment | ||
| Resilience | Ability to withstand negative shocks, with minimal disruption to present levels of consumption and long-term goals | H | For households and firms, this includes building up reserves, having a network to fall back on, and having resources to cope |
| F | |||
| Consumption | Enhanced ability to cover expenses to consume inputs or goods. | H | Nutrition, housing, transport, etc. |
| F | Materials, labour, etc. | ||
| Wealth | In a position to acquire and/or develop assets to materially increase future consumption, growth and resilience. | H | Human capital, migration, improved physical security, etc. |
| F | Capital expenditure, expanding operations, etc. |
The evidence for secondary outcomes is considered based on the aspects of well-being defined above: growth, resilience, consumption and wealth.
Evidence linking primary outcomes to household well-being
There is moderate positive evidence that household consumption is affected by the better management of risk, liquidity, and investment. With regard to the improvement of household resilience, the evidence is inconclusive for risk management, positive for liquidity management and insufficient for better investment management. There is a gap in the evidence linking the primary outcomes to improved growth and wealth of households.
Evidence linking primary outcomes to firm well-being
The bulk of the evidence available is focused on microcredit and insurance. Positive evidence was found for the impact of better risk management on firm resilience, consumption and wealth. Access to microcredit is shown to allow firms to better plan and manage investment in inputs as well as take greater risks. The evidence indicates that this allows firms to expand business operations and increase profits and employment. The timing and distribution of financing has an impact on the firm’s ability to grow.
Ultimate impacts level
The evidence builds a clear case for the plausibility of 2 of the links between the components of the ultimate impact portion of the CDC FI impact framework. The evidence on strong, inclusive financial systems leading to poverty alleviation is inconclusive, although the evidence does indicate that access to financial services in the correct context can support poverty alleviation. The evidence indicates that an inclusive financial system is associated with growth in GDP. There is convincing evidence that a strong financial system contributes to the ultimate impact goals envisaged in the CDC FI impact framework, but there is no evidence for the influence of specific investments on creating strong, inclusive financial systems.
There are a compelling number of high-quality studies that investigate the relationship between financial inclusion[footnote 103] and poverty alleviation. Several research methods are used providing a rich depth to the analysis of this causal relationship. Numerous studies consider detailed cases associated with context, while larger- scale studies use relevant empirical methods from natural experiments or randomised control trials (RCTs). The direction of evidence is inconclusive rather than outrightly positive due to the important influence of context and external factors on this relationship. The evidence regarding financial inclusion focuses on MFIs and the provision of credit to underserved households and firms. This evidence indicates that credit used for consumption smoothing does not support the movement out of poverty in the long term, although it supports well-being by helping reduce the impact of short-term negative shocks.[footnote 104] Since a large portion of financing in impoverished communities is used for consumption smoothing, the direction of evidence is inconclusive.
However, access to finance can be linked to poverty alleviation if the following conditions hold:
- the finance provided is sufficient[footnote 105] to support investment in longer-term initiatives for the firm or household that contributes to financial security (e.g. business expansion or education)
- targeting households and/or firms where the lack of access to finance was a binding constraint for the household or firm, causing it to remain stuck in the poverty trap
There is extensive high-quality empirical evidence that investigates the relationship between strong, inclusive financial systems and GDP growth. There is compelling causal quantitative evidence that financial inclusion increases economic growth. The findings of these studies indicate that this growth effect is more likely to occur when there is a good business environment, an effective education system, and low prevailing levels of inequality. Various mechanisms of financial sector strengthening are discussed in the evidence that supports this positive effect, including reducing barriers to accessing credit, expanding bank branches, and closing credit gaps for targeted underserved cohorts. Three high-quality studies find that savings and deposit accounts do not generate a positive impact on GDP growth but do impact well-being. In addition, there is weak evidence that the impact of TF on economic growth is inconclusive.
Within CDC’s FI impact framework, a strong financial system is defined as sophisticated, diverse, efficient, stable and resilient. Overall, limited research shows that a strong financial system is correlated to higher GDP per capita in developing countries. When analysing the different components of a strong financial system and their impact on the other ultimate impacts, there is more convincing evidence available.
- sophistication: Sophistication, proxied by the level of development of the financial sector, has a positive impact on economic growth in developing countries
- diversity: There is strong evidence that suggests that a more competitive financial sector that provides more diversity in products, services, and prices positively impacts both inclusion and firm well-being
- stability: Modest evidence shows that stability in the financial sector, provided by capital buffers,[footnote 106] is correlated with higher levels of economic growth
- resilience: There is strong evidence that a financial system’s resilience has a positive impact on dampening the effects of serious negative shocks to the system
Several studies find a statistically significant positive link between economic growth and poverty reduction. However, there are 3 case studies that show no significance in the link between economic growth and poverty reduction in Pakistan, Mexico and Ghana. An explanation, supported by one study, is that this chain is broken because economic growth can exacerbate inequality, mitigating the positive impacts and benefits to the poor. The prevalence and extent of the inequality may be the reason why the intended positive impact on poverty alleviation is muted in certain geographies.
CDC’s value addition activities
This section provides a brief overview of CDC’s value addition activities across the FI portfolio. It should be noted that a review of the value addition activities provided by CDC is beyond the scope of this report and this section is merely to showcase how these activities contribute to the broader achievement of the DI theses.
Across a large spectrum of the deals’ analysed work on environmental and social (E&S), business integrity (BI) and increasingly CDC’s corporate priorities, most notably gender, CDC teams have actively engaged with FI investees to help them strengthen their underlying businesses and play a more active role in some of the strategic challenges they are facing (including around climate change). Value addition activities also form a core component of CDC’s additionality to a significant number of investments at the IC stage.
integrity interventions
CDC’s BI function is responsible for ensuring that CDC and its investees adhere to their applicable regulatory requirements and that CDC’s investees meet the requirements in the code of responsible investing. The BI team conducts due diligence on potential investee FIs’ financial crimes compliance controls and engages with these entities to strengthen their compliance and integrity risk management capabilities, either through the implementation of a BI action plan or enhanced monitoring and engagement. The BI team also provides investee FIs (including FI fund managers) with BI training and facilitates knowledge sharing across the portfolio for managing typical integrity risks such as money laundering and fraud. The BI team also conducts research into integrity and regulatory risks presented by emerging financial services and products to inform CDC’s FI investment strategy. An illustrative example of the role of the BI function in capacity building of FIs has been described below.
Compliance capacity-building for leading bank – A financial institution in CDC’s portfolio faced significant regulatory penalties relating to gaps in one of its branch’s internal controls, risk management and financial crime compliance. With the support of CDC’s BI team, the FI has developed and implemented a world-class compliance programme, including new policies, controls, financial crimes compliance systems and enhanced compliance audits. The institution increased its compliance resourcing, improved risk governance and also launched a know your customer (KYC) remediation programme. CDC’s BI team supported this compliance upgrade through advisory support, ongoing overview, and the provision of BI training, including at the board and senior management levels.
The BI team continues to support the financial institution’s requests for training and ongoing advisory support, including feedback on its establishment of a best practice ethics and compliance department. CDC’s BI team’s work with this investee demonstrates the potential for CDC’s value additive activities to improve overall market standards, including with regard to transparency and financial crime risk management. This is because the institution is now perceived to be a market leader with respect to its compliance approach and engages closely with relevant regulators and government bodies to help articulate best compliance practice in the local context and set a standard for other FIs to emulate. Such ongoing BI support is crucial for the institution if it is to continue to achieve its DI thesis, and if action were not taken this could have led to severe reputational risks linked to CDC.
CDC’s BI function plays an important role to ensure FIs have business continuity and work towards achieving their DI thesis. The role of the function could be ramped across fund investments beyond the already provided training to fund managers. For example, supporting fund managers to train their investees.
Environmental and social interventions
This team in CDC builds E&S capacity and processes across all FI investments. Typically, this includes environmental and social management systems (ESMS), policies and procedures, capacity building, and for FI equity investments potentially an E&S committee to help drive change. These committees have been noted to be useful in promoting the broader impact workstreams, particularly gender and DI. The E&S team also supports financial inclusion, literacy and increasingly climate change. Therefore, they serve as an important enabler of broader impact over time. It should also be noted that the roles of the value creation team and E&S team have also been integrated to support collaboration and enable the value creation team to access and work with FI partners.
CDC’s E&S work spans 5 main themes, which include:
- E&S capacity building – This ranges from providing bespoke training, provision of training workshops that enable the sharing of lessons, secondments and advice on legal documents/templates
- E&S practices and processes – Involves working with FIs on the development and evolution of E&S policies and procedures
- Governance of E&S performance – For several of CDC’s FI equity transactions, the team has initiated environmental, social and governance (ESG) committees as a way of overseeing and supporting the evolution of E&S performance and to tie this to broader governance and oversight of E&S impact at the board level.
- Tools, guidance and good practice – The team is building an FI portal to the existing ‘ESG Toolkit for Fund Managers’ website[footnote 107] so that CDC FI partners (and non-partners/consultants) can access E&S guidance and practical tools and tips to drive E&S performance that has been repurposed specifically for FI clients. The ESG team has also developed a range of additional guidances that aim to help FIs manage a range of systemic risks (including gender-based violence and harassment and modern slavery) with other DFIs
- Research and special projects – The E&S team (often with value creation strategies team support) is conducting various targeted projects, including gender and women’s economic empowerment (WEE) work, climate change, financial inclusion and literacy, finance against slavery and trafficking, building sponsor capacity to deliver renewable energy capacity in Pakistan, engaging on the ICC sustainable TF programme and other projects
Across the FI portfolio, the E&S team has been supporting the delivery of impact, including on building E&S capacity and procedures, gender and DI, and more recently it has also included some climate-related interventions that are in their infancy. Overall, the focus of the E&S function has been largely on direct investments (debt and equity). While the E&S team has not focused on the FI portfolio specifically within the fund and capital partnerships (FCP) business, it does have a capacity-building programme for CDC General Partners (that trains fund manager staff on a range of E&S-related issues) and has also developed an ESG toolkit for fund managers. In addition to this, more collaboration and support to funds could be considered to ensure all investees are able to benefit from best-of-breed E&S practices.
Client protection
CDC’s client protection interventions and initiatives currently reside within the DI team. For every investment that is made by CDC (across all sector portfolios), a high-level client protection analysis is conducted to identify any areas of weaknesses for further support and to establish the current level of adoption of client protection. Depending on this, a post-investment action plan is developed to resolve these gaps if required.
Additionally, if in the judgement of CDC, the activities of an FI at the time of CDC’s investment could reasonably be expected to involve microfinance activities, then these FIs are expected to endorse and apply the SMART campaign client protection principles as per CDC’s code of responsible investing.
CDC also takes a broader approach to client protection that is not limited to only MFIs but covers all FIs that serve vulnerable customer segments. This includes, and is not limited to, low-income clients, marginalised clients (including clients that are disabled), underserved clients (i.e. those who have had limited experience with formal FIs), all clients that are first-time borrowers, and clients that are workers in the informal sector and/or have informal income sources (i.e. where their income is generally less predictable). CDC is also part of a working group with the IFC to increase the adoption of IFC’s responsible investing guidelines in digital financial services (DFS). The main relevant principles from a customer protection viewpoint include:
- establish customer identity, data privacy and security standards
- promote fair and transparent pricing
- improve disclosure of terms and conditions for customers
- enhance customer services for problem resolution and product innovation
- prevent over-indebtedness, strengthen digital literacy and financial awareness
Overall, the adoption of these client protection principles aims to ensure that FIs are achieving their DI thesis in a holistic manner that does not exploit customers with lower financial literacy levels.
Gender
In 2018, CDC developed its gender strategy that focuses on women’s leadership, advancing women’s employment, women’s entrepreneurship, access to finance, supporting products and services for female customers across all sectors. For the FI sector – the focus has been on gender diversity and supporting access to finance for female entrepreneurs and clients. CDC has done this through providing support to its investees on developing gender-based roadmaps, working on sensitisation of senior management on gender issues, addressing unconscious biases for FI management teams and also helping FIs target more women businesses.
Overall, the gender team’s focus has been mainly on direct investments. There is less evidence of support to pre-2018 African direct investments, noting that all of the evaluated investments were made prior to the establishment of the gender function that is relatively new and ramping up. It should be mentioned that the responsibility for the execution of the gender strategy resides at both the corporate and functional levels. Further data and analysis would be required to establish any linkages between gender-specific interventions and DI at an FI level.
Box 11: Evidence related to Value Addition
Evidence review questions aligned to theme: Question 4, 5, 6 and 7
Main points arising from the evidence related to theme
The CDC FI impact framework indicates that value addition provided alongside an investment is intended to generate increased impact returns for an investment. Most of the evidence regarding value addition centres on technical assistance (TA). The evidence indicates that appropriate medium to long-term TA, paired with an investment, is causally linked with an increase in impact outcomes from an FI. There are high-quality studies that suggest that value addition in the form of TA provided to the FI and from the FI to the end-user can effectively increase impact and inclusion. The evidence indicates that the effectiveness of TA depends on its context, content and implementation.
Lessons learnt
This section presents the key lessons from the portfolio evaluation based on the various analysed themes.
Geography
- there is a relatively even exposure of investments in harder to reach ‘A/B’ (45%) compared with easier to reach ‘C/D’ countries and states (46%) – Given that CDC prioritises ‘A/B’ over ‘C/D’ countries and states, this even exposure may not be ideal
- there are many MFI investments in the Indian direct and FIF funds’ portfolio – Further analysis would be needed to understand the relevance of allocating a large amount of funding to India and to the MFI sector. It is noted that the MFI investments have been successful. However, there is now an opportunity to refocus support to other types of FIs and sub-sectors
Reaching underserved households and scaling MFIs
- MFIs have shown that they are able to reach the bottom of the pyramid, although their scale is limited on an individual FI level – MFIs across the portfolio have shown to be reaching largely underserved segments, although those in Africa have been less profitable and less able to scale. Further analysis on customer income levels would be necessary to confirm this finding
- traditional, non-digitised MFIs in CDC’s African intermediated equity portfolio have had limited impact and not scaled – Across the continent, the MFI lending model has been relatively unsuccessful. Most of CDC’s MFI portfolio in Africa has also suffered from poor performance, with the exception of a few investments. Additionally, the MFI sector has experienced extensive competition from DFS providers. It is noted that CDC has recently been actively investing in DFS providers
- CDC played an active role in scaling MFIs – CDC has played an active role in supporting the scaling of MFIs to SFBs through the provision of important TA (including as board members) and long-term stable capital. The sector is now relatively well developed and MFIs are able to raise funding from the capital market, meaning that CDC could consider scaling back its support for a large number of MFIs in India, in favour of other geographies/sub-sectors. Note, however, that TA may still be relevant to the extent this is needed
Providing appropriate capital to SMEs
- SME lending in banks has grown in absolute terms, but has been flat relative to the banks’ loan portfolios – Apart from one bank, all direct bank investments have marginally increased the share of SME lending. While a constant share of lending to SMEs can be considered impactful if the overall loan book is growing, it is not clear if these banks are reaching more SMEs (or simply serving their existing client base, which might be small)
- specialised debt funds offer a successful way to target SMEs and underserved segments in specific sectors – Both REFFA and MCF have seen early success in reaching underserved segments through their blended finance models.[footnote 108]
- debt funds struggle to scale when structured as closed-end funds that can impact their financial viability and level of scale – From an impact perspective, such investments are important vehicles for extending finance to businesses that would not otherwise receive credit from banks, although due to their structure they tend to struggle. A closed-ended structure limits the period for generating positive returns on lending portfolios, i.e. a longer fund life or a permanent capital structure can allow these types of funds to preserve and build technical capacity and allow for recycling of repaid loans, helping to scale up impact
- there are several upcoming digital lending models that are reaching SMEs in the portfolio, although overall investments in these FIs are low – CDC’s total investment in fintech and digital financial service providers is less than 3% of the portfolio. Part of this low penetration is driven by the fact that most of these investments are through funds (as the ticket sizes are too small for CDC to invest in) and CDC’s implied investment stake gets diminished as CDC is investing alongside multiple other LPs
Financial market liquidity for emerging markets
- some of the dollar-denominated debt to FIs in African countries has not been successful – Some investments across the African direct debt portfolio were repaid early due to low appetite/demand for dollar-denominated debt. Other complementary instruments, such as partial credit guarantees, guarantees on locally issued bonds by FIs and local-currency lending, could be considered to the extent that this is within CDC’s mandate and risk appetite
- debt investments in India might be less relevant than in Africa given the relatively large scale of Indian public-debt markets – Market fragmentation is an issue in SSA with an average corporate debt-to-GDP ratio of less than 20% (with the exception of South Africa), while for the much larger Indian economy the equivalent ratio stands at 45%. This implies that although the market is still developing, it is far larger and more liquid than markets in Africa, and corporate debt is therefore much more readily available. It is noted that some of the debt provided by CDC falls under the classification of Tier 2 capital[footnote 109] and hence further analysis would be needed to ascertain the shortage of this type of financing today
Developing capital markets
- investments in the broader financial system and capital market have been lacking across the portfolio, particularly on the direct side – Almost all of CDC direct investments are in MFIs or banks. In line with CDC’s recently adopted FI strategy (2019), which emphasises the role of developing capital markets, there is an opportunity to consider increasing investment in a diverse range of FIs.[footnote 110]
- support to IPOs and listing of FIs is limited – CDC has supported SFBs in India and HBL in Pakistan in completing their privatisation processes. However, there could be an opportunity to support more listings and private placements across both Africa and South Asia
-
multiple products can be used to support capital markets – While the products that CDC has used to support capital market development (such as PE funds, direct investing and risk sharing agreements) are relevant, there are other relevant products that could be utilised
- direct lending/sector-specific lending, e.g. credit lines for directed lending to SMEs, mortgages, female borrowers, and so on. It is noted that CDC’s debt funds in the catalyst portfolio (REFFA and MCF) are already engaging in blended finance initiatives, i.e. lending jointly with partner FIs. This type of lending increases the availability of long-term funds in markets
- first loss and partial credit guarantees to FIs could be used to increase the risk appetite of FIs
- The role of SME debt and equity funds could be expanded across the portfolio as they are a conduit for directly providing long-term finance
- given the small size of local capital markets across most countries in Africa, CDC could consider investment in domestic wholesale development banks that encourage lending to SMEs by providing private banks with instruments such as partial credit guarantees and credit lines, thereby leveraging the private sector banks’ expertise in assessing credit risks while intervening in a manner that is market catalytic
MRPAs and counter-cyclical finance
- there has been good overall coverage of ‘A/B’ countries (accounting for 70% of TF in 2019) – In 2019 there has been good coverage of TF across ‘B’ countries that accounted for 67.7% of all trades, although the coverage to ‘A’ countries remains low at 2.6%. A sizeable share of trades supported are to relatively lower-priority ‘C’ countries. Bangladesh, Ghana, Kenya and Egypt (‘C’ countries) accounted for 29.7% of all trades supported while CDC did not engage in facilitation of trade in any ‘D’ countries
- issuing bank limits is not the only challenge limiting TF[footnote 111] – CDC’s TF investments have placed a large focus on mitigating confirming bank limits on countries and issuing banks, although recent studies have cited multiple reasons for TF rejections. Studies such as the ADB 2018 survey[footnote 112] and ICC 2018 survey have cited a variety of other reasons for TF rejections that range from AML issues to country limits and global de-risking (confirming banks). While CDC is working to resolve some of these issues, there is an opportunity to work with issuing banks directly (banks that issue TF products) to understand the main drivers for rejected letters of credit and formulate a strategy that best addresses these challenges. It is noted that CDC is already beginning to engage in this space
- lack of diversity in partner banks supported – From the 7 MRPA investments made by CDC, 4 are to SCB – a dominant player in the global TF market. SCB’s total TF facility was USD 400 million compared with the other 3 partners (2 of which are African partner banks[footnote 113]) which collectively amounted to USD 300 million.[footnote 114] It is noted that, according to the AfDB, SCB is the largest TF confirming bank in Africa, and further analysis would be required to ascertain if CDC could be potentially reinforcing this market leader position. It should be noted that the TF strategy envisages entering into new partnerships with other partner banks and CDC has been ramping up new partner deals rapidly since forming a standalone trade and supply-chain finance team
- CDC’s supply-chain finance product is partly limited by the lack of local partner banks – Additional local partner banks and partnerships with more anchor buyers could be explored to scale up the facility that could potentially be impactful in securing financing for SMEs and helping them manage their working capital. Another approach CDC might consider is supporting the establishment of factoring platforms that build on the creditworthiness of the buyer while circumventing the high costs associated with the provision of banking services
- counter-cyclical finance products are important, although a broader toolkit may be needed – CDC has been able to play an active role in mitigating the effects of various crises on economies and firms. One such example is the Sierra Leone risk-sharing facility during the Ebola crisis in West Africa. Although these investments were highly relevant during these periods, CDC may benefit from a broader toolkit of products that would increase its response to various types of financial crises
Gender
- there is a lack of evidence around efforts to increase gender-based lending in banks – On average, women made up 22% of bank customers from 2013 to 2019. MFBs, on the other hand, averaged 66% over the same period.[footnote 115] As at 2019, women accounted for 96%[footnote 116] of customers in MFBs and 16% in banks. However, based on absolute numbers, banks account for more female customers
- there is a lack of a consistent approach to gender inclusion across DI theses of investments – The extent to which investments made a concerted effort to target women is unclear. A more consistent approach to DI regarding gender should be adopted to ensure that all investments are working towards a common goal – noting that the gender function is still ramping up and, from a timing perspective, CDC launched its gender strategy in 2018 where more than 90% of investments by number predate this date
General observations and data limitations
While analysing the FI portfolio, several items emerged that were general in nature, and these have been captured within this section.
Some of these include;
- lack of a consistent definition for underserved and SME segments – While analysing the data it was observed that several DI theses referred to SMEs, women and underserved segments generally without referring to their relative size or defining these segments clearly. It would be of benefit to standardise this across CDC’s FI sector-focus countries and FI types in order to enhance impact reporting, noting, however, that this is also an issue across the industry
- inconsistent and general lack of information on underlying households and firms being reached – CDC’s current impact reporting is largely informed by public information for direct investments and fund reporting for indirect investments. With the exception of a few selected direct and fund investments, general reporting on end beneficiaries (e.g. gender, low-income customers, etc.) of FIs is missing. Impact reporting could be improved by requesting FIs and funds to provide more detailed information on underlying borrowers and customers. Such information is integral to strengthening CDC’s strategy both as regards to the choice of investees and in understanding and supporting product development
- there is a general lack of data on Indian investments’ regional loan exposures – Based on the investment reporting and public information, it was not always possible to understand how loans were being disbursed across Indian states. More data here would be useful in unpacking impact against the DI grid. However, the sharing of such due to insider trading regulations is noted to be an issue
- lack of data on the benefits of TF to partner banks – Overall it was not possible to ascertain the benefit that CDC provides to partner banks and beneficiaries due to a lack of data
- inconsistent public information – Several companies were unlisted or did not publish financials, and this limited the exhaustiveness of the analysis. Also, most companies published inconsistent data from year to year, and this limited the consistency of data collected across years, FIs and markets
- DI theses in several cases are vague – Overall it is difficult to measure impact due to the opacity of these DI theses and therefore the specificity of the theses could be improved
Topics for in-depth studies
There are multiple topics that have been identified for further analysis and exploration through in-depth studies. The aim of these studies will be to provide more insights into which investments are having/had the most impact, what types of data FIs collect and how CDC can in future improve its impact, as well as its monitoring and evaluation (M&E) processes. The list below identifies areas for potential in-depth studies and further work needs to be carried out to prioritise and understand which are the most important topics for CDC given the distribution and size of the portfolio by region, product, FI type and other factors.
The topics and overarching evaluation questions have been listed below.
- scaling MFIs – what is the impact of scaling MFIs on firm and household well-being? This topic aims to understand CDC’s role in scaling MFIs in India and what impact this has had on improving household well- being
- SME financing – what is the optimal financing method to support SMEs? This topic aims to understand the benefits and drawbacks associated with alternative methods of reaching SMEs and which methods have the greatest reach
- SME impact – what is the impact of SME finance on firm well-being? This topic aims to understand the impact of CDC’s support to banks on firm-level well-being, i.e. SMEs
- trade finance – what are the benefits and impact of trade finance at the partner FI, issuer FI, and importer level? And what are the benefits and impact of trade finance during COVID-19 at the partner FI, issuer FI, and at importer level? This topic aims to understand the extent to which CDC’s trade finance facilities are having an impact on its partners and firms
Annex
Table 7: List of stakeholders consulted
| Stakeholder Name | Title |
|---|---|
| CDC internal stakeholders consulted | |
| Adam Fegan | Portfolio Manager, Funds and Capital Partnerships (Asia Funds) |
| Admir Imami | Director and Head of Trade and Supply Chain Finance (Debt) |
| Alex Kucharski | Executive, CDC Plus |
| Alex MacGillivray | Director, Development Impact - Evaluations |
| Arpita Raksit | Gender Lead, VCS Gender Equality |
| Belinda Amoah Baako | Investment Executive, Financial Institutions (Debt) |
| Charles Groom | Portfolio Director, Funds and Capital Partnerships (Africa Funds) |
| Craig Gifford | Portfolio Director, Funds and Capital Partnerships (Asia Funds) |
| Dalia Aga-Shaw | Portfolio Director, Funds and Capital Partnerships (Africa Funds) |
| Dania Siddiqui | Investment Manager, Corporate Debt |
| David Banson | Investment Executive, Trade and Supply Chain Finance (Debt) |
| Di Fu | Investment Executive, Funds and Capital Partnerships (Asia Funds) |
| Enika Jorgoni | Investment Manager, Financial Institutions (Equity) |
| Freddie Tucker | Investment Manager, Trade and Supply Chain Finance (Debt) |
| Gaurav Malhotra | Director and Co-Head of Financial Institutions (Equity) |
| Gina Edmonds | Executive, Business Integrity |
| Huma Yusuf | Manager, Business Integrity |
| Jen Braswell | Director, VCS Management |
| Jeremy Cleaver | Head of Johannesburg Office and Portfolio Director, Funds and Capital Partnerships (Africa Funds) |
| Joe Barron | Investment Associate, Funds and Capital Partnerships (Africa Funds) |
| John Owers | Portfolio Director, Funds and Capital Partnerships (Africa Funds) |
| Kate Griffith | Manager, Development Impact - Evaluations |
| Kate Hallam | Investment Director, Financial Institutions (Equity) |
| Kunal Hindocha | Investment Manager, Funds and Capital Partnerships (Africa Funds) |
| Lisandro Cardinali | Investment Executive, Financial Institutions (Equity) |
| Liz Lloyd | Chief Impact Officer |
| Machal Karim | Sector Executive, Financial Institutions |
| Marco Polidori | Investment Executive, Financial Institutions (Equity) |
| Maria Largey | Director and Co-Head of Financial Institutions (Equity) |
| Mark Eckstein | Director, ESG Impact |
| Max Biswanger | Investment Director, Financial Institutions (Equity) |
| Ndaba Mpofu | Director, Head of Financial Institutions (Debt) |
| Noorin Mawani | Investment Manager, Funds and Capital Partnerships (Catalyst Funds) |
| Paddy Carter | Director, Development Impact - Research and Policy |
| Parul Hariharan | Investment Manager, South Asia |
| Pelayo Menendez | Manager, ESG Impact |
| Prachi Deedwania | Investment Manager, Funds and Capital Partnerships (Asia Funds) |
| Rachana Ramchand | Investment Executive, Funds and Capital Partnerships (Catalyst Funds) |
| Rahul Shah | Director, South Asia (Debt) |
| Richard Palmer | Director and Head of Corporate Debt |
| Ruchin Gupta | Investment Executive, Trade and Supply Chain Finance (Debt) |
| Sahil Gandhi | Portfolio Manager, Funds and Capital Partnerships (Catalyst Funds) |
| Sarah Marchand[footnote 117]. | Director, CDC Plus |
| Sarah Mathies | Investment Director, Funds and Capital Partnerships (Catalyst Funds) |
| Sebigilwe Ooke | Investment Executive, Funds and Capital Partnerships (Africa Funds) |
| Setor Lassey | Portfolio Director, Funds and Capital Partnerships (Africa Funds) |
| Sonal Premjee | Investment Executive, Funds and Capital Partnerships (Catalyst Funds) |
| Srini Nagarajan | Managing Director, Head of Asia |
| Tom Brutton | Investment Executive, Funds and Capital Partnerships (Catalyst Funds) |
| Wasim Tahir | Sector Strategist, Financial Institutions |
| External stakeholders consulted | |
| Alvaro Gonzales | Lead Economist, Global Jobs Cross-Cutting Solutions Area, World Bank |
| Kenn Especkerman-True | FCDO Evidence Review Expert |
| Lissa Glasgo | Manager, IRIS+ and Impact Measurement and Management, The Global Impact Investing Network (GIIN) |
| Maaike Platenburg | Senior Evaluations Officer, Strategy Department, FMO |
| Mahima Khanna | Economist, Development Impact, IFC |
| Mikaela Rabb | Senior Policy Associate, J-PAL Global |
| Miriam Bruhn | Senior Economist, Development Research, World Bank |
| Tatiana Didier | Senior Economist, Finance, Competitiveness and Innovation, World Bank |
| Thorsten Beck | Professor of Banking and Finance, Cass Business School |
| Timothy Ogden | Managing Director of the Financial Access Initiative, NYU-Wagner |
Methodology
Research methods
This evaluation has been informed by 3 main sources of information:
- CDC’s internal reporting and monitoring data – A combination of CDC’s internal monitoring information was utilised. These include, but are not limited to, quarterly portfolio reviews (QPRs), annual monitoring reports (AMRs), and various other development indicator datasets.[footnote 118]
-
interviews with:
- CDC investment managers responsible for direct investments, funds and risk sharing agreements – these were conducted to understand the impact of CDC’s investments
- interviews with CDC’s BI, E&S, gender, CDC Plus, and DI teams – these were conducted to understand the contribution of these interventions to the overall achievement of impact
- publicly sourced data – These were used to supplement the above 2 methods. Information/reports analysed included central bank reports, investee annual reports, press and media releases, and development and economic indicators from the World Bank, IMF, and various other statistical and developmental agencies
Footnotes
- With at least one FI investment in Africa or South Asia. Generalist funds only analysed in section 3 to portray the overall portfolio size and distribution.
- For example, loans and advances, staff numbers, number of bank branches and so on.
- Based on original cost data and includes exited investments. Funded MRPAs were included based on their utilisation. Unfunded MRPAs were based on their utilisation and a capital charge of 10% i.e. the facility size was multiplied by the utilisation and capital charge. All MRPAs shown exclusive of fees.
- Noting that 9 out of 15 were new and 2 investments were entered and exited in the same year.
-
A review of CDC’s DI theses was not undertaken as part of this assessment, but since 2017 CDC has applied more rigour to measuring development impact. ↩
-
Mainly for legacy funds pre-2012. ↩
- Treating each fund as a singular investment.
- Corporate indicators include: jobs, customers, loans, and taxes paid.
- Equitas SFB, Jana SFB, Utkarsh SFB, AU SFB, Ujjivan SFB, Fincare SFB, Suryoday SFB.
-
The much larger Indian financial system compared to other investment markets. ↩
-
The total number of studies found under each evaluation question. The size of evidence is classified according to ranges (e.g. 15-20). The aggregate strength of evidence related to size is classified according to these ranges. ↩
-
The quality scores for each study (based on a customised rubric) are aggregated and averaged per research question. The total score available for quality is 30. The average quality scores for the research questions have been classified according to ranges (e.g. 24-30). The aggregate strength of evidence related to quality is classified using these ranges. ↩
-
Development Impact Grid. ↩
-
As a proxy for the allocation of investments within India, the distribution of MFB branches reveals that 37% of all branches are in ‘A’ and ‘B’ states, 16% in ‘C’ states and 44% in ‘D’ states. 3% were in non-classified states according to the DI grid. The relative exposure to ‘D’ states is noted to be high. This method of allocating Indian investments is not accurate as branch exposure is not necessarily a proxy for loan exposure. ↩
-
Regional Education Finance Fund For Africa (REFFA) Investor Update as of 30 June 2020. MCF impact assessment, 2020, Claudia Simler. ↩
-
Corporate debt ratios have been used as a proxy for FI to GDP debt ratios as these are not easily available. This proxy is an indication of debt market liquidity in relation to FIs, including Tier 2 capital. ↩
-
Subordinated debt to existing senior debt and qualifying as Tier 2 capital – generally used to strengthen the capital base of an FI to allow it to expand its balance sheet. A slightly more limited instrument than equity, as the ability to influence strategy of an investee may be limited. Senior unsecured debt, ranking in pari-passu (on equal standing) with all senior obligations of the borrower – generally used for on-lending to any customer or specific customer segments. This type of instrument is used to encourage FIs to lend to a particular sector/segment and provide liquidity. ↩
-
Insurance companies – 3% of the portfolio, pension managers – <1% of the portfolio, asset managers <1% of the portfolio, fintechs – <3% of the portfolio and market infrastructure providers – 0% of the portfolio. ↩
-
Issuing bank limits are limits placed on the amount of trade a confirming bank can guarantee for a particular issuing bank due to internal risk allocations. ↩
-
More than three-quarters of surveyed banks (76%) highlighted the requirements on AML and KYC as the largest barrier to expanding trade finance operations. This was followed by high transaction costs and/or low fee income (59%), low credit ratings for the country where a firm is located (52%), as well as low credit ratings of banks in developing countries where they act as intermediaries for trade (51%), and low credit ratings of firms (43%). Rounding out the factors were regulatory capital requirements (48%) and global economic uncertainty such as trade tensions (41%). ↩
-
Afrexim and FirstRand South Africa. Non-African partner bank is SMBCE Limited. ↩
-
CDC’s trade finance facilities. ↩
-
13 MFIs, 6 MFBs, 2 Housing businesses, 2 Banks and 2 specialist funds were reviewed based on data availability. ↩
-
This increase from the average of 66% is driven by the introduction of MFIs into the sample in 2017 that drove the 2017 to 2019 numbers higher. The average is lower at 66% given that it is diluted by historical figures from 2013-2016. ↩
-
This may be because micro-enterprises administer a larger number of small engagements than medium and large firms. The data arising from these engagements is readily available and more conducive to causal analysis techniques such as randomised control trials (RCT) and other academic experiments. Further, large corporations are often unwilling to provide detailed financial data to the researchers conducting these studies. ↩
-
Where permitted to be shared under NDA. ↩
-
Funds with a clear mandate to invest in FIs. ↩
-
Funds that invest in FIs to build a broader diversified portfolio and whose core focus is not FIs. Therefore these FIs have been excluded. ↩
-
In addition to building technical capacity, this includes E&S, BI interventions and Value Creation Strategies. ↩
-
The total number of studies found under each evaluation question. The size of evidence is classified according to ranges (e.g. 15-20). The aggregate strength of evidence related to size is classified according to these ranges. ↩
-
The quality scores for each study (based on a customised rubric) are aggregated and averaged per research question. The total score available for quality is 30. The average quality scores for the research questions have been classified according to ranges (e.g. 24-30). The aggregate strength of evidence related to quality is classified using these ranges. ↩
-
There are 4 classifications for the direction of evidence: (1) Positive: an increase or improvement in one element is associated with a similar outcome to the other, i.e. the relationship is confirmed. (2) Inconclusive: there is mixed evidence regarding the relationship between elements, i.e. some positive and some negative associations. As such, it is not possible to judge the direction of evidence. (3) Negative: an increase or improvement in one element is not associated with an increase in another element, i.e. the relationship does not hold. (4) Insufficient: there is not enough evidence to determine the direction of evidence. ↩
-
For example, for question 1, the arrow indicates that the direction of evidence is inconclusive (as shown in the key). The circle provides information on the size and quality of evidence available for question 1. The shade of the circle indicates that the quality of the evidence is strong on aggregate (average score in range 19-23; as shown in the key). The extent of the shading indicates that the size of evidence was compelling for this research question (>20; shown in the key). ↩
-
Well-being is disaggregated into 4 sub-categories that were developed by Ogden (2019). Question 7 and 8 aggregate the evaluation of evidence for each sub-category of well-being. ↩
-
The development impact grid. ↩
-
CDC’s 2019 annual report was not publicly available at the time this document was prepared. ↩
-
CDC Annual Report 2018. ↩
-
Based on original costs and includes active and exited investments. ↩
-
It is important to note that the dollar values across the trade and supply-chain finance investments have been adjusted based on their 2019 utilisation. ↩
-
TDB Newsletter Vol 2 2018.pdf ↩
-
A diversified FI offering personal loans, business loans (BL), gold loans, asset management, home loans, investment banking among other products - CDC’s investment information in IIFL. ↩
-
Other FIs include digital financial service providers, pension funds, payments companies, HF companies, diversified product lenders, asset financiers and leasing companies. ↩
-
Other financial services include digital financial service providers, pension funds, payments companies, HF companies, diversified product lenders, asset financiers and leasing companies. ↩
-
This is more than the 90 stated in Figure 2 as it includes 90 unique investments that have only been invested in by generalist funds and additionally 6 investments that have received funding from other products and generalist funds (categorised as mixed in Figure 2). ↩
-
On equal standing. ↩
-
A value analysis of these investments has not been provided in order to evaluate each investment on an equal footing. ↩
-
Includes significantly underperforming and marginally underperforming investments. ↩
-
Some investments may have been impacted by several of these categories at once; the investments have been categorised by the prevailing factor. ↩
-
These investments were in funds under pre-2012 strategies; CDC investments have exhibited fewer BI issues as CDC’s approach has become more robust and more focused on supporting investees. ↩
-
Does not include debt funds as the evolution of loans over this period has not been provided. ↩
-
BMCE/BOA annual report 2019. ↩
-
Information available from SFB annual reports. ↩
-
Prior to becoming SFBs, Janalakshmi, Ujjivan and Equitas had the first, third and fifth largest loans portfolio in the MFI sector – The Bharat Microfinance Report 2016. ↩
-
Global Outreach & Financial Performance Benchmark Report – 2017-2018. ↩
-
A commonly cited factor is the relatively low rural population density in Africa, which leads to higher costs per borrower. In addition, weak regulatory capacity across fragmented African financial markets plays a role. Traditionally, savings and credit co-operative societies (SACCOs) have also played a significant role in Africa, in some instances dampening the potential for MFIs. ↩
-
Mix Market – Global Outreach & Financial Performance Benchmark Report – 2017-2018. ↩
-
Combined CDC investment of USD 3.2 million in Africa and USD 246 million invested in MFIs in India. ↩
-
Debt Funds have been excluded from this analysis. ↩
-
Source IMF - Financial Market Development Database. ↩
-
Market Watch. ↩
-
CDC’s FI sector strategy. ↩
-
CDC’s Sierra Leone facility investment information. ↩
-
CDC’s FI sector strategy. ↩
-
Habib Bank privatisation information, 2004, AKDN. ↩
-
CDC’s FI sector strategy. ↩
-
Information on CDC’s investment in HBL. ↩
-
HBL annual reports. ↩
-
Estimated based on CDC’s investment available on the website and media articles. ↩
-
Once SFBs hit an INR 5 billion capital base or have been an SFB for 3 years. ↩
-
2019 Annual African PE Data Tracker and Africa Private Equity IPOs. ↩
-
2019 Trade Finance Gaps, Growth, and Jobs Survey, ADB. ↩
-
2019 Trade Finance Gaps, Growth, and Jobs Survey, ADB. ↩
-
Trade Finance in Africa Overcoming Challenges, AfDB, 2017. ↩
-
2018 Global Trade – Securing Future Growth ICC Global Survey on Trade Finance. ↩
-
Weighted by facility size. ↩
-
Averages are calculated by excluding new/topped up facilities for a period of one year to allow utilisation to stabilise. ↩
-
All facilities have been below 30% with the exception of one at 50%. ↩
-
It is noted that concentration is based on GDP size and activity within a country, although there are many relatively large economies in Africa that are not supported, and these include Angola, Ethiopia, DRC, and others. ↩
-
Financing provided in either recessions or crises. ↩
-
Pre-COVID-19 outbreak ↩
-
2014-2016 Ebola Outbreak in West Africa, Centres for Disease Control and Prevention. ↩
-
Lessons from CDC’s Ebola facility. ↩
-
Africa capitalization fund invests in NBS bank to support Malawi SME agriculture sectors and Africa Bank Capitalisation Fund - all information on loans can be sourced from respective annual reports of the banks given that most of them are regulated by Central Banks. ↩
-
IFC Africa capitalisation fund, CDC’s investment information. ↩
-
Ghana: Founder of collapsed UT Bank Kofi Amoabeng faces allegations of theft and money laundering. ↩
-
All the banking investments of this fund are regulated by various Central Banks and their performance is publicly available. ↩
-
The fund’s equity stakes are publicly available. ↩
-
There were a few investments with data available from earlier than 2013, but not enough to make a meaningful analysis. Consequently, these years were excluded. ↩
-
HBL Annual Accounts. ↩
-
Khushhalibank Annual Report 2019. ↩
-
There was too little data available for the years 2009-2012 to perform meaningful analysis, leading to the decision to focus on the 2013-2019 period. ↩
-
Genesis team analysis, 2020. ↩
-
HBL Annual Accounts. ↩
-
Due to a lack of consistently available data, the housing companies and other funds were excluded from this analysis in order to avoid distorting the results. ↩
-
Due to a lack of consistently available data, the housing companies and other funds were excluded from this analysis in order to avoid distorting the results. ↩
-
Genesis team analysis, 2020. ↩
-
HBL Annual Accounts. ↩
-
The drop in 2019 data for banks is due to a reporting methodology change by HBL, whereby the evaluation team had to estimate the 2019 percentage based on Nisa account customer numbers. ↩
-
Drop in MFI resulting from a relatively lower ratio. ↩
-
Genesis team analysis, 2020. ↩
-
HBL Annual Accounts. ↩
-
What is the impact of investing in financial systems?, Timothy Ogden, NYU-Wagner, 2019. ↩
-
Financial inclusion is complex and can be defined in broad or narrow terms. If the definition of financial inclusion is too narrow, it is unlikely that it will be relevant to the CDC FI impact framework. ↩
-
This includes those suffering from transitory poverty. ↩
-
This can include the product design, delivery of products, incentives for use for investment, structure of repayment, and financial literacy programmes. ↩
-
These buffers are generally generated through Basel III implementation and/or prudential financial regulations. ↩
-
ESG Toolkit for Fund Managers. ↩
-
MCF Impact Assessment, 2020, Claudia Simler. ↩
-
Subordinated debt to existing senior debt and qualifying as Tier 2 capital – generally used to strengthen the capital base of an FI to allow it to expand its balance sheet. A slightly more limited instrument than equity, as the ability to influence strategy of an investee may be limited. Senior unsecured debt, ranking in pari-passu (on equal standing) with all senior obligations of the borrower – generally used for on-lending to any customer or specific customer segments. This type of instrument is used to encourage FIs to lend to a particular sector/segment and provide liquidity. ↩
-
Insurance companies - 3% of the portfolio, pension managers - <1% of the portfolio, asset managers <1% of the portfolio, fintechs - <3% of the portfolio and market infrastructure providers – 0% in the portfolio. ↩
-
Issuing bank limits are limits placed on the amount of trade a confirming bank can guarantee for a particular issuing bank due to internal risk allocations. ↩
-
More than three-quarters of surveyed banks (76%) highlighted the requirements on AML and KYC as the largest barrier to expanding trade finance operations. This was followed by high transaction costs and/or low fee income (59%), low credit ratings for the country where a firm is located (52%), as well as low credit ratings of banks in developing countries where they act as intermediaries for trade (51%), and low credit ratings of firms (43%). Rounding out the factors were regulatory capital requirements (48%) and global economic uncertainty such as trade tensions (41%). ↩
-
Afrexim and FirstRand South Africa and SMBCE is the third bank. ↩
-
CDC’s trade finance investment information. ↩
-
13 MFIs, 6 MFBs, 2 Housing businesses, 2 Banks and 2 specialist funds were reviewed based on data availability. ↩
-
This increase from the average of 66% is driven by the introduction of some FIs into the sample in 2017, which drove the 2017 to 2019 numbers higher. The average is lower at 66% given that it is diluted by historical figures from 2013-2016 ↩
-
Consulted via email. ↩
-
Under strict confidentiality conditions consistent with CDC’s investment agreements. ↩