Main report
Published 22 October 2019

© Crown copyright 2019
This publication is licensed under the terms of the Open Government Licence v3.0 except where otherwise stated. To view this licence, visit nationalarchives.gov.uk/doc/open-government-licence/version/3 or write to the Information Policy Team, The National Archives, Kew, London TW9 4DU, or email: psi@nationalarchives.gov.uk.
Where we have identified any third party copyright information you will need to obtain permission from the copyright holders concerned.
This publication is available at https://www.gov.uk/government/publications/employment-pathways-and-occupational-change-after-childbirth/main-report
Employment pathways and occupational change after childbirth
Susan Harkness, Magda Borkowska and Alina Pelikh
October 2019
Executive summary
There is a large body of international evidence showing that women with children suffer large pay penalties (Harkness and Waldfogel, 2003). A potential explanation for this is that taking time out of the labour force or returning to work part-time may be damaging for career progression (Costa Dias, Joyce and Parodi, 2018; Waldfogel, 1998). If this is the case, the employment trajectories that women follow in the years following birth will have important implications for women’s future pay. Alternatively, on their return to work women may take up jobs with lower occupational status than those they held previously, or their careers may progress at a slower rate than those of childless women or men. In either case this may contribute to a fall in the relative earnings of mothers.
Moreover, the competing demands of work and families may be greater in some jobs than others and if this is the case we might expect the risk of occupational downgrading, and of exiting employment or moving to part-time work, to vary across industries or occupations.
Using data from Understanding Society for 2009 to 2010 to 2016 to 2017, this report assesses the extent to which women, by opting out of employment, moving to part-time work or to jobs with lower occupational status, ‘downgrade’ their careers following childbirth. We examine how the careers of new mothers and fathers progress between the year before birth and either 3 or 5 years after (we observe 2,281 new mothers for 3 years, and 1,199 for 5). Using sequence analysis, we build a rich descriptive picture of the typical employment pathways men and women follow after birth. The report then examines how a broad range of pre-birth job characteristics (such as working hours, industry or sector) and personal and family characteristics (such as age at birth, education and number of children) influence the chance of moving out of the labour force, into part- or full-time work, and the probability of occupational down (or up) grading. The final part of the report examines how, among couples, patterns of ‘breadwinning,’ described by the employment status and relative earnings shares of men and women within couples, evolve over the same period.
Work patterns 3 to 5 years after childbirth
There are large divergences in men’s and women’s employment trajectories in the years following childbirth. While mothers increasingly withdraw from full-time employment over time, new fathers typically remain in full-time work or, if not employed full-time prior to birth, move into it.
For mothers, we find that fewer than one-fifth of all new mothers, and 29% of first time mothers, follow a full-time career after maternity leave.
Among those working full-time prior to childbirth, a majority either stop working or move to part-time work – just 44% returned to, and remained in full-time work 3 years after birth, with this share falling to 31% over 5 years.
There is considerable persistence in the labour force behaviour of mothers in the 3 years after birth (following a period of maternity leave) – women tend to remain in full- or part-time work, or stay outside the labour force, with little movement between states.
Over 5 years, there is more movement between employment statuses:
- 6% of those returning to full-time work shift to part-time employment
- 6% of part-time returners leave employment
- those who leave the labour market are rarely observed to return
For those who do not return full-time after birth, transitions into full-time work in the 5 years after birth are rare:
- 4% of women return to work part-time before becoming full-time
- fewer than 1% leave employment before moving into full-time work
Women’s employment trajectories differ sharply from those of fathers: 3 years after childbirth 90% of men are in full-time work or self-employed, and those that do change their employment status are likely to move from being out of the labour force or part-time work into full-time jobs after birth.
What influences patterns of returning to work?
The second part of our analysis examined the factors expected to affect women’s decisions about returning to work.
Examining the influence of personal and family characteristics, such as age, education and number of children, on patterns or return to work we find that an important predictor of the likelihood of returning to full-time work is prior employment status, with those working full-time prior to birth 8 times more likely to work full-time than those who had previously worked part-time.
Those with degrees are twice as likely to go back to work full-time as those with lower levels of education, while those with the lowest level of education (whose highest qualification was GCSE or equivalent) were the least likely to return to work at all (either full- or part-time).
When controlling for employment status prior to birth, patterns of return to work are independent of mothers age at the time of birth, how many children she already had, or whether she was single.
Women whose own mothers were working when they were age 14 are nearly twice as likely to return to employment as those whose mothers did not work, which suggests that culture plays an important role in mothers’ employment decisions.
A particularly significant finding is that, once account is taken for women’s employment status prior to birth, the number of children they have does not affect their subsequent employment pathways. Instead, it is the employment status of women prior to birth, rather than the number of children they have, that is the most important factor influencing the probability of returning to full-time work. Nonetheless, it remains the case that the birth of a child is associated with a reduced probability of full-time work, with each birth having an independent
effect on reducing the probability of returning to full-time work. As a result, the more children a woman has the lower the likelihood she will work full-time. The role of prior employment status in predicting the likelihood of returning to work is important and suggests that policy should focus on getting women into work before they have children if they are to achieve economic equality in later life.
Assessing the influence of job characteristics, such as industry, occupation and working hours, on returning to work we find the industry that women worked in before birth is only weakly related to patterns of return to work:
- those working in education are more likely to return to work, either full-or part-time
- we do not observe any differences in patterns of return to work between those in other industries, including health and finance
Women who worked in the public sector or in large firms (with more than 50 employees) were more likely to return to work, either full or part-time.
Women working in occupations where there is a large number of part-time workers are less likely to return to full-time work.
The results also suggest strong similarities between the factors influencing the probability of returning to part-time work and leaving the labour market. We also observe movement between these 2 states, but little movement from either of them into full-time employment. This suggests that part-time work is not typically a substitute for working full-time and, as other studies have shown, is rarely a ‘stepping’ stone into full-time work (Booth, Francesconi and Frank, 2002).
Finally, it is important to note that 30% of new mothers were not working in the year before birth and fewer than a quarter return to work subsequently. One-quarter of these women had never held a job. Those who were persistently outside the labour force were typically younger, less educated and more likely to be single than those that held a job prior to childbirth.
Moving on? Occupational mobility following childbirth
The report shows that occupational change is a gradual process which takes place 3 to 5 years after birth. Women almost always return to a job with the same occupational status as the one they left. Over time, it is not occupational downgrading, but rather a reduction in the probability of upgrading, which reduces the likelihood of mothers progressing at work.
5 years after childbirth we find that:
-
the chance of having occupationally upgraded is far lower for women than men
-
while 26% of men have moved to a job with a higher occupational status, for women this figure is just 13%
-
on the other hand, the risk of downgrading is similar for new mothers and fathers, at 18% for both men and women
- 18% of women and 4% of men had left employment
- there is no difference in occupational mobility between women who return full- or part-time, but those who have a break from employment are more likely to downgrade
For new mothers – but not fathers – staying with the same employer is associated with a lower risk of downward occupational mobility but also with lower chances of progressing (upgrading). These returners risk becoming stuck in their job role, with limited career progression. Similarly, for mothers, working in the public sector, or in health or education, is linked with the ability to maintain the same occupational grade after childbirth but with lower chances of career progression.
We also investigate whether women are opting for more family friendly jobs and willing to downgrade to achieve this. Changes in working hours are not significantly related to the risk of changing occupational status. However, increased commuting time is strongly linked with increased upward occupational mobility: those whose daily commute increases by more than 10 minutes are 4 times more likely to upgrade. However, reduced commuting time has no impact on mobility.
Couples
The analysis of couples’ employment outcomes suggests that gendered labour market patterns – observed prior to birth – are reinforced in the years following birth as the employment trajectories and earnings shares of men and women in couples diverge.
Among couples where both partners worked full-time prior to birth we find that:
-
48% were both employed full-time 3 years later
-
in 36% of couples, the woman moved to part-time work with the male partner continuing to work full-time
-
in 15% of couples the woman left employment and the man continued to work full-time
Among couples where the man worked full-time and the woman either worked part-time or was out of the labour force, childbirth had a smaller effect on household employment.
Looking at men and women in couples’ relative earnings (rather than employment) in the year before birth we find that:
- the man was the main earner in 54% of couples – with one-fifth of couples having a sole main earner and in a further 31% the man was the main earner
- in 31% of couples, partners earned equal shares
- 12% had a female main breadwinner and a further 2% a sole female earner
3 years after birth:
- 69% of families had a sole male earner or male breadwinner
-
the share of couples where men and women earned equal shares fell to 20%
- if men were the sole or main earner prior to birth they almost always remained the sole or main breadwinner
- among those couples where both partners earned equal shares prior to birth, 3 years later 19% were headed by a sole male earner and 31% by a male breadwinner
- in the 10% of couples where the woman was the main breadwinner prior to birth, in almost half (46%) women remained the main earner while a further 23% became ‘equal’ earners
Those who earned more than their partner prior to birth were 4 times more likely to return to full-time work than women who were in families where the man was the main earner. Yet, in terms of career progression, we find little evidence that being a main earner either enhances or diminishes women’s chance of career progression vis-à-vis other mothers.
Concluding summary
The results highlight how gendered employment patterns are following childbirth, with men typically remaining in full-time work (or moving into it) and women withdrawing from full-time work. Those women who return to employment typically see their chance of moving up the occupational ladder decrease. A limitation of this study is that we have only be able to examine trajectories 3- to 5-years after birth. The evidence, however, shows that the pay gap widens as women age and the results presented here hint at some reasons for this (ONS, 2018). First, we show large divergences in men and women’s employment trajectories in the years following childbirth, with men moving towards full-time work and women increasingly withdrawing from it (by either moving into part-time work or exiting the labour market). Second, the risk of occupational up or downgrading over 3 years is the same for women who return to work either full or part-time.
However, those that return to work following a break are more likely to occupationally downgrade. Finally, even when women return to the same job, we show that they are far less likely than their male counterparts to progress at work. These factors together suggest that the patterns observed in the 5 years after birth are unlikely to be reversed as children grow older.
1. Introduction
This report examines the employment trajectories of men and women following the birth of a child, and how individual, family and employment characteristics observed prior to childbirth influence employment trajectories and the probability of occupational downgrading (or upgrading) up to 5 years after birth.
Using 8 waves of longitudinal data from Understanding Society, from 2009 to 2010 to 2016 to 2017, we address the following questions about men and women’s patterns of return to work, occupational mobility and couples’ careers.
1.1 Returning to work
What evidence is there that women – by opting out of employment, moving to part-time work or taking time out of employment – retreat from employment following childbirth?
Over what period of time do moves out of, or back into, the labour market occur?
What factors are associated with women moving out of employment or reducing their working hours? In particular:
-
how do employment trajectories vary according to the occupations or industries in which men and women worked prior to birth?
-
what is the influence of individual and family circumstances on the probability of returning to work full or part-time?
1.2 Occupational mobility
How are the employment trajectories of women followed after childbirth linked to occupational mobility, and how do pre-birth job characteristics affect the chance of change?
Why does occupational downgrading occur?
What is the evidence that women occupationally downgrade in order to access different working conditions that are more conducive to caring? (for example, flexible working, working closer to home).
1.3 Couples’ careers
How are the employment trajectories of men and women within couples linked in the years following childbirth?
In particular, how do patterns of ‘breadwinning’ within the household influence subsequent career trajectories of men and women following childbirth?
The report is structured as follows. First, we briefly review the relevant literature on maternal employment and occupational downgrading. We then describe our data and methods before presenting the results and concluding. The methods and results sections are each described in 4 parts. The first shows the employment trajectories of men and women following childbirth. Using sequence analysis, we produce a rich descriptive picture of the typical pathways by which employment downgrading occurs in the years following childbirth. Observing multiple transitions across different states, we identify the most common pathways in the data; for example, we can assess the share of women who return to work full-time but subsequently move to part-time work and the share of those who leave the labour force following childbirth but later return to employment. By coding these transitions, we are able to show how common different pathways are, allowing us to understand the ‘typical’ employment pathways followed after childbirth. While our main focus is on women, we produce the same descriptive statistics for men to illustrate how male and female employment pathways diverge in the years following birth.
The second part examines the mechanisms associated with different employment trajectories, highlighting the role of pre-birth working conditions in determining post-birth employment outcomes. In particular, we investigate how industry, occupation and other job characteristics (observed prior to birth) facilitate or constrain mothers’ employment in the years following birth by examining their impact on the probability of following different employment pathways (described by the sequences found in the first stage of the analysis).
The third part assesses the extent to which the employment trajectories followed after birth are associated with the risk of occupational downgrading. Specifically, we examine associations between different employment trajectories and job changes, and between job changes and moves to better or worse occupations (occupational up or downgrading). We also assess the extent to which changes in occupational status are linked to changes in other working conditions. In particular, we examine whether women shift to lower status jobs that are more conducive to work- life balance; for example, those with greater access to flexible working or with shorter commuting time.
The final part of our analysis focuses on the post-birth careers of couples. We examine the inter- relationship between couples’ careers, looking at whether fathers’ career progression is correlated with mothers’ occupational downgrading. We also examine the relationship between couples’ career trajectories and pre-birth circumstances, in particular couples’ earnings differences.
Defining ‘downgrading’
We assess the impact of childbirth on 2 forms of ‘downgrading’ which we term employment downgrading and occupational downgrading.
Employment downgrading is defined as moves from full-time work either to part-time work or out of the labour force, both of which are associated with reduced future career opportunities (vis-à-vis continuing in full-time work).
Occupational downgrading (or upgrading) is defined as movement from a higher paid occupation to one with lower (or higher) pay.
2. Background and literature review
This section summarises the literature motivating our research question. We start by briefly reviewing the literature on the pay penalty to motherhood and the potential role of employment and occupational trajectories in contributing to it. We then review the evidence on how time out of employment or moves to part-time work may influence employment and career progression after childbirth, and at the influence of job characteristics on pay penalties to motherhood. The final sections discuss the role of individual and family characteristics in influencing careers in the years following childbirth, and the impact of children on men’s careers and employment.
2.1 The pay penalty to motherhood
There is a large body of international evidence showing that women with children suffer large pay penalties. The size of these penalties is particularly large in the UK, especially where women have more than one child (Harkness and Waldfogel, 2003). Not only are motherhood pay penalties large, but the employment gap between mothers and childless women is also considerable, particularly for full-time work (Budig and England, 2001; Harkness, 2016). Taking time out of the labour force or moving to part time work following childbirth is a potentially important explanation for the motherhood pay penalty. Many new mothers withdraw from the labour market following childbirth or move to jobs with fewer demands in order to accommodate caring responsibilities. This loss in work experience, and in particular full-time work experience, is an important part of the explanation for the maternal pay gap (Costa Dias, Joyce and Parodi, 2018). Moreover, losses in work experience tend to accumulate in the years following childbirth, meaning that the motherhood pay gap is larger for women with older children - for whom career disadvantage has accumulated - than those whose children are young. For many mothers, earnings stagnate, rather than fall, following childbirth and it is the absence of earnings growth that is a critical source of the maternal pay gap (Harkness, 2016). In order to understand how children affect women’s labour market position we therefore need to consider the effect of children on women’s employment and earnings over a sustained period of time.
2.2 Female career progression after childbirth
2.2.1 Time out of employment and career progression after childbirth
Time out of the labour force may also have an impact on women’s careers even if the spell out of employment is brief. Previous studies for the US and UK have shown that the pay gap is larger for women who do not return to their previous job because they do not have access to maternity leave (Waldfogel, 1998; 1999). Similarly, studies have shown that mothers of young children have little career mobility. For example, Aisenbrey, Evertsson and Grunow’s (2009) study of women returning to work after childbirth in Germany, Sweden and the US finds that, while the timing of return varies across countries, most mothers return to the same job, or one that is similar to that held prior to the break, but that both upward and downward career mobility (which they define by jobs’ ‘occupational prestige’) are less common among new mothers. However, they also find a ‘punishment’ associated with time out of the labour force following childbirth, including taking longer maternity or parental leave. In all countries, the chances of career progression were lower the longer women were out of the labour market following childbirth, although declining career prospects were particularly evident in the US where the probability of moving to a job with higher prestige fell, and the probability of moving to a lower prestige occupation increased with the length of time out of work.
Part-time work may have a similarly damaging effect on employment; studies have shown that part-time work experience attracts only a modest wage premium (Harkness, 1996; Costa Dias, Joyce and Parodi, 2018), while moving from full-time to part-time work is associated with occupational downgrading (Connolly and Gregory, 2008; Paull, 2018) particularly following childbirth (Dex, Ward and Joshi, 2008). Women in high status occupations or working in male dominated occupations with few part-time jobs are particularly likely to downgrade (Dex and Bukodi, 2012).
2.2.2 Pre-birth job characteristics and career progression after childbirth
Until recently, job characteristics have attracted relatively little attention in the academic literature on the pay gap, in spite of having potentially important implications for our understanding of the pay gap. In particular, job characteristics measured before the birth of a child may influence whether women return to work, and the conditions of their return (for example, whether they return to the same job, occupationally downgrade or move to part-time work). This is likely to be of central importance to understanding the pay gap because, if women are discouraged from returning to work after childbirth, or if they return part-time, they are likely to face long-term pay penalties as a result of lost work experience (Costa Dias, Joyce and Parodi, 2018) and gaps in their employment history. Previous studies have not investigated whether there are important differences between jobs in women’s patterns of return to work. Yet if, for example, the competing demands of work and families are greater in some occupations or industries than others, this may influence the probability that women do not return to work following childbirth or, if they do, may be more likely to come back to work part-time or face greater occupational penalties. Differences in women’s career opportunities have been observed in studies of the US. Goldin (2014) shows that careers in health-related professions, such as pharmacy, have far smaller wage penalties to short working hours or flexible working, while favourable working conditions mean that women have shorter absences from the labour market following maternity and small hourly wage gaps (see also Goldin and Katz, 2016). Women in business-related occupations, however, fare less well. Understanding the importance of occupation and employment structures to women’s prospects following childbirth may provide information which is crucial to understanding and eliminating the pay gap.
Indeed, Goldin argues:
“The solution [to the pay gap] does not (necessarily) have to involve government intervention and it need not make men more responsible in the home (although that wouldn’t hurt). But it must involve changes in the labor market, especially how jobs are structured and remunerated to enhance temporal flexibility. The gender gap in pay would be considerably reduced and might vanish altogether if firms did not have an incentive to disproportionately reward individuals who labored long hours and worked particular hours. Such change has taken off in various sectors, such as technology, science, and health, but is less apparent in the corporate, financial, and legal worlds.” (Goldin, 2014, p.1091).
Recent research has examined how occupational characteristics (measured using O*NET data) influence the maternal pay gap in the US. These studies find that pay gaps are smaller in jobs where workers have greater autonomy, require less team work or apply less competitive pressure (Yu and Kuo, 2017).
To date, the evidence on employment characteristics and the gender pay gap has focussed on data for the US where labour market participation rates, particularly for less educated women, are far higher than in the UK, and maternal pay gaps are much smaller. Moreover, in the US women are much more likely to remain in continuous full-time employment following childbirth, and this is linked to smaller pay gaps (Lundberg and Rose, 2000). Data from the BHPS, on the other hand, shows that fewer than 10% of women maintained continuous full-time employment after having children (Harkness, 2016) and that many mothers employment trajectories are unstable following childbirth, regardless of their level of education (Stewart, 2014). More generally, Mandel and Semyonov (2006) point to substantial differences across countries in maternal pay gaps and suggest that, while ‘family friendly’ policies (including long maternity leave and part-time work) are associated with increases in maternal employment, they are also linked to a higher concentration of women in low status jobs. As a result, while occupational differences in employment and earnings gaps after childbirth may exist, there are good reasons to expect that these may not follow the same pattern as in the US. There are also good reasons to suspect that women in the UK may have made less progress, even within the progressive occupations that Goldin identifies. As a result, we might expect mothers in the UK to face larger maternal pay gaps across all occupations, and to observe less variation between them, than in the US. Providing new evidence on differences in the effect of maternity on employment trajectories across occupations in the UK, therefore, fills an important evidence gap.
2.2.3 Individual and family characteristics and career progression after childbirth
Individual characteristics are likely to play an important role in influencing the risk of occupational downgrading. Age at the time of first birth, for example, may be an important determinant of whether women are able to return to work. Women who are older when their first child is born are much more likely to have resources that they can draw on to allow them to maintain continuous employment. Similarly, there may be educational differences in career progression; for example, if the penalties to time out-of-work are greater for those with higher levels of education they will have greater incentive to maintain their employment status.
There is also substantial evidence that family circumstances matter to women’s careers. Having a second child, for example, is strongly associated with moves out of the labour market and considerably larger employment and wage penalties compared to having one child (Harkness and Waldfogel, 2003). There is also evidence that married mothers, ceteris paribus, may have larger motherhood penalties than those who cohabit or are single, as the relative security of marriage may encourage greater specialisation within couples (Budig and England, 2001; Loughran and Zissimoupoulous, 2009; Harkness, 2016). For those in couples the job status of men’s and women’s partners also matters; for example, men having a working partner is associated with lower wages (Killewald, 2013) and it may also be the case that mothers similarly fare less well where fathers work long hours.
2.3 Male career progression after childbirth
While women’s careers, on average, slow after childbirth, for men the reverse is true. The ‘fatherhood’ pay premium leads to increasing divergences in the pay of mothers and fathers (Lundberg and Rose, 2000; Killewald and Gough, 2013). However, men are not always immune to the career costs of children: there is evidence, for example, that fathers do less well when their partners work (Blackaby, Jacobsen and Rayak, 1996; Carlin and Murphy, 1998; Killewald, 2013), while a recent study for Norway suggests that men taking paternity leave was associated with reduced earnings 5 years later (Rege and Solli, 2013). As men play an increasing role in caring for children in the UK, too, fatherhood penalties may be more likely to emerge. Understanding how family circumstances affect the employment and wage prospects of men can therefore also provide insights into the mechanisms driving gender inequalities.
3. Data and methods
3.1 Data and sample
We use Understanding Society (UKHLS) data, which is the best source of longitudinal data available in the UK, to examine the evolution of employment and earnings up to 5 years after childbirth. UKHLS data has been collected since 2010 and 8 waves of data are currently available. The data contains detailed information on individuals and other household members, including the partners of women in couples. This allows us to examine how job characteristics and family context influence employment trajectories and occupational mobility following childbirth.
From Wave 2 on, we observe between 542 and 1,099 new births to mothers each year. The number of new fathers is smaller, as only those living with the mother are observed. We include all new mothers and fathers in our sample, whether in work prior to birth or not.
Post-birth employment trajectories are described for all those observed prior to childbirth. Sequences are described using retrospective data, which is collected each year, on individuals’ monthly employment status 3 years (36 months) or 5 years (60 months) after birth. Using sequence analysis, we then construct employment trajectories for men and women 3- and 5-years after birth. All those for whom we have information on employment status prior to birth are included in the sample, with sample sizes of 2,281 and 1,199 for the 3 and 5-year sequences respectively for women, and 1,687 and 867 for men. Of our sample of new mothers,
43% are first-time mothers. Shares for fathers are similar (although we do not observe fathers with children living outside the household).
3.2 Variables and definitions
3.2.1 Work patterns following childbirth
We define employment and occupational status prior to childbirth using information observed in the previous wave. Because some women are interviewed before the date-of-birth of their child, and have already stopped working, we supplement this data with information on job characteristics measured 10-months prior to birth for these women. Using this information, we group new parents into the following categories:
3.2.2 Job returners
Those who were full or part-time employees, or self-employed, prior to birth and who returned to work (in any of these statuses) at any point over the subsequent 3- or 5-years after birth, regardless of the timing or duration of return.
3.2.3 Non-returners
Those who were in work prior to birth but are not observed to return to work in subsequent years.
These 2 groups make up our potential returners.
A third group are not in work prior to birth but may take up work, or remain outside the labour market, following birth. As we show below, very few women who were not working prior to childbirth subsequently returned to employment.
In order to understand patterns of return to work we examine movements between:
- paternity or maternity leave
- being out of the labour force
- unemployment
- self-employment
- part-time work
- full-time work
Women are defined as being on maternity leave if they report having a job and being on leave. Those who report having a job but do not report taking any time off following birth are assumed to have taken 2 months maternity leave. This encompasses a legal requirement for
employees to take a minimum of 2 weeks’ compulsory maternity leave, or 4 weeks for those working in factories, as well as allowing for mis-reporting. The results are not sensitive to this choice of threshold as patterns of return are unaffected.
As is common in the literature, full-time workers are defined as those working 30-hours or more a week and part-time workers as those working fewer than 30-hours.
The group of workers who are described as ‘self-employed’ includes both the self-employed and a small group of employees who do not report their working hours, and whom we are unable to classify as full or part-time.
3.2.4 Occupational mobility: downgrading and upgrading
We assessed 2 different measures of occupational mobility. The results discussed in this report are based on detailed occupational rankings derived from the 3-digit SOC2000 occupational code. Rankings are constructed by linking occupational codes to published information on median gross hourly wages by occupation in 2011. This information is reported by the ONS and derived from the Annual Survey of Hours and Earnings. Occupations are then ranked by median wages. There are a total of 83 occupational groups, and 77 occupational rankings, among men and women in our sample. Using this information, we define occupational upgrading as moving to an occupation with a higher median wage and downgrading as moves to a lower waged occupation.
In order to check the robustness of our results to alternative definitions of occupational upgrading or downgrading, we also examined measures of occupational downgrading based on a measure of occupational class, NS-SEC, which has 8 hierarchical categories: 1) large employers and higher management; 2) higher professional; 3) lower management and professional; 4) intermediate; 5) small employers and own account; 6) lower supervisory and technical; 7) semi- routine; and 8) routine occupations. Again, those that move up the NS-SEC classification are assumed to upgrade, and those who move down to downgrade. The results from this alternative definition were very similar to those using the more detailed classification and for this reason are not reported.
3.2.5 Job characteristics
A central concern of this report is the question of whether the characteristics of jobs held before birth influence subsequent employment trajectories and the risk of occupational downgrading. We assess how a broad range of job characteristics influence post-birth employment outcomes. The characteristics examined are:
- occupation – professional or managerial, intermediate, routine
- industry – retail, finance, education, health, public administration, voluntary
- sector – public, private, third
- firm size – fewer than 10; 10 to 49; 50 to 199 and 200 or more employees
- working hours
- share of workers employed part-time by occupational category – less than 25% of workers, 25% to 49%, and 50% or more
The industries selected are the same as those used by Goldin (2014), who described important differences in wage gaps across these industrial groupings for women in the US.
We examined the influence of several further measures of working conditions, including flexible working and autonomy over job tasks, on post-birth employment outcomes. As these were not found to be significantly related to employment outcomes they are not reported in the subsequent analysis.
Finally, in order to see if we could shed any light on why women may ‘choose’ to reduce their work hours or occupationally downgrade, we also assessed the impact of childbirth on:
- the likelihood of moving to a new employer
- changes in commuting time
- changes in working hours
3.2.6 Individual and family characteristics
Individual and family characteristics are also measured in the wave prior to birth. We include controls for individual and family characteristics expected to influence the probability of employment. These are:
- age at time of birth (3 dummy variables: age under 25, 25 to 34 and over 34)
- number of children (dummy variables for none, one and two or more)
- whether partnered or single
- health problems (defined as health limits daily activity)
Ethnicity (non-white) was also controlled for, but as it was not significant, was excluded from the final models.
We also describe measures of attitudes towards work and family life, which are available in waves 2 and 4 of the UKHLS and include questions on whether both husband and wife should contribute to household income, whether husband should work and wife should stay at home, and whether family suffers when mother works full-time. However, as these measures are only available for a limited number of waves, and because of the potential endogeneity of these measures with respect to employment outcomes, we do not include them as controls in the final models.
We do, however, know whether women’s own mothers worked when they were age 14. As this is likely to be a good proxy for attitudes towards mothers working, and is not subject to the same problems of endogeneity bias as attitudinal measures, it is included in the final models.
3.2.7 Couples’ employment and earnings
For those in couples, the employment status and earnings of partners may have an influence on individuals’ employment trajectories. Looking at couples only, we examine the effect of partners’ employment status (using the same definitions as those for individuals, described above) and relative earnings on individuals’ employment trajectories and occupational mobility. We describe couples as ‘male breadwinner’, equal earner or ‘female breadwinner’ families. These are defined as:
- male breadwinner families: are defined as those where the man earns 60% or more of the sum of the head and spouses’ joint gross weekly earnings
- female breadwinner families: are defined as those where the woman earns 60% or more of the sum of the head and spouses’ joint gross weekly earnings
- equal earners are defined as those where each partner brings in between 40% and 60% of joint earnings
- sole male earner
- sole female earner
3.3 Methodology
3.3.1 Sequence analysis: employment trajectories following childbirth
The first step of our analysis examines employment pathways following child birth. Rather than focussing on single career transitions between 2 points in time (for example, pre-birth and 5 years after), to gain a more holistic picture of parents’ career development following childbirth we use sequence analysis to investigate employment trajectories. Sequence analysis is an increasingly popular tool for analysing life courses, which allows us to produce a rich and holistic picture of the typical trajectories that individuals follow. Using this technique, we are able to develop a set of typologies which describe the most common employment pathways taken following childbirth. This can help us understand, for example, whether employment downgrading 3 or 5 years after birth is most commonly a result of women leaving employment following childbirth and gradually returning to part-time employment or whether, conversely, women are more likely to have returned to work after having children but then increasingly withdraw from employment over time.
We first define the possible states that may occur in a sequence. This generates a large set of possible combinations, some of which may not occur in our data or may occur only infrequently. Sequences are defined over monthly intervals following birth (for 36 or 60 months) and are defined with respect to:
- full-time work
- part-time work
-
being self-employed
- not working at all (out of the labour force and unemployed are initially defined as separate states)
- holding a job but being on maternity leave (which may occur repeatedly if mothers have subsequent birth)
Using sequence analysis, each individual’s life course is then visualised as a sequence of monthly events, allowing us to compare individual sequences and identify common types. The degree of (dis)similarity between sequences in the data can then be identified. Similarity of sequences is defined with respect to the number, type, order, and duration of states. We adopt Dynamic Hamming Distance (DHD) measures to identify sequences (Lesnard, 2010). We then identify different types of employment trajectories by applying cluster analysis to the observed sequences using Ward’s hierarchical clustering algorithm. This process enables us to reduce a large number of idiosyncratic sequences into sets of similar groupings, allowing us to classify individuals into typologies based on their post-birth employment trajectories. The results of the cluster analysis are descriptively interesting in themselves, as they reveal the most common employment pathways following childbirth and illustrate how employment downgrading typically occurs. The clusters are then used in the subsequent analysis to identify the individual and job characteristics most closely related to employment downgrading.
3.3.2 Predicting employment pathways following birth: multinomial logit models
The second stage of our analysis examines the factors which are associated with the risk of employment downgrading. To assess this, we model the chance of following particular sequences as a function of job, individual and family characteristics. All are observed prior to birth. From this point on we turn our attention to ‘potential returners,’ whom we defined as those who were in employment, including self-employment, prior to birth.
Following Anyadike-Danes and McVicar (2010), we use a multinomial logit model to predict the probability that a particular employment path is followed after childbirth. We are particularly interested in how prior employment characteristics influence the probability of returning to work, as this allows us to understand the impact of working conditions on patterns of return: for example, we can assess whether women who previously worked long hours or within particular occupations are also more likely to exit the labour market or to downgrade (these covariates are described above).
3.3.3 Occupational mobility: descriptive results and multinomial logit models
Turning to occupational mobility, we first report descriptive statistics on the incidence of occupational upgrading and downgrading over time. We examine changes in occupational status from the year before birth to the year after, and then 1, 3 and 5 subsequently. We assess the extent to which job characteristics influence the risk of up- and downgrading using multinomial logit models. The control variables included are employment characteristics (as described above) and the compensating features of new jobs - such as commuting time and working hours – which may be associated with women ‘choosing’ to downgrade.
3.3.4 Interdependencies in the Career Paths of Couples
The final part of our analysis examines interdependencies in couples’ career decisions following birth. We first describe how, within couples, the employment patterns and relative earnings of men and women change in the years following childbirth. We then estimate multinomial logit models of employment trajectories and the risk of occupational downgrading, this time adding additional controls for the relative earning status of couples.
4. Results
4.1 Employment trajectories following childbirth
4.1.1 Mothers’ and fathers’ employment after childbirth
The first step of our analysis shows how, on aggregate, employment patterns evolve following childbirth. In the following section we then disaggregate these patterns, in order to understand the extent to which the changes in employment reflect stable patterns of return, or mobility as mothers (and fathers) switch employment status.
Figure 1 shows changes in employment, at 6 monthly intervals, for new mothers and fathers, up to 3 years after birth. In the top panel we show these rates for all new parents, and in the lower panel, how employment status evolves for those who were in full-time, part-time or self- employment, or not in work, prior to birth. For all new parents, while differences in employment status existed between mothers and fathers prior to birth, these differences are reinforced in the subsequent years. For those who previously worked full-time these patterns (depicted in the second panel) are particularly striking, with mothers’ rates of full-time work falling to 40% and not recovering over time, while the majority of men (over 90%) remain either in full-time work or self- employed. We similarly see (in the lower panels) that, while men who were part-time or non- employed prior to birth tend to become more engaged with the labour market in the years after birth, for women the opposite is true. In particular, mothers who worked part-time prior to birth are much less likely to move to full-time employment than new fathers, and much more likely to leave the labour market. Similarly, mothers not in employment were unlikely to re-join the labour market in the subsequent 3 years, while 52% of new fathers who had not been in employment did so.
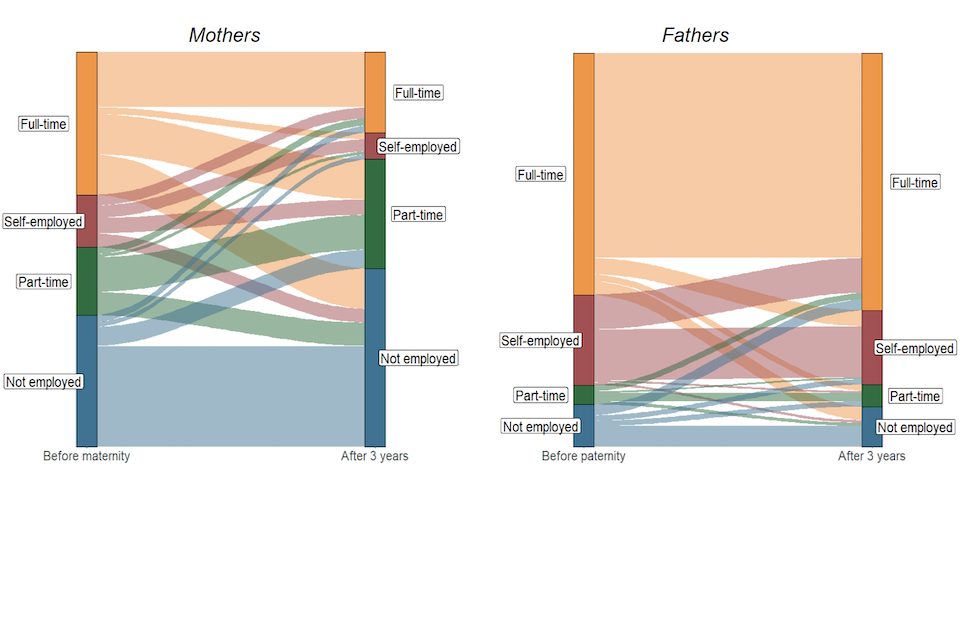
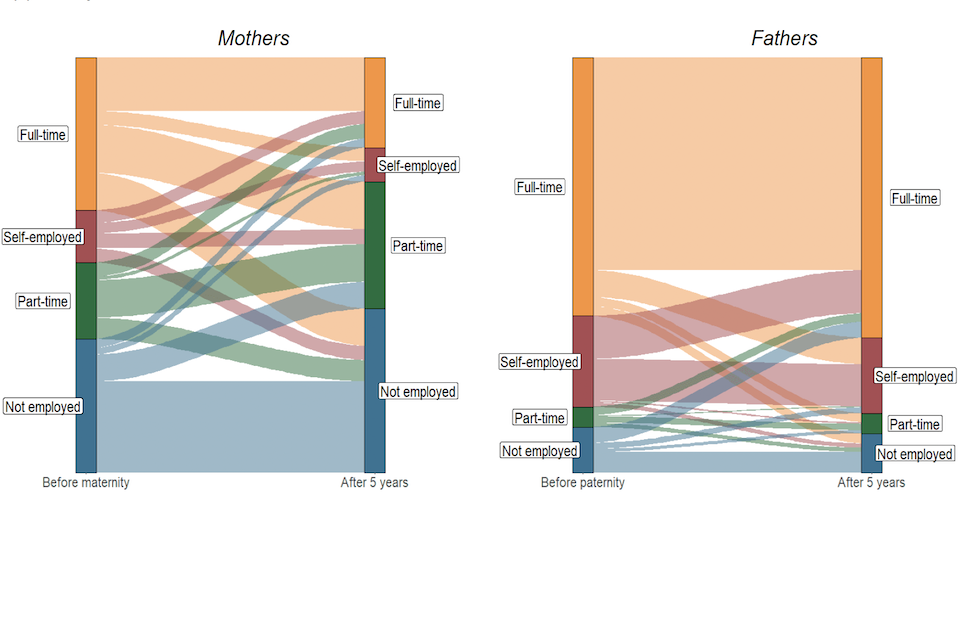
Figure 2 demonstrates mobility between states for individuals in the year before birth and 3 and 5 years after. The individual transitions again depict women’s movement away from full- time work, with very few part-time or non-employed workers shifting towards it. For men, the opposite is true. These graphs depict transitions between 2 points in time only. In the next section we use more complete information of individuals’ employment histories to depict employment patterns after birth, and to develop typologies of return.
Figure 1: Mothers and fathers’ employment patterns (%) in the 3 years after birth
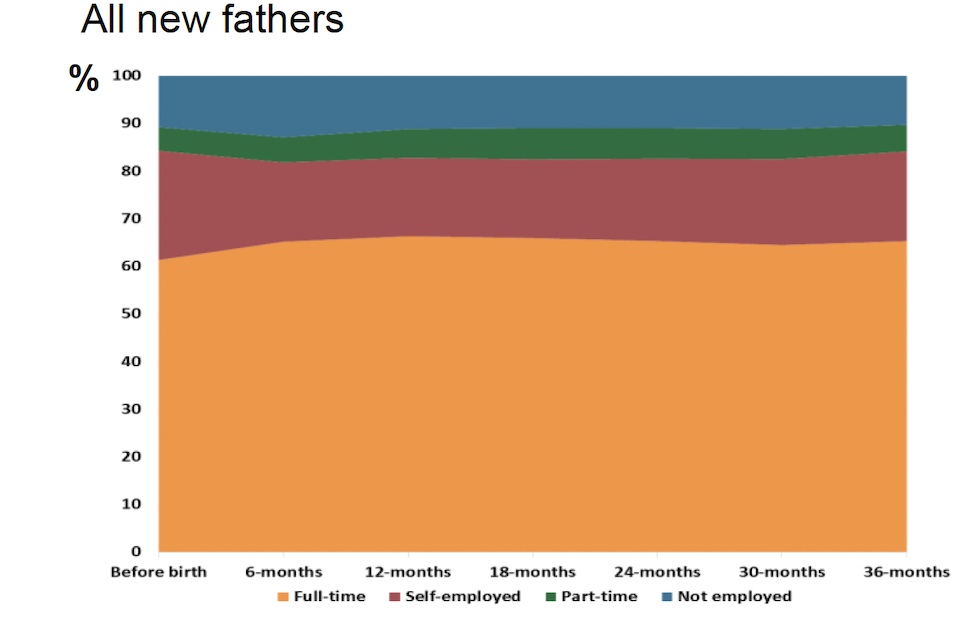
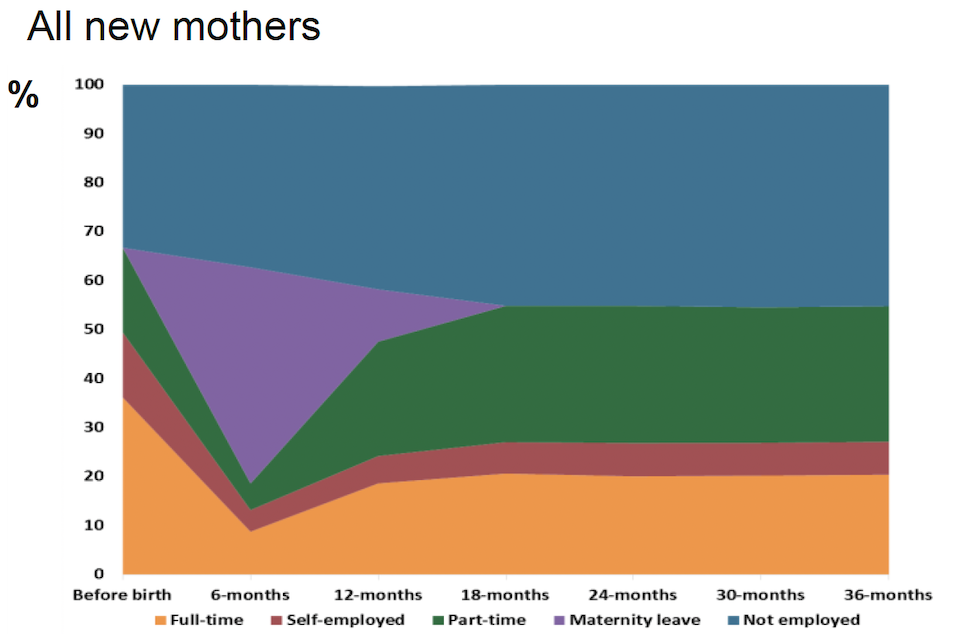
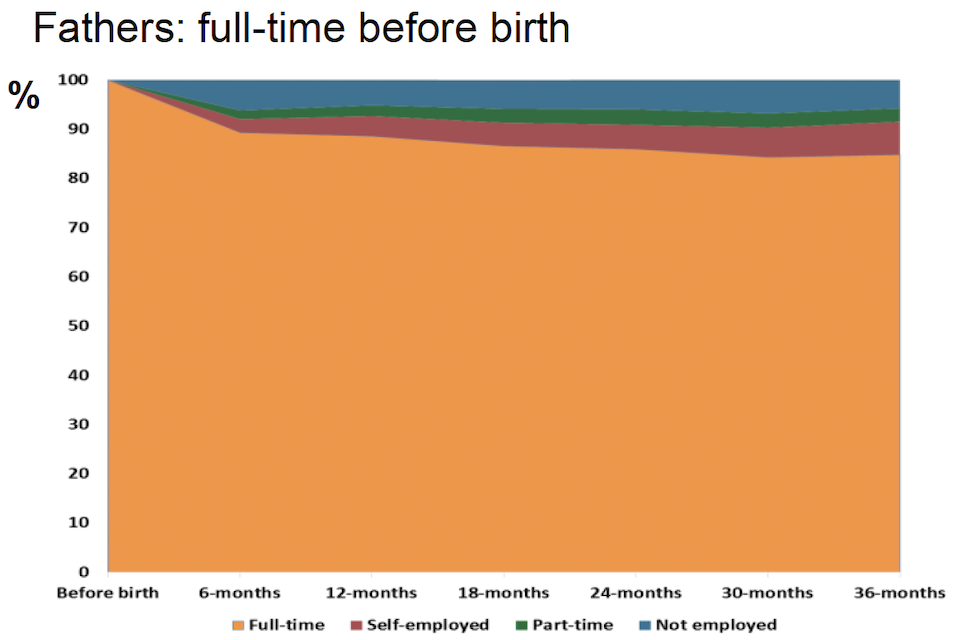
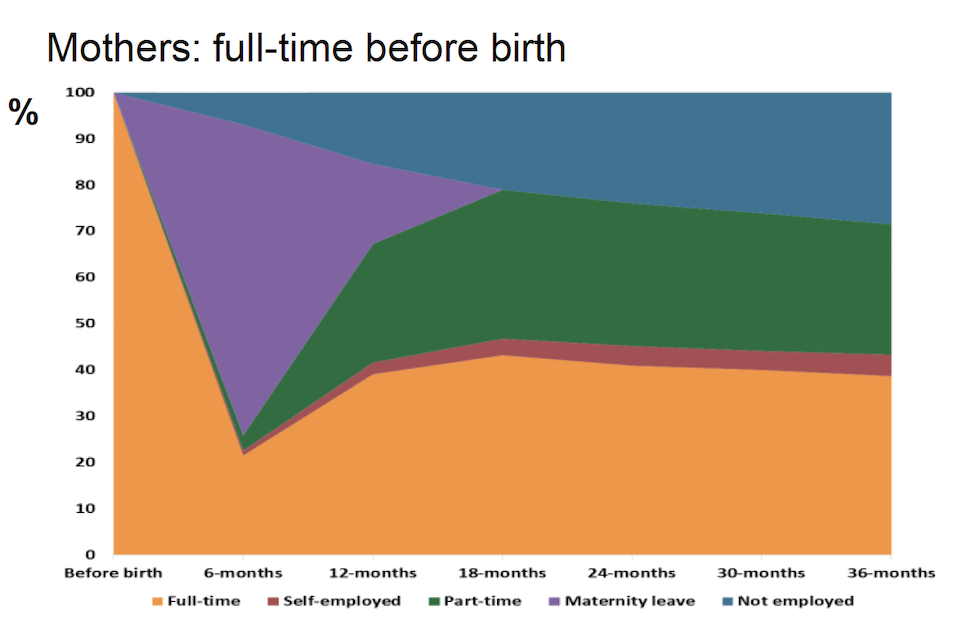
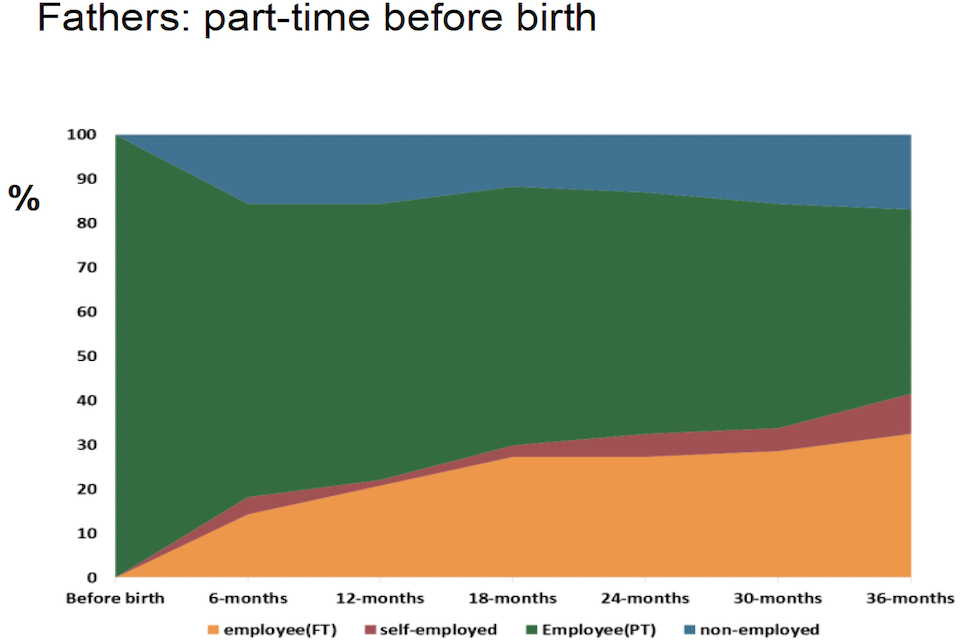
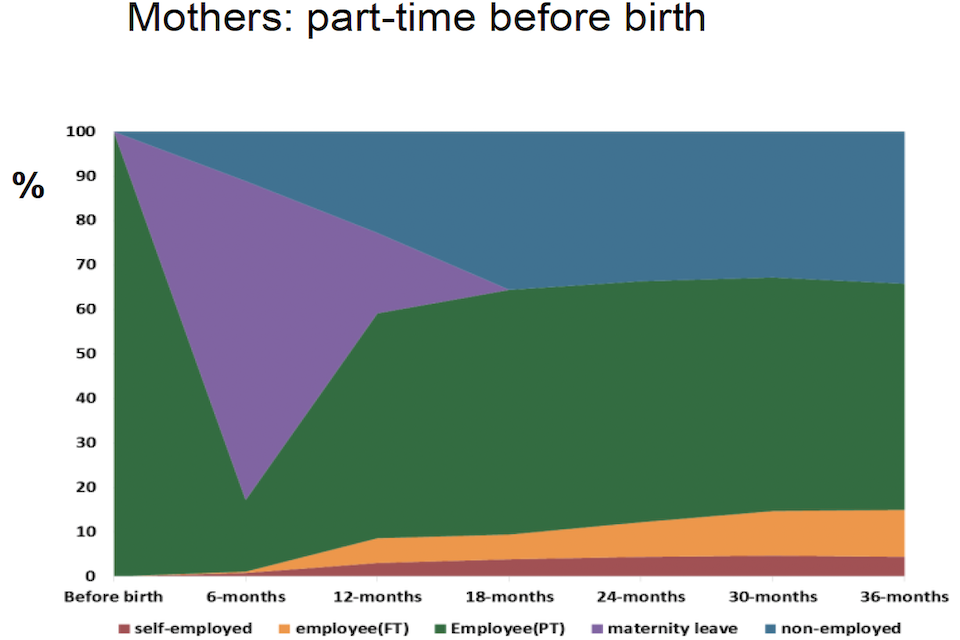
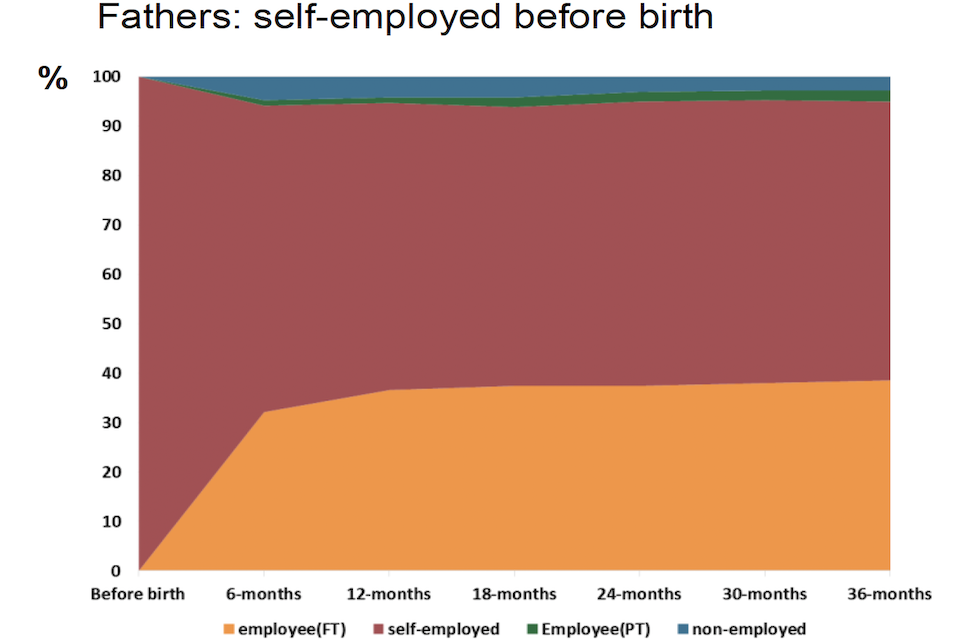
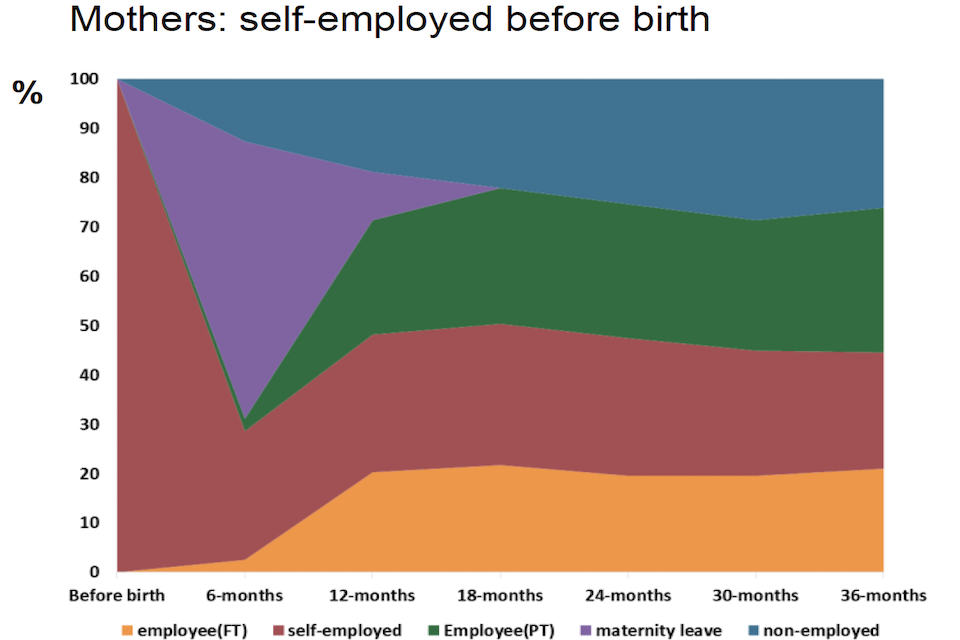
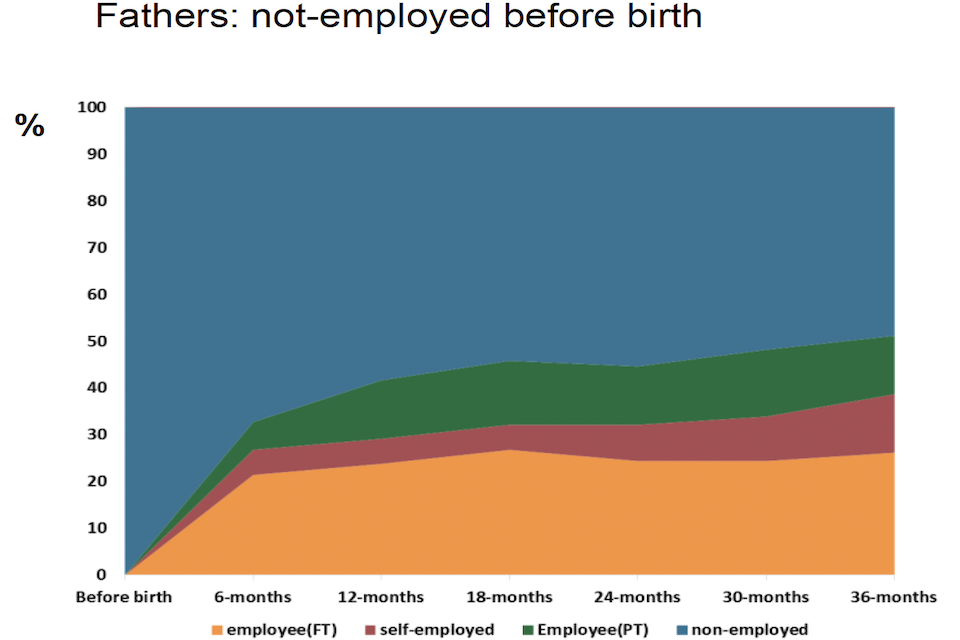
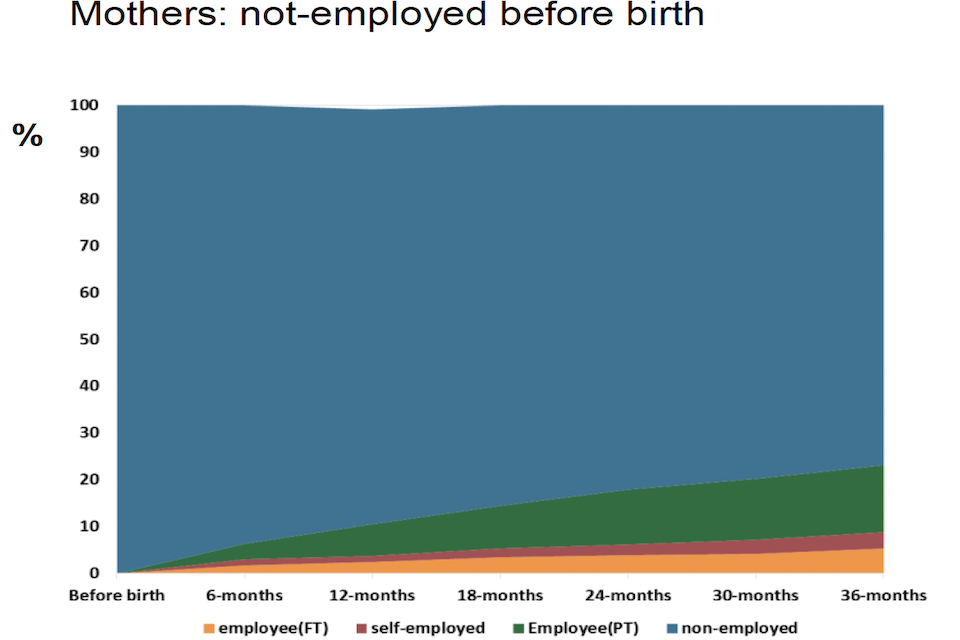
Figure 2: Sankey charts of employment before and after birth
3 years:
5 years:
4.1.2 Patterns of return to work: mothers
Our cluster analysis suggests that there are 8 typical employment sequences that women follow in the 3 years after childbirth. These are represented in Figure 3. Within each cluster, the sequences followed by each individual are depicted by the indexplot (the right-hand side diagrams). On the left-hand side these sequences are grouped, and illustrate the typical trajectories that women – within each of these clusters – follow. For example, they allow us to see how the timing of maternity leave varies for those returning to full-time work, or how common within each of the clusters other statuses are.
The first 2 clusters show full- and part-time patterns of return. They show that new mothers return to work over the year following birth and then move into either full or part-time work, with little subsequent movement between states (although a small share in each group have a subsequent period of maternity leave). The third cluster identifies a group who return to work after a period out of the labour force, with the vast majority returning part-time and within 2 ½ years after birth. In cluster 4 a similar picture shows those who return to self-employment (although this group typically have a shorter period of maternity leave than those returning to work as employees).
The last 4 clusters are typically not in work. They are a group who return briefly to part-time work before leaving the labour force, a group who were employed prior to birth but left the labour force after a period of maternity leave, and 2 further groups who had no maternity leave – typically because they were not working prior to birth – and who did not return to work. The first of these is out of the labour force, while in the second women move between inactivity and unemployment.
Figure 3: Mothers’ employment sequences, 3-years (n=2,281)

The share of women within each cluster is summarised in Table 1. The most common pattern is for women to go back to, and remain in, part-time work following maternity leave (24% of all new mothers and around one-third of those who working prior to birth) with returning to full-time work second most common (21% of all mothers, and around 30% of all those in work before birth). Of those who were working prior to birth – and took maternity leave – around 1 in 10 left work (or 7% of all mothers). Moving between employment states in the 3 years after birth was rare, with 3% going back to work part-time before quitting, and 8% leaving work following maternity leave before returning to work. A further 30% were either out of the labour force or moved between economic inactivity and unemployment. The majority of these women were not working prior to birth.
Table 1: Mothers’ typical patterns of work in the 3 year after childbirth
| All mothers | First-time mothers | First-time mothers, no subsequent births | |
|---|---|---|---|
| Sequences | % | % | % |
| Maternity leave => FT | 20.9 | 28.8 | 30 |
| Maternity leave => PT | 24 | 26.3 | 25.6 |
| Maternity leave => OLF => Work | 8.2 | 7.9 | 7.7 |
| Maternity leave => Self employed | 6.9 | 6.7 | 7.5 |
| Maternity leave => PT => OLF | 3.1 | 3.9 | 2.1 |
| Maternity leave => OLF | 7.2 | 7.9 | 7.8 |
| Precarity (unemployed or OLF) | 8.4 | 9 | 9.7 |
| OLF | 21.1 | 9.6 | 9.6 |
| Sample size | 2,281 | 979 | 677 |
Notes: this table describes the patterns of return to work illustrated in Figure 3.
The picture for first-time mothers is surprisingly similar to that for all mothers, although a higher share of first-time mothers return to full-time work (29%), and a smaller share were not working prior to birth and remained out of the labour force following birth (one-fifth first time mothers). Similar proportions moved into part-time work or left the labour force after maternity leave.
We also examined differences in the experience of first time mothers who did not have a subsequent birth. In the 3 years after birth we found little difference between these mothers and all new mothers.
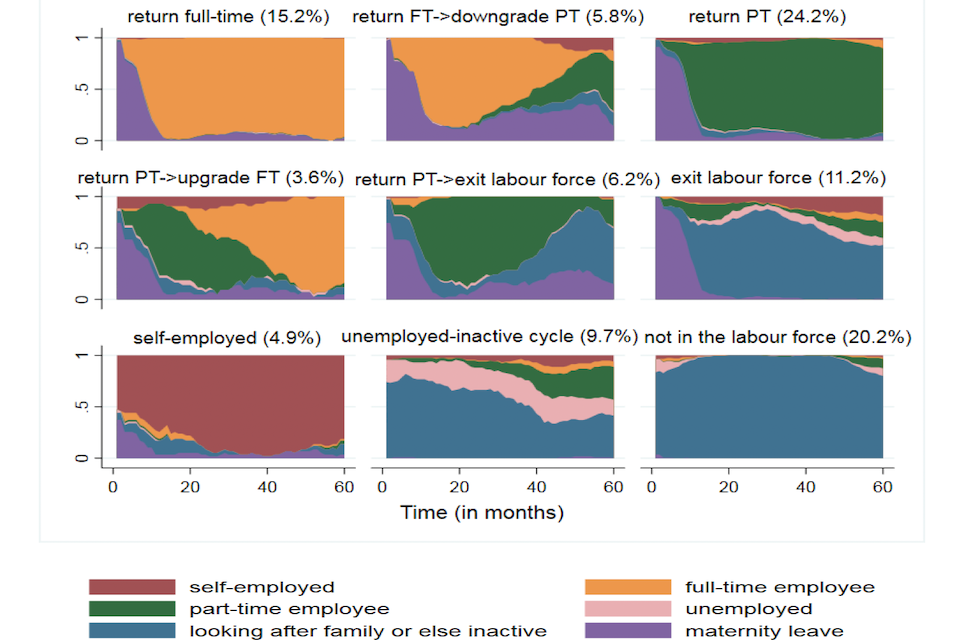
Looking at employment trajectories over a longer period of time following birth gives further insights into mothers’ employment trajectories. Figures for the 5-year sequences are shown in Figure 4. Only the chronograms are reported in Figure 4, showing the typical patterns of return. The distribution of the cluster types, for all mothers, is described in Table 2.
Table 2: Mother’s typical patterns of work in the 5 years after
| All mothers | First-time mothers | First-time mothers, no subsequent births | |
|---|---|---|---|
| (ii) 60-month sequences | % | % | % |
| Maternity leave => FT | 15.2 | 18.5 | 25 |
| Maternity leave => PT | 24.2 | 23.3 | 26.3 |
| Maternity leave => PT => FT | 3.6 | 4.3 | 3.6 |
| Maternity leave => FT => PT | 5.8 | 10.1 | 2.7 |
| Maternity leave => Self employed | 4.9 | 5.3 | 5.4 |
| Maternity leave => PT => OLF | 6.2 | 7.7 | 1.3 |
| Maternity leave => OLF | 11.2 | 14.6 | 16.5 |
| OLF | 20.2 | 9.9 | 10.7 |
| Precarity (unemployed or OLF) | 9.7 | 6.3 | 8.5 |
| Sample size | 1,199 | 493 | 224 |
Notes: this table describes the patterns of return to work illustrated in Figure 4.
Over the 5-year period more fluctuation between states is observed. The share of those maintaining full-time employment drops to 15%, as some of those who returned to full-time work after birth subsequently dropped down to part-time hours (6% returned from maternity leave to full-time work before reducing their working hours to part time). Conversely, 4% of mothers who returned to work part-time work increased their working hours to become full-time, while 6% of part-time returners left the labour force.
Figure 4: Mothers’ employment sequences, 5-years (n=1,199)
We conducted the same analysis for fathers. Their 3-year employment trajectories following birth are shown in Figure 5 and Figure 6 shows those for 5 years. The clusters that are identified are the same over both time frames, with the sequences for fathers exhibiting far less variation than those for mothers. Over 5 years, the majority of fathers were either full-time (64%) or self-employed (18%). A further 6% had unstable careers around the time of childbirth but moved into full-time work over time with 5% working part-time. Of those not working, 4% were persistently out of the labour force and 3% persistently unemployed.
Table 3: Fathers’ employment sequences 3 and 5 years after childbirth
| 36-month sequences: All fathers (%) | 36-month sequences: First time fathers (%) | 60-month sequences: All fathers (%) | 60-month sequences: First time fathers (%) | |
|---|---|---|---|---|
| FT employee | 61.8 | 67.8 | 64.1 | 68.4 |
| Self-employed | 17.2 | 15.5 | 17.7 | 15.7 |
| PT employee | 6.1 | 4.5 | 5 | 5.8 |
| Move to FT work (FT employee or | 5.1 | 5.3 | 6.2 | 5.8 |
| Self-employed with early unemployment or PT work) | ||||
| Unemployed | 5 | 3.8 | 3.3 | 2.5 |
| OLF | 4.7 | 3.1 | 3.7 | 1.8 |
| Sample size | 1,687 | 807 | 882 | 396 |
Notes: this table describes the patterns of return to work illustrated in Figures 3 and 4.
Figure 7 summarises male and female employment patterns in the 3 years after birth, and illustrates the dramatic divergence in pathways over this period.
As fathers’ career trajectories are less clearly affected by childbirth than those of women the rest of our analysis of employment sequences focuses on mothers, although we return to consider fathers when we examine risks of occupational downgrading or upgrading
Figure 5: Fathers’ employment sequences, 3-years (n=1,687)
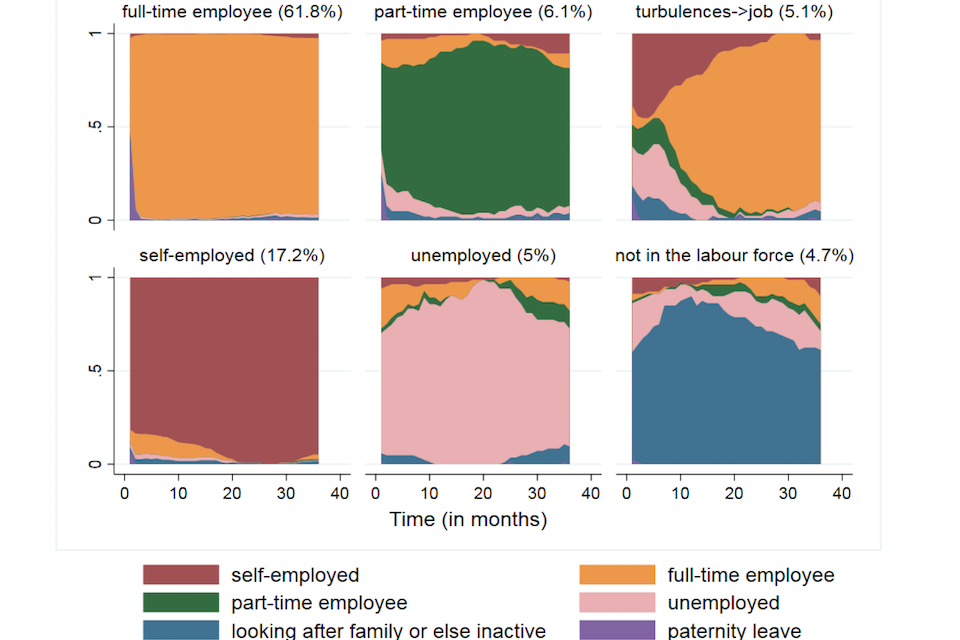
Figure 6: Fathers’ employment sequences, 5-years (n=882)
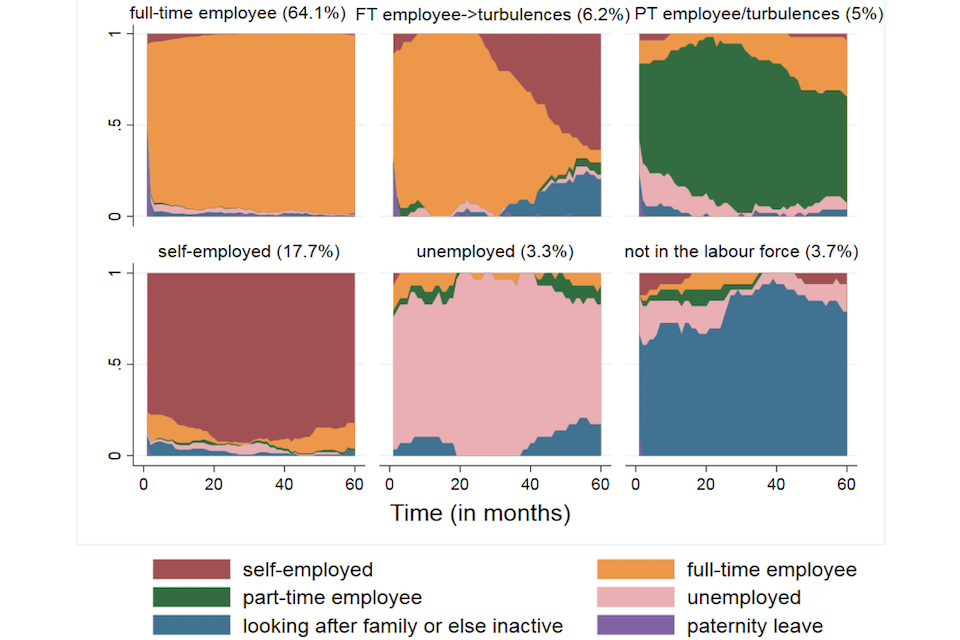
Figure 7: Mothers’ and fathers’ typical employment patterns in the 3 years after birth
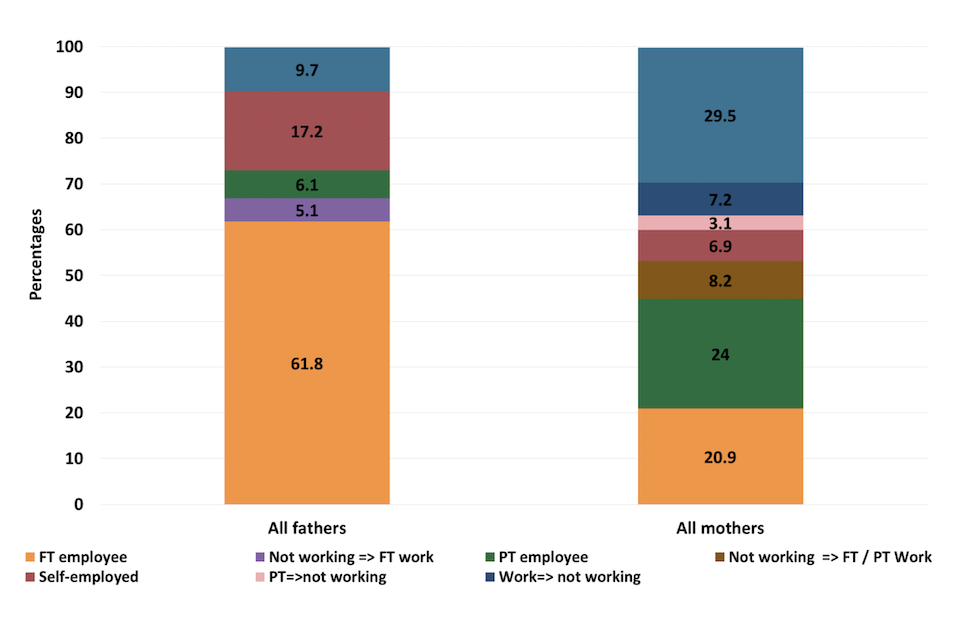
Mothers’ and fathers’ typical work patterns in the 3 years after childbirth
Mothers
Full-time return:
- 21% return to work full-time from maternity leave, with no time out of the labour force
Part-time return:
- 24% return to work part-time following a period of maternity leave without any time out of the labour force
- 8% of mothers move out of, and then back into, employment following childbirth
Non-employed:
- 7% left the labour force following maternity leave
- 3% returned to work part-time before exiting the labour force
- 30% had no maternity leave and were inactive or non-employed after birth (of these women, most were non-employed prior to birth)
Self-employment:
- 7% of mothers return to self-employment
Fathers
Full-time return:
- 62% are consistently in full-time work
- 6% of men are working part-time when their child was born but subsequently move into full-time employment
- 5% of men were not in work when their child was born but move into full-time employment
Self-employed:
- 17% are consistently self-employed
Non-employed:
- 5% are consistently unemployed
- 5% remained out of the labour force
Note: there is no cluster of new fathers who return to work part-time.
4.1.3 Patterns of return to work, pre-birth employment status and individual and job characteristics
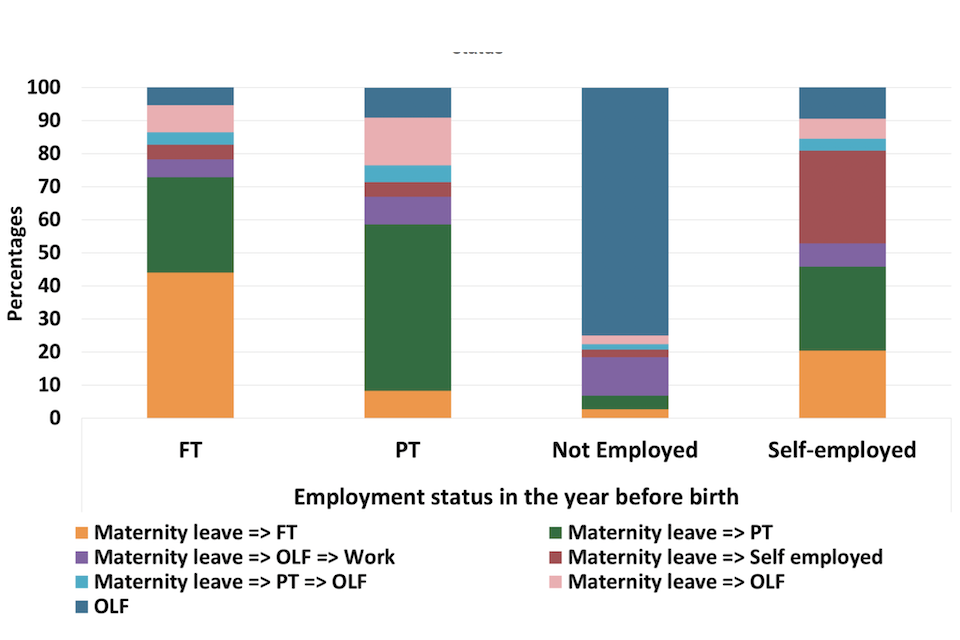
Mothers’ patterns of return to work are likely to be highly contingent on what they were doing before childbirth. Table 4, and Figure 8, shows patterns of return to work over 3 years by employment status prior to birth. The results show that:
Of those working full-time prior to birth:
- 44% returned to work full-time (and remained full-time)
- 29% returned to work part-time (and remained part-time)
- 14% left the labour market
- 10% moved between states after returning from maternity leave with 6% leaving employment and then returning to work, and 4% returning to work part-time before exiting employment
Among those working part-time prior to birth:
- 50% returned to work part-time
- 23% left employment (either exiting the labour force or to unemployed)
- 5% returned part-time before exiting the labour force
- 8% returned to full-time employment
Of those not employed prior to birth:
- the vast majority, 78%, remained out of work
- 3% followed a full-time work trajectory after birth and 4% a part-time trajectory
- 12% spent time out of the labour force and then returned to work (full- or part-time)
The self-employed group, who also include those for whom we do not know working hours, is relatively small and patterns of return are heterogeneous, with fewer returning to their former state.
Table 4: Mothers’ employment status prior to birth and 3- and 5-year patterns of return to work
| Sequences followed over 3 or 5 years | 3-year sequences: FT | 3-year sequences: PT | 3-year sequences: Not Employed | 3-year sequences: Self- employed | 5-year sequences: FT | 5-year sequences: PT | 5-year sequences: Not Employed | 5-year sequences: Self- employed |
|---|---|---|---|---|---|---|---|---|
| Maternity leave => FT | 43.9 | 8.3 | 2.7 | 20.3 | 30.6 | 4.1 | 2.7 | 16.2 |
| Maternity leave => PT | 28.9 | 50.3 | 4.0 | 25.4 | 25.9 | 49.2 | 7.8 | 22.3 |
| Maternity leave => FT => PT | - | - | - | - | 10.5 | 5.2 | 0.9 | 6.9 |
| Maternity leave => PT => FT | - | - | - | - | 3.1 | 6.3 | 2.1 | 6.2 |
| Maternity leave => OLF => Work | 5.5 | 8.3 | 11.7 | 7.2 | - | - | - | - |
| Maternity leave => OLF | 8.2 | 14.4 | 2.6 | 6.2 | 6.8 | 7.3 | 5.4 | 6.2 |
| Maternity leave => PT => OLF | 3.7 | 5.2 | 1.6 | 3.6 | 14.4 | 18.8 | 3.0 | 10.8 |
| Maternity leave => Self employed | 4.4 | 4.4 | 2.3 | 27.9 | 3.9 | 1.0 | 2.3 | 16.9 |
| Precarity (unemployed or OLF) | 3.5 | 4.2 | 17.9 | 2.9 | 1.3 | 5.2 | 22.8 | 7.7 |
| Out of labour force | 1.9 | 4.7 | 57.1 | 6.5 | 3.4 | 2.6 | 53.0 | 6.9 |
| Total | 100% | 100% | 100% | 100% | 100% | 100% | 100% | 100% |
| Share of all: | 36.2% | 17.3% | 33.2% | 13.3% | 36.8% | 18.4% | 32.2% | 12.5% |
| Sample size | 752 | 360 | 692 | 276 | 382 | 191 | 334 | 130 |
Notes: over 3 and 5-year sequences different clusters of job returners are identified and, as a result, some of the sequences in the 5-year sequences are not seen over 3 years, and vice versa. See Figure 3, 4 and Table 1 and 2 for details on the sequences.
Figure 8: Mothers’ and fathers’ typical employment patterns in the 3 years after birth, by previous employment status
The same information is also shown for 5-year sequences.
Among those working full-time prior to having children a minority maintain a full-time career with, in the following 5 years:
- 31% returning to, and remained in, full-time work
- 10% went back to work full-time but reduced their hours to part-time workover time
- 3% returned part-time before moving back to full-time employment
- 26% returned, and remained part-time
- 14% returned to work part-time before leaving the labour force
- a further 11% did not return to work
For workers who were either part-time employed or out of the labour force prior to birth, the shares who remained part-time or moved out of the labour force are similar to those in the 3- year sequences. Over 5 years, around half of those working part-time prior to birth remained in part-time work, with a further third moving out of the labour force and just 1 in 10 moving to full- time work (either directly after birth or following a period of part-time work). Among those not employed before childbirth, over three-quarters remained out of work in the subsequent 5 years with fewer than 5% taking up full-time work at any time and 10% part-time work.
Table 5 shows descriptive statistics of individual and family characteristics of all new mothers. The individual characteristics show a clear gradient with respect to patterns of returning to work:
- those who did not have a job prior to childbirth – and who do not return to work – are typically younger, less educated, more likely to have health problems and to be non-white than ‘potential returners’
- those who return to work full-time are older, better educated and less likely to have health problems than other mothers
‘Potential returners’ who exit the labour force, and those who move to part-time work, occupy an intermediate position. However, there is considerable heterogeneity among these groups, although sample size limitations mean we are not able to disaggregate differences further.
Looking at family characteristics, a higher share of those who were out of the labour force prior to birth were single at the time of birth (27%) while only a small share of those that returned to work, either full or part-time, were single (7% and 5% respectively).
Those who had a job prior to birth were also less likely to have other children than those already out of the labour force, with those returning to work full-time in particular having fewer children. Nonetheless, even among full-time job returners, 40% already had at least one child.
Finally, the bottom panel shows the share of women whose mothers were working at age 14, together with the information on attitudes towards work and family life. While almost three-quarters of those who returned to work had mothers who had been working when they were age 14, this share fell to 60% among those that exited the labour force. Just 45% of those who were not working prior to birth, and did not return to work, had working mothers when they were 14. Similar differences are observed in work attitudes, which reveal large differences in attitudes towards work between those who returned to work, those that exited the labour market (non-returners) and those that were outside the labour force before and after birth: returners, and particularly full-time returners, had more progressive attitudes towards mothers working and gender roles prior to childbirth.
Table 5: Mothers’ individual and family characteristics prior to childbirth by pattern of return to worxk (3-year sequences)
Individual characteristics:
| Individual characteristics | All | PT | FT | OLF to work | Exit employment | Self- employed | OLF |
|---|---|---|---|---|---|---|---|
| Age at birth (%) | |||||||
| 16 to 24 | 19.1 | 13.5 | 10.1 | 24.5 | 21.2 | 6.3 | 30.9 |
| 25 to 34 | 58.7 | 63.1 | 65.8 | 55.9 | 55.5 | 62 | 51.2 |
| 35 to 49 | 22.2 | 23.4 | 24.1 | 19.7 | 23.3 | 31.6 | 18 |
| Education (%) | |||||||
| High | 47.5 | 54.4 | 69.8 | 47.6 | 44.3 | 62.7 | 23.4 |
| Medium | 24.5 | 26 | 17.6 | 26.7 | 28.7 | 20 | 27.2 |
| Low | 28 | 19.6 | 12.6 | 25.7 | 27 | 17.3 | 49.5 |
| Health problems (%) | 16.4 | 16.4 | 11.8 | 13.9 | 16.1 | 10.6 | 21.7 |
| Not white (%) | 26.8 | 13.9 | 27.6 | 23.5 | 24.3 | 25.5 | 39.2 |
Family circumstances:
| Family circumstances | All | PT | FT | OLF to work | Exit employment | Self- employed | OLF |
|---|---|---|---|---|---|---|---|
| Single (%) | 13.8 | 7.2 | 5.3 | 17.1 | 10.9 | 4.6 | 27.3 |
| Number of children (%) | |||||||
| First baby | 43.1 | 47.1 | 59.4 | 41 | 48.9 | 41.8 | 27.1 |
| Second baby | 34.9 | 38.6 | 30.7 | 39.9 | 31.5 | 36.7 | 34.1 |
| 3rd or further birth | 22 | 14.3 | 9.9 | 19.1 | 19.6 | 21.5 | 38.7 |
Work attitudes:
| Work attitudes | All | PT | FT | OLF to work | Exit employment | Self- employed | OLF |
| Mother worked at 14 (%) | 63.7 | 74.2 | 74.9 | 70.9 | 60.2 | 68.2 | 44.9 |
| Pre-school child suffers if mother works (%) | |||||||
| Strongly agree or agree | 22.2 | 14.1 | 9.6 | 16.2 | 27.9 | 20.3 | 39.7 |
| Neither agree nor disagree | 30.4 | 29.6 | 23.9 | 35.8 | 32.5 | 30.5 | 33.6 |
| Strongly disagree or disagree | 47.4 | 56.3 | 66.5 | 48 | 39.6 | 49.2 | 26.7 |
| Family suffers if mother works full-time (%) | |||||||
| Strongly agree or agree | 31.7 | 31.9 | 18.6 | 27.7 | 32.1 | 28.3 | 43.3 |
| Neither agree or nor disagree | 26.7 | 25.6 | 21.8 | 33.1 | 27 | 26 | 29.5 |
| Strongly disagree or disagree | 41.7 | 42.6 | 59.6 | 39.2 | 40.8 | 45.7 | 27.2 |
| Husband should earn, wife should stay at home (%) | |||||||
| Strongly agree or agree | 13.8 | 6.7 | 6.4 | 10.8 | 10.7 | 15 | 28.3 |
| Neither agree or nor disagree | 25.6 | 20.3 | 15.5 | 31.1 | 31.5 | 19.7 | 35.8 |
| Strongly disagree or disagree | 60.6 | 73 | 78.1 | 58.1 | 57.9 | 65.4 | 36 |
Note: return to work patterns are the same as those identified in the sequences above (in Figure 5 and Table 1).
Table 6 shows the employment characteristics of those who were in work before birth but do not return (‘non-returners’), and for ‘returners’ in the year before birth and 1, 3 and 5 years after (we exclude those who are not observed in work the year before birth). The results for men and women are shown although, as most new fathers return to work (if they worked prior to birth), we do not have a non-returner group.
For women, descriptive statistics show that non-returners worked fewer hours prior to childbirth, were more likely to work in retail, routine occupations or in the private sector, and were less likely to be employed in education or health. They were also less likely to work in a unionised workplace and had shorter average commute times prior to childbirth.
For those who return to work, the most apparent change after birth is that working hours initially fall and then gradually increase over time. We also observe a decline in weekend working and commuting time, although again these changes emerge slowly over time. Finally, there is a small increase in the share of women working in education or in the private sector, although changes are small.
For comparison, we also report data for men in panel (ii). Fatherhood has little impact on working hours (indeed, those that were working part-time tended to increase their hours). We also see a decline in weekend working but an increase in commute time. There is no change in industrial or occupational structure over time, although there are notable, if unsurprising, differences between men and women: women are, for example, more likely to work in the public sector and in education or health.
Table 6: Employment characteristics of mothers and fathers before and after birth
| Non- returners | Returners, before | Mothers: 1- year after | Mothers: 3- years after | Mothers: 5- years after | All, before | Fathers: 1- year after | Fathers: 3- years after | Fathers: 5- years after | |
|---|---|---|---|---|---|---|---|---|---|
| Working hours | |||||||||
| All | 29.9 | 34.9 | 28.4 | 29.4 | 30.5 | 42.7 | 42.6 | 42.6 | 43.1 |
| FT before birth | 38.1 | 39.9 | 31.1 | 31.8 | 31.8 | 43.8 | 43.5 | 43.4 | 43.6 |
| PT before birth | 20.4 | 23.2 | 21.7 | 24.1 | 27.1 | 24.2 | 30.1 | 30.5 | 36.7 |
| Industry (SIC) (%) | |||||||||
| Retail | 16.2 | 8.5 | 9 | 8 | 10.2 | 7.7 | 7.4 | 7.3 | 7 |
| Finance | 3.1 | 5.6 | 4.9 | 4.8 | 4.4 | 5.2 | 4.6 | 5.1 | 6 |
| Education | 11.5 | 18.1 | 18.8 | 18.7 | 20.9 | 8.7 | 9.4 | 9.3 | 10.1 |
| Health | 10 | 14.8 | 15.5 | 15.3 | 14.8 | 3.4 | 3.2 | 3.7 | 2.6 |
| Public admin | 3.8 | 6 | 6.6 | 7.7 | 7.7 | 6.3 | 7 | 8.4 | 7.2 |
| Voluntary/Church | 17.7 | 13.1 | 12.1 | 12.2 | 9.4 | 3.9 | 3.5 | 3.9 | 3.6 |
| Other | 37.7 | 33.8 | 33.1 | 33.3 | 32.6 | 64.9 | 64.9 | 62.4 | 63.5 |
| NS-SEC 3 (%) | |||||||||
| Professional | 34.4 | 55.2 | 54.3 | 54.6 | 53.6 | 48.1 | 49.2 | 50.5 | 49.7 |
| Intermediate | 10.9 | 20.4 | 22 | 23.6 | 21.1 | 21.1 | 19.7 | 21 | 24 |
| Routine | 54.7 | 24.4 | 23.6 | 21.9 | 25.3 | 30.8 | 31.1 | 28.5 | 26.3 |
| SOC (NS-SEC 8 categories) (%) | |||||||||
| Large employers/higher management | 7.8 | 4.3 | 3.6 | 4.3 | 4.9 | 6.7 | 6.9 | 7.5 | 7.4 |
| Higher professional | 4.7 | 10 | 9.8 | 9.1 | 8.7 | 13.8 | 13.2 | 13.5 | 12.8 |
| Lower management and professional | 21.9 | 40.9 | 40.8 | 41.2 | 40 | 27.6 | 29.1 | 29.5 | 29.5 |
| Intermediate | 9.4 | 17.5 | 16.7 | 16.5 | 14.9 | 9.8 | 8.4 | 8.2 | 10.2 |
| Small employers/own account | 1.6 | 3 | 5.3 | 7.1 | 6.2 | 11.3 | 11.3 | 12.8 | 13.8 |
| Lower supervisory/technical | 8.6 | 4.1 | 3.9 | 3.6 | 5.1 | 9.8 | 10.7 | 9 | 10 |
| Semi-routine | 35.9 | 15.8 | 15.3 | 14.3 | 15.5 | 12 | 11.4 | 10.9 | 9.2 |
| Routine | 10.2 | 4.5 | 4.4 | 4 | 4.7 | 8.9 | 9 | 8.6 | 7.1 |
| Sector (%) | |||||||||
| Private | 69.7 | 56.8 | 55.1 | 54 | 54.1 | 19.2 | 18.9 | 21.3 | 19.7 |
| Public | 24.6 | 38.5 | 40.5 | 40.4 | 40.6 | 77.2 | 77.3 | 75.2 | 76.3 |
| Other | 5.7 | 4.8 | 4.4 | 5.6 | 5.3 | 3.6 | 3.8 | 3.5 | 4 |
| Trade union at work* (%) | 38.5 | 53.6 | 54.3 | 57.1 | 51.6 | 43 | 43.5 | 46.5 | 44.4 |
| Works weekends * (%) | 42.6 | 50.1 | 46.2 | 45.6 | 44.4 | 66.9 | 65.2 | 65.3 | 59.4 |
| Works evenings or night *(%) | 22.2 | 25.9 | 22.8 | 23 | 26.4 | 29.6 | 29.9 | 29.9 | 28.1 |
| Temporary job (%) | 4.8 | 6 | 5.4 | 4.7 | 6 | 4.7 | 4.7 | 5 | 5.7 |
| Minutes travelling to work | 24.1 | 27.7 | 27.1 | 26.4 | 23.9 | 28.8 | 30.6 | 29.4 | 30.9 |
Note: * these variables were collected only in waves 2,4,6,8. Sample sizes vary as a result of missing information which varies across variables.
4.2 Predicting patterns of return to work after childbirth: results from multinomial logit models
Results from the multinomial logit models are reported in Tables 7 and 8. Models are run on all those who held a job prior to childbirth (potential returners). The tables report relative risks, with the likelihood of the different sequences being reported relative to the baseline category of exiting the labour market (defined by cluster 4 in the 3-year sequences). A relative risk ratio of over 1 implies that an outcome is more likely to occur, and a ratio of less than one implies it is less likely.
Table 7 reports results where we condition on (a) individual and family characteristics and (b) individual and family characteristics controls plus additional controls for employment status prior to birth. Without controls for prior employment status, results are consistent with those reported in previous studies of female employment: mothers who are more educated, older and with fewer children are more likely to return to work full-time. Part-time returners, and those that exit the labour force before returning to employment in subsequent years, are similar to those who leave the labour force, although those with the least education (GCSE or equivalent) are less likely to return to any type of employment following a break.
Whether new mothers’ own mother worked when they were age 14 is also closely associated with returning to work; for those whose own mothers did not work, the odds of returning to any form of work are roughly halved and suggest that culture plays an important role in influencing mothers’ work decisions.
Table 7: Multinomial logit models of career pathways (3-year sequences)
(a) individual characteristics:
| return FT RRR | P>z | return PT RRR | P>z | OLF => Job RRR | P>z | ||||
|---|---|---|---|---|---|---|---|---|---|
| Age (base: under 25) | |||||||||
| 25 to 34 | 1.711 | * | .064 | 1.483 | .148 | 1.406 | .424 | ||
| 35 to 52 | 2.064 | ** | .039 | 1.676 | .122 | 2.021 | .151 | ||
| Single (base: partnered) | .800 | .516 | .827 | .553 | 1.216 | .706 | |||
| Education (base: high) | |||||||||
| Medium | .420 | *** | .000 | .796 | .305 | .985 | .980 | ||
| Low | .385 | *** | .000 | .617 | ** | .041 | .281 | *** | .002 |
| Parity at birth (base: first child) | |||||||||
| Second baby | .782 | .254 | 1.225 | .33 | .976 | .934 | |||
| 3rd or further birth | .469 | *** | .008 | .707 | .187 | .486 | * | .073 | |
| Mother didn’t work at 14 (base: mother had a job) | .505 | *** | .000 | .487 | *** | .000 | .635 | .106 |
b) model (a) plus pre-birth employment status:
| return FT RRR | P>z | return PT RRR | P>z | OLF => job RRR | P>z | ||||
|---|---|---|---|---|---|---|---|---|---|
| Age (base: under 25) | |||||||||
| 25 to 34 | 1.487 | .184 | 1.499 | .139 | 1.398 | .426 | |||
| 35-52 | 1.627 | .179 | 1.670 | .124 | 1.934 | .183 | |||
| Single (base: partnered) | .713 | .339 | .837 | .579 | 1.228 | .664 | |||
| Education (base: high) | |||||||||
| Medium | .447 | *** | .002 | .779 | .267 | .916 | .779 | ||
| Low | .447 | *** | .001 | .611 | ** | .038 | .274 | *** | .003 |
| Parity at birth (base: first child) | |||||||||
| Second baby | 1.431 | .126 | 1.180 | .471 | .948 | .872 | |||
| 3rd or further birth | .914 | .666 | .675 | .173 | .490 | .114 | |||
| Mother didn’t work at 14 (base: mother had a job) | .534 | *** | .002 | .482 | *** | .000 | .616 | * | .086 |
| PT employee (base: FT) | .125 | *** | .000 | 1.139 | .556 | 1.211 | .563 |
Note: p<0.1,**p<0.05, **p<0.01. Models are run only on ‘potential returners’. Non-returners are selected as the reference category. All characteristics are measured before birth. Controls for self-employment / paid work prior to birth are also included but not reported here. Controls for ethnicity (not-white), flexible working, and government office region were included in the original models but were insignificant. To make the model more parsimonious they are excluded from the final models. Sample size: 1,145.
An important advantage of longitudinal data is that we are able to condition on previous employment status. Including controls for past employment leads to a change in the coefficients on personal characteristics, with age at the time birth ceasing to be significantly associated with returning to work. We also observe an important shift in the result on parity: once prior employment status is controlled for, parity has no statistically significant impact on the probability of returning to work, full- or part-time. Thus, while childbirth is strongly associated with leaving employment for all women, among those in work prior to childbirth the number of children that a woman already has bears no statistically significant influence on her likelihood of returning to work (indeed, while the coefficients on parity cease to be significant once controls for prior employment status are included, their magnitude suggests that those who return to work full- time following a first birth may be more likely to return to work full-time following a second birth).
While this result is consistent with the idea that women with more children are less likely to work – as childbirth is associated with a reduced probability of returning to work for each and every birth in a way that is independent of parity – it also suggests that there is hysteresis in the employment trajectories of women, with prior employment status, rather than parity, influencing post-birth employment trajectories.
Overall, the results suggest that whether women are working full-time or not prior to birth is one of the most important factors predicting their return and it is prior employment status, rather than the number of children a woman has, that predicts subsequent employment. The same is true for part-time work. The models also confirm the results from the descriptive statistics, which suggested that, where women worked part-time or exited the labour force, their chances of moving into full-time work either 3 or 5 years after childbirth are very low.
Table 7 also shows that women who were working part-time prior to childbirth were equally likely to return to part-time work, to exit the labour force or to return to work following a break. On the other hand, they were far less likely to work full-time than those who had been full-time employed prior to birth.
Table 8 adds employment characteristics to the models. Adding these controls does not change the sign or significance of the coefficients on the individual and family characteristics, so we do not report these again here. Given collinearity between employment level controls – in particular industry and sector – we run 2 separate models. The first includes industry controls and the second includes controls for occupation and firm size (but not industry). Both models control for the share of part-time workers by occupation.
The coefficients on the industry dummies show that those previously working in education were significantly more likely to return to full-time work. Other industry controls had no influence on mothers’ subsequent employment trajectories. This result suggests that the differences in gender pay gaps between industries reported by Goldin for the US may not be replicated in the UK where women with children are much less likely to work full-time.
Controls for sector of employment, occupation and firm size shows that:
- public sector employees are almost twice as likely as those in the private sector to return to work full-time
-
those working in larger firms were more likely to return to work either full- or part-time
- those in routine occupations were less likely to return to full-time work
The share of workers who were part-time in the mother’s occupation prior to birth has a significant influence on the probability of returning to work, with those working in occupations where more than half of all jobs were part-time much less likely to return full-time.
Finally, it is worth noting again that those who were not in employment prior to birth were not included in these models. Separate models run on these groups suggest that those that were not employed prior to birth (and are not therefore potential returners) are particularly disadvantaged in the labour market: they are more likely to be single, young, less educated and already have 2 or more children than those who were working prior to childbirth.
Table 8: Multinomial logit models: returning to work and prior employment characteristics
Industry controls:
| Return FT RRR | P | Return PT RRR | P | OLF => return RRR | P | |||
|---|---|---|---|---|---|---|---|---|
| % PT in occupation (base: under 25%) | ||||||||
| 25% to 49% | .809 | .421 | 1.497 | .119 | .864 | .694 | ||
| 50% or more | .283 | *** | .000 | .776 | .399 | .499 | .144 | |
| Industry (base: other) | ||||||||
| Retail | .684 | .318 | .840 | .581 | .730 | .565 | ||
| Finance | 1.204 | .720 | 1.277 | .623 | 1.493 | .549 | ||
| Education | 1.986 | ** | .045 | 1.740 * | .088 | .926 | .882 | |
| Health | 1.759 | .127 | 1.472 | .278 | .972 | .957 | ||
| Public admin | 1.159 | .746 | 1.017 | .970 | .549 | .411 | ||
| Voluntary | .954 | .884 | .895 | .712 | 1.172 | .717 |
Models with sector, firm size, occupation and share of PT workers:
| Return FT RRR | P | Return PT RRR | P | OLF => return RRR | P | |||
|---|---|---|---|---|---|---|---|---|
| Sector (base: private) | ||||||||
| Public | 1.786 | ** | .036 | 1.527 | .108 | .980 | .958 | |
| Charity/ other | .758 | .558 | .586 | .24 | .193 | .13 | ||
| % PT in occupation (base: under 25%) | ||||||||
| 25% to 49% | .912 | .748 | 1.511 | .146 | .857 | .687 | ||
| 50% or more | .462 | ** | .043 | 1.008 | .981 | .565 | .249 | |
| Occupation (base: professional) | ||||||||
| Intermediate | 1.336 | .479 | 1.640 | .213 | 1.738 | .296 | ||
| Routine | .520 | *** | .053 | .749 | .363 | .573 | .244 | |
| Firm Size (base: micro, under 10) | ||||||||
| Small (10 to 49) | 1.720 | .117 | 1.847 | ** | .045 | 2.062 | .144 | |
| Medium (50 to 199) | 2.320 | ** | .028 | 2.234 | ** | .022 | 2.125 | .174 |
| Large (200 or more) | 2.868 | *** | .004 | 2.481 | *** | .007 | 2.196 | .135 |
Note: p<0.1,**p<0.05, **p<0.01. Sample sizes n=1,145. The same individual characteristics are included as above. Controls for flexible working were also included but were insignificant so excluded from the final models. Government region controls were also added but small sample sizes meant that we did not find consistent differences across regions.
4.3 Occupational downgrading and job changes
4.3.1 Descriptive statistics
We now turn to considering the relationship between childbirth and occupational downgrading following birth. We start by examining the frequency of occupational mobility (as defined earlier) and its relationship to the employment trajectories we have described.
As in previous studies (for example, Dex, Joshi and Ward, 2008; Paull, 2018) we produce simple descriptive statistics on the share of women experiencing occupational downgrading over the period between one year prior to birth to the year of birth (t=0), one year after (t+1), 3 years after (t+3) and 5 years after birth (t+5). Results are reported in Figure 7 and show the share of new parents returning to occupations of the same status, upgrading, downgrading or leaving the labour market. This last category is included so we can compare the experience of mothers and fathers. This is important because, due to the selected nature of those mothers who return to work, by excluding non-returners we would underestimate the detrimental effect of childbirth on subsequent occupational attainment. The statistics on job downgrading are reported separately for those following each of the 3-year post-birth employment sequences identified previously.
The data shows that, as in previous studies (for example, Aisenbrey, Evertsson and Grunow, 2009), among those mothers who return to work the vast majority go back to a job with the same occupational status (96% of full-time returners and 97% of those returning part-time); occupational mobility is only seen over a longer period of time. However, as around 20% of new mothers exit the labour force, the total share of mothers who return to work in a job with the same occupational status is 77%, with just 1.5% upgrading and 2% downgrading on their immediate return to work. In contrast, new fathers are much more likely to occupationally upgrade or downgrade in the year their child is born (7% and 8% respectively), while 4% exit employment.
Figure 9: Occupational up and downgrading among new mothers and fathers up to 5 years after birth
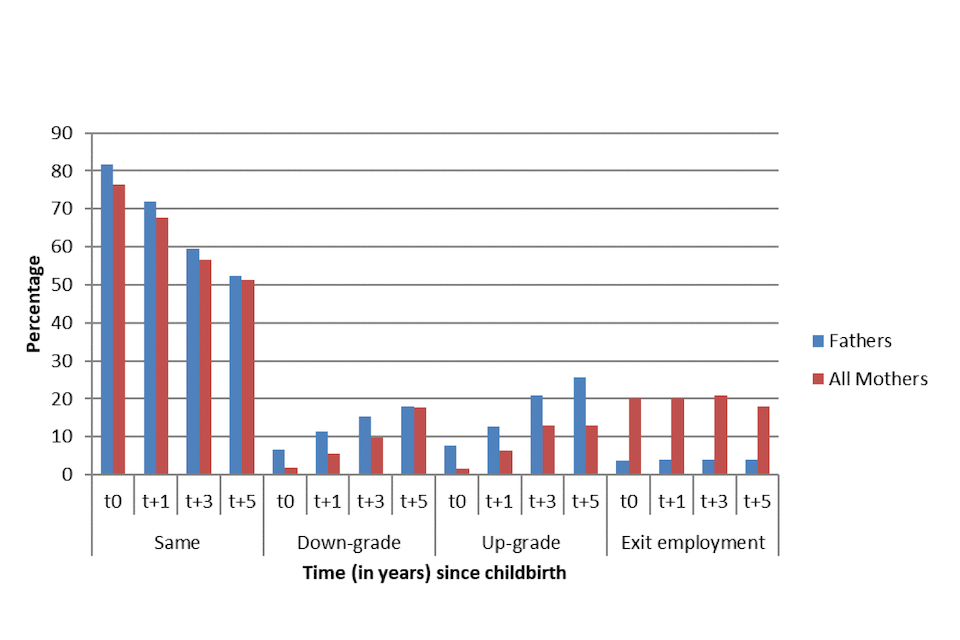
Note: The sample includes all those who were either in full or part-time employment prior to birth and who were present in the dataset for at least 3 years. The time t0 refers to the occupation that parents return to the year the child was born, with t+1, t+3 and t+5 showing occupational mobility over 1, 3 and 5 years after birth. * refers to 3-year job clusters defined in Figure 5.
Looking over a longer period of time we observe much greater mobility. Five years after birth:
- 13% of mothers and 26% of fathers have occupationally upgraded
- 18% of both men and women have downgraded
- 18% of women and 4% of men have left employment
Differences in women’s risk of occupational downgrading are also reported by return to work cluster. We find relatively small differences in patterns of occupational mobility between full- and part-time returners. Those whose careers exhibit most mobility are those who return to work after a break and those who return to work part-time and then exit employment, although small sample sizes mean we do not report results here.
Occupational mobility is likely to be related to whether employees change employer over time. Table 9 shows the share of men and women who change employer in the 5 years after birth. Again, change takes place slowly over time; only 7% of mothers move employer in the year after birth although this rises to over a quarter of mothers in the 3 years after birth and 70% 5 years later. There are few differences in employer mobility between full and part-time returners, or between mothers and fathers.
The bottom panel shows how occupational upgrading and downgrading vary for those who have, and have not, changed employers. The vast majority of women returning to the same employer following childbirth remain in the same occupational group 5 years later (90%) with just 1% downgrading and only 8% moving up. For men who stick with the same employer there is much more occupational change, both up and downwards (13% move down, 15% up). Moving employer is strongly linked to changes in occupational status: 32% of new mothers who changed employer upgraded and 21% downgraded. For men, changing employer is also linked to higher mobility, with 40% of those moving employer upgrading and 23% downgrading 5 years after birth.
Table 9: Job changes and occupational downgrading following childbirth
Share changing employer (%):
| Time since birth | All | Women: FT returner | Women: PT returner | Men: All |
|---|---|---|---|---|
| 1 year later | 7.7 | 7 | 7.2 | 10 |
| 3 years later | 29.2 | 27.7 | 24.6 | 30 |
| 5 years later | 71.2 | 67.2 | 69.2 | 58 |
Occupational mobility and employer change (%):
| Occupational status (compared to t-1) | Time since birth | Women: All | Women: Same employer | Women: New employer | Men: All | Men: Same employer | Men: New employer |
|---|---|---|---|---|---|---|---|
| Same | 1 year later | 84.9 | 91 | 57.1 | 74.9 | 81.5 | 46.2 |
| 3 years later | 71.4 | 84.3 | 51.5 | 62.2 | 75.9 | 39.9 | |
| 5 years later | 63.8 | 90.4 | 47.1 | 54.5 | 71.1 | 36.1 | |
| Downgrade | 1 year later | 7.2 | 5 | 14.3 | 11.9 | 8.3 | 26.2 |
| 3 years later | 12.4 | 7.2 | 17.8 | 16 | 9.3 | 25.7 | |
| 5 years later | 15.1 | 1.4 | 20.7 | 18.8 | 13.5 | 23.4 | |
| Upgrade | 1 year later | 7.9 | 4 | 28.6 | 13.2 | 10.1 | 27.7 |
| 3 years later | 16.3 | 8.5 | 30.7 | 21.8 | 14.8 | 34.5 | |
| 5 years later | 21.2 | 8.2 | 32.2 | 26.7 | 15.4 | 40.5 |
Note: as Table 9 definition of occupational mobility. Table 10 includes only those who returned to work.
4.3.2 ’Choosing’ to downgrade? Job characteristics, compensating job features and the return to work
The final part of our analysis on occupational downgrading assesses the question of why, and when, occupational downgrading or upgrading occurs. Table 10 reports results from a multinomial logit model of the risk of upgrading or downgrading. As before, we report results where models are run separately with industry and occupation observed prior to birth. All results are reported vis- à-vis remaining in a job with the same occupational status.
The covariates on the association between the risk of up- or downgrading and individual and family characteristics suggest that older mothers (over 35) and those with middle levels of education (compared to women with degrees) are less likely to upgrade in the 3 years after returning to work. The number of children a woman had prior to birth, or whether she is single, have no statistically significant impact on the probability of returning.
The second set of covariates shows how occupational mobility is related to job characteristics. Those in lower grade occupations (in particular routine occupations) are more likely to upgrade than those in professional occupations, although this may reflect a ceiling effect for those in professional and managerial occupations.
We also find that:
- those working in health or education are less likely to change occupational status (either upgrading or downgrading) following their return to work
- those in the public sector are also less likely to either upgrade or downgrade, and are more likely to remain in a job with the same occupational rank
The results again indicate that the positive effect of working in sectors such as health, on women’s career trajectories that are found in the US, may not be replicated in the UK.
The final set of covariates address the question of whether women who ‘choose’ jobs with features that are more conducive to caring are more likely to downgrade. To examine this question, we look at changes in 2 characteristics: commuting time and hours of work, as well as at changing employer. We find that:
- changing employers is strongly related to both occupational upgrading and downgrading
- longer commute times are associated with upgrading: those increasing their commute by more than 10 minutes are 3 times more likely to upgrade – however, reduced commuting time has no impact on the risk of downgrading
- Increases in working hours are weakly associated with a greater chance of occupational upgrading
Finally, we find no difference in the likelihood of occupational up- or downgrading between those returning to work full- or part-time. However, those that leave the labour force before returning exhibit greater mobility, and in particular downward mobility.
Table 10: Multinomial logit model of the risk of occupational up and downgrading
Personal and family characteristics:
| Personal and family characteristics | Downgrade RRR | P value | Upgrade RRR | P value | ||
|---|---|---|---|---|---|---|
| Age (base: under 25) | ||||||
| 25 to 34 | .691 | .498 | .613 | .269 | ||
| 35 to 52 | .565 | .381 | .297 | ** | .028 | |
| Education (base: high) | ||||||
| Medium | .812 | .648 | .628 | ** | .021 | |
| Low | 2.106 | .105 | .982 | .388 | ||
| Single (base: partnered) | .696 | .636 | .448 | .176 | ||
| Number children before birth (base: first child) | ||||||
| Second child | .303 | .661 | 1.527 | .167 | ||
| 3rd or further birth | .517 | .258 | 1.148 | .768 |
Pre-birth job characteristics:
| Pre-birth job characteristics | Downgrade RRR | P value | Upgrade RRR | P value | ||
|---|---|---|---|---|---|---|
| Models with industry and occupation | ||||||
| Occupation (base: management and professional) | ||||||
| Intermediate | .782 | .566 | 2.530 | ** | .014 | |
| Routine | .222 | *** | .008 | 3.353 | *** | .001 |
| Industry (base: other) | ||||||
| Retail | 1.504 | .457 | .984 | .973 | ||
| Finance | 2.167 | .156 | 1.822 | .283 | ||
| Education | .335 | ** | .017 | .497 | * | .072 |
| Health | .136 | *** | .001 | .172 | *** | .001 |
| Public admin | .834 | .771 | 1.880 | .190 | ||
| Voluntary | 1.449 | .389 | .561 | .173 | ||
| Models with sector and occupation | ||||||
| Sector (base: private) | ||||||
| Public | .207 | *** | .000 | .447 | *** | 006 |
| Charity or other | 2.309 | .131 | .754 | .699 |
Change in job characteristics:
| Change in job characteristics | Downgrade RRR | P value | Upgrade RRR | P value | ||
|---|---|---|---|---|---|---|
| Change in commute time (base: same +/- 10 minutes) | ||||||
| Increase more than 10 minutes | 1.309 | .559 | 3.296 | *** | .001 | |
| Fall more than 10 minutes | 1.293 | .553 | .631 | .284 | ||
| Change in job hours (base: same) | ||||||
| Increase 4 or more hours | .726 | .524 | 2.043 | * | .065 | |
| Decrease 4 or more hrs | .591 | .155 | 1.007 | .983 | ||
| New employer | 2.589 | ** | .045 | 6.315 | *** | .000 |
| Return to work trajectory (base = FT) | ||||||
| Return part-time | 1.033 | .919 | .848 | .563 | ||
| OLF -> return to work | 2.009 | .162 | 3.058 | ** | .034 |
Notes: p<0.1,**p<0.05, **p<0.01. The model is calculated for the subsample of women who were FT or PT employees prior to birth and returned to work as FT or PT employees at any point within 3 years after child birth. The coefficients reported are for the models run with industry and occupational controls. Coefficients on sector are those for models run on the same set of covariates, excluding industry but including sector. This specification does not lead to a change in the significance – or to any substantial changes in the magnitude – of the other coefficients. Models also include controls for standard government region. Sample size: 718.
4.4 Couples’ careers: interdependencies in mothers’ and fathers’ risk of occupational downgrading
In the final part of the report we assess whether couples’ career trajectories are correlated. Table 11 reports descriptive information on: (i) couples’ work patterns and (ii) couples’ earning patterns before birth and 3 years later. There is most change in the employment patterns of women following birth in couples where both partners employed full-time prior to birth. Among these couples:
- 48% were both employed full-time 3 years later
- 36% of women reduced their hours to part-time work, with the male partner continuing to work full-time
- in 15% of couples the woman left employment and the man continued to work full-time
Among couples where the man worked full-time and the woman either worked part-time or was out of the labour force, childbirth has a smaller effect on household employment patterns. Among couples where the man was full-time and the woman part-time, 61% of women remained part- time, with a further 29% leaving employment and 9% moving to full-time work. For women not in employment prior to birth, but with a full-time employed male partner, 74% remained out of work, 11% moved to part-time work and 8% to full-time employment 3 years after birth.
Table 11: Couples’ employment before and 3 years after birth
| Pre-birth | 3 years after birth: Both FT | 3 years after birth: Male FT, female PT | 3 years after birth: Male FT, female OLF | 3 years after birth: Both OLF | Total % |
|---|---|---|---|---|---|
| Both FT | 48.1 | 36.2 | 15.3 | 1 | 100 |
| Male FT, Female PT | 8.8 | 60.6 | 28.5 | 3 | 100 |
| Male FT, Female OLF | 7.8 | 11.6 | 73.6 | 7 | 100 |
| Both OLF | 2 | 4.1 | 18.4 | 75.5 | 100 |
| N | 161 | 204 | 187 | 50 | 602 |
Note: the proportion of males in part-time employment is too small to be reported. Employees and those out of labour force prior to childbirth are included in the table.
These results highlight how gendered employment patterns are following childbirth, with men by and large remaining in full-time work while women reduce their hours. Once women shift to part- time work or leave employment, the probability of returning to full-time work is slim 3 or 5 years after birth.
Table 12 shows earnings - or ‘breadwinning’ – patterns among couples and how this changes before and after childbirth. As described below, families are described as being male breadwinner (man commanding >60% of the head and spouses’ joint weekly earnings), female breadwinner (equivalently defined for women) or contributing ‘equal shares’ of earnings to household income.
Again, we show emerging earnings patterns from the year prior to birth up to 3 years after.
Prior to childbirth, in 54% of couples the man was the main earner with one-fifth having a sole male breadwinner, while in a third the man was the main earner. Couples earned equal share in 31% of couples with 12% having a female main breadwinner and 2% a sole female earner. Three years after birth the pattern of men being the dominant earner is reinforced with 69% of families having a sole male earner or male breadwinner and the proportion of couples where men and women earned equal shares fell to 20%.
Where men were the main earner prior to birth, they almost always remained the sole or main breadwinner after birth. However, even among those couples where partners earned equal shares prior to birth, 3 years after birth 19% were headed by a sole male earner and 31% by a male breadwinner. For couples where the woman was the main breadwinner prior to birth, just 46% remained the main earner 3 years later, while 23% earned equal share and 30% had a main or sole male earner.
Table 12: Couples’ earnings patterns 3 years after birth (%)
| Pre-birth (t-1) | Post birth (t+3): Sole male earner | Post birth (t+3): Male breadwinner | Post birth (t+3): Equal shares | Post birth (t+3): Female breadwinner | Total % | % families pre-birth (t-1) |
|---|---|---|---|---|---|---|
| Sole male earner | 85.7 | 12.6 | 1.7 | 0 | 100 | 21.3 |
| Male breadwinner | 17.7 | 66.8 | 11.8 | 3.7 | 100 | 33.5 |
| Equal shares | 19 | 31 | 40.2 | 9.8 | 100 | 31.2 |
| Female breadwinner | 11.5 | 19.2 | 23.1 | 46.2 | 100 | 11.8 |
| Sole female breadwinner | - | - | - | - | - | 2.2 |
| % | 31.7 | 37.5 | 20.1 | 10.8 | 100 | 100 |
| N | 177 | 209 | 112 | 60 | 558 | 558 |
Note: All those with positive earnings, including from self-employment, are included in the sample. The sample consists of those who stayed in a couple between t-1 and t+3. Male / female breadwinner is defined as one of the partners earning more than 60% of head and spouse joint earnings (gross). These families include only those with positive earnings for both the man and woman. Equal shares are defined if each of the partners brings 40-60% of joint earnings. Sole male earner households are where women’s earnings contribute 0% of the joint earnings and sole female earners are equivalently defined.
The final step of our analysis repeated the earlier analysis, running multinomial logit models but this time including controls for the relative earnings of household member. Results are reported in Table 13. The findings show that women who are equal earners, or the main earner in the couple, are twice as likely to return to work full-time.
Table 13: Multinomial logit models of employment pathways: coefficients on family earnings patterns
| Breadwinner at t-1 (base male breadwinner) | Return full-time: RRR | Return full-time: P>z | Return part-time: RRR | Return part-time: P>z | Out of labour force to employment: RRR | Out of labour force to employmentP>z |
|---|---|---|---|---|---|---|
| Equal earners | 1.872* | .07 | .813 | .501 | .492 | .198 |
| Female breadwinner | 2.422*** | .033 | .676 | .32 | 1.41 | .554 |
Notes: Models are run only on ‘potential returners’ in couples who remained together for 3 years after birth. Controls are the same as those in table 8, with additional controls for couples’ earnings status. Sample size: 763.
Finally, in Table 14 we estimate the probability of being an ‘equal earner,’ or a female breadwinner, 3 years after birth. Our results suggest that those working in the public sector are more likely to be main breadwinners or to contribute equal earnings shares to the household. We also find that there is considerable persistence over time, with those who contributed equal shares to the family budget, or who out-earned their partner prior to birth being more likely to make an equal, or greater, contribution to household income 3 years later.
The same models were also run on the risk of occupational downgrading. The results indicated that being a main female breadwinner was also linked to reduced chances of occupational upgrading. However, this may reflect a ‘ceiling’ effect, as many women were in managerial occupations.
Table 14: Multinomial logit models of family earnings patterns 3 years after birth
| Equal earners: RRR | Equal earners: P>z | Female breadwinner: RRR | Female breadwinner: P>z | |||
|---|---|---|---|---|---|---|
| Prior status (base: FT employee) | ||||||
| PT employee | .506 | ** | .03 | .631 | .303 | |
| Sector (base: private) | ||||||
| Public | 1.927 | ** | .016 | 2.228 | ** | .032 |
| Charity/ other | .791 | .673 | .832 | .828 | ||
| % PT in occupation (base: under 25%) | ||||||
| 25 to 49% | .729 | .258 | .463 | ** | .042 | |
| 50% or more | .452 | * | .09 | .163 | ** | .025 |
| Occupation (base: professional) | ||||||
| Intermediate | 1.030 | .938 | .955 | .932 | ||
| Routine | .936 | .871 | 1.01 | .987 | ||
| Firm Size (base: micro, under 10) | ||||||
| Small (10 to 49) | 1.31 | .513 | 1.49 | .59 | ||
| Med (50 to 199) | 1.623 | .267 | 4.37 | .046 | ||
| Large (200 and above) | .885 | .768 | 2.20 | .273 | ||
| Breadwinner at t-1 (base: male breadwinner) | ||||||
| Equal earners | 4.511 | *** | 0 | 3.36 | *** | .019 |
| Female breadwinner | 4.33 | *** | .001 | 36.42 | *** | 0 |
Note: The models are run on the sample of mothers in couples who were in employment prior to birth (including self- employed). The control variables are the same as in table 11 with additional control for couple breadwinner status at t- 1. Sample size: 586.
5. Conclusions
This report has examined how childbirth affects men’s and women’s employment trajectories, and their risk of occupational downgrading, in the years after birth. Using sequence analysis, we show that just 1 in 5 new mothers return to and remain in full-time work in the first 3 years, with this share falling to 15% after 5 years. Among those who were working full-time prior to birth, just 44% follow a full-time employment trajectory 3 years after returning from maternity leave and this share falls to 31% 5 years later. There is considerable persistence in the labour force behaviour of new mothers, with shifts between different employment statuses being rare in the first 3 years after birth. Over 5 years there is more movement, although the longer the period since birth the more likely women are to have withdrawn from full-time employment. Few mothers move into full-time work from working part-time or non-employment.
Women’s employment trajectories differ sharply from those of men: 3 years after childbirth 90% of men are in full-time work or self-employed, and those that change their employment status are likely to move into full-time jobs from being out of the labour force or working part-time work in the 3 years after birth.
Modelling the probability of returning to work we find that, once we condition on employment status prior to birth, the employment trajectories followed by women after childbirth are only weakly correlated with individual and family characteristics. Instead, we find that prior employment status is a key predictor of returning to work, particularly full-time, and suggests that policy should focus on getting young women into work before childbirth if they are to achieve economic equality in later life. Of particular significance is the result on parity, which we find to have no independent effect on the probability of following any particular employment pathway: the employment status of women prior to birth, rather than the number of children she has, is an important factor for predicting the probability of returning to full-time work. Nonetheless, it remains the case that the birth of a child is associated with a reduced probability of full-time work, with each birth having an independent effect on the probability of returning to full-time work. As a result, the more children a woman has, the lower the likelihood she will work full-time.
We find that job characteristics are only weakly related to patterns of return to work and occupational downgrading. Those working in education are more likely to go back to full-time work, while those in the public sector and working in larger firms are more likely to work either full- or part-time. However, while those in education or public sector are more likely to go back to work, they are less likely to move up or down the occupational ladder in the years after birth. We do not find significant differences in the patterns of return to work, or occupational mobility, between those working in finance, health or other industries. This result suggests that the differences in gender pay gaps between industries reported by Goldin for the US may not be replicated in the UK, where women with children are much less likely to work full-time. This again highlights key differences between the UK and US highlighted in previous studies. For example, there are differences in the ways in which women’s careers unfold following childbirth. Specifically, studies using US data find that, while there is a wage penalty to motherhood, they do not find that the size of this penalty increases over time (Loughran and Zissimoupoulous, 2009). In contrast, in the UK wage penalties to motherhood grow in the years following birth (Harkness, 2016). The high rate of part-time working among new mothers is likely to be an important contributor to this (Costa Dias,Joyce and Parodi, 2018), and to affect women across industries and occupations. As a result, women in the UK perform less well following childbirth even in those industries with more favourable conditions for gender equality that Goldin describes.
30% of new mothers, and 20% of first time mothers, were not working in the year before birth. These women were very unlikely to return to work subsequently, with fewer than 1 in 4 returning to work in the subsequent 3- to 5-years. These women who are persistently outside the labour force are typically younger, less educated and more likely to be single than those holding a job prior to childbirth.
The results on occupational downgrading indicate that downgrading is a gradual process which takes place 3 to 5 years after birth. Women who return to work almost always return to a job with the same occupational status as the one they left. Men and women both face a similar risk of downgrading in the years after birth; however, for women the chance of upgrading is lower than that for men. We find no difference between women who return full- or part-time in the risk of downgrading. However, those that leave employment and later return to work, either full- or part-time, are 3 times more likely to downgrade than those who do not have a break.
The results on occupational change suggest that it is not so much downgrading, but rather a reduction in the probability of upgrading that reduces the likelihood of women progressing at work. For those who do not change employer there is very little change in occupational status – either upwards or downwards – over time (a result that does not hold for men). These returners risk becoming stuck in their job role, with limited career progression. We also find that working in the public sector, or in education or health, is associated with lower levels of occupational mobility for women. A final, and strongly significant finding is that increased commuting time is strongly linked with increased upward occupational mobility: those whose daily commute increases by more than 10 minutes are 4 times more likely to upgrade. On the other hand, reduced commuting time has no impact on the risk of either upward or downward occupational mobility.
Interestingly, we find that changes in working hours have no effect on occupational mobility over the period we study.
The analysis of couples’ employment trajectories suggests that gendered labour market patterns – which are observed prior to birth – are reinforced in the years following birth as the employment and earnings shares of those in couples diverge. An exception is among the 10% of couples where the woman was the main breadwinner prior to birth: among these couples we find that almost half (46%) remain the main earner in the years after birth with a further 23% becoming ‘equal’ earners. Moreover, those who earned more than their partner prior to birth are more likely to return to full-time work than when the man is the main earner. In terms of career progression, however, we find little evidence that being a main earner either enhances or diminishes women’s chances of career progression vis-à-vis other mothers.
One limitation of this study is that we have only been able to examine trajectories 3 to 5 years after birth. Over a longer period, women’s career prospects may improve as children get older. While there is some evidence that employment rates increase with age of youngest child, the share working full-time remains relatively low. Moreover, pay gaps grow larger among women as they age (Costa Dias, Joyce and Parodi, 2018). Studies have shown that, using a longer series of data, women’s earnings plateau in the years after birth (Harkness, 2016), with no indication of improvement over time. The evidence presented here hints at some reasons why the pay gap may grow as women age. First, we show large divergences in men’s and women’s employment trajectories in the years following childbirth, with men more likely to move into full-time work while women increasingly withdraw. Second, a large number of women exit the labour market and those that return following a break are more likely to occupationally downgrade. Finally, even where women return to the same job, we show that they are less likely to progress at work than their male counterparts. These factors together suggest that the patterns observed in the 5 years after birth are unlikely to be reversed as children grow older.
Bibliography
Anyadike-Danes, M., and McVicar, D. (2010). My brilliant career: Characterizing the early labor market trajectories of British women from generation X. Sociological Methods and Research, 38(3), 482-512.
Aisenbrey, S., Evertsson, M., and Grunow, D. (2009). Is there a career penalty for mothers’ time out? A comparison of Germany, Sweden and the United States. Social Forces, 88(2), 573-605.
Blackaby, D. H., Carlin, P. S., and Murphy, P. D. (1998). What Difference a Wife Makes: The Effect of Women’s Hours of Work on Husbands’ Hourly Earnings. Bulletin of Economic Research, 50(1), 1-18.
Booth, A., Francesconi, M. and Frank, J. (2002) Temporary Jobs: Stepping Stones or Dead Ends?The Economic Journal, 112(480): pp. F189-F213
Budig, M. and England, P. (2001). The wage penalty for motherhood. American Sociological Review, 66(2):204-22
Costa Dias, M., Joyce, R and Parodi, F (2018). The gender pay gap in the UK: children and experience in work, IFS Working Paper 18/02
Connolly, S., and Gregory, M. (2008). The part-time pay penalty: earnings trajectories of British women. Oxford Economic Papers, 61(suppl_1), i76-i97
Dex, S., and Bukodi, E. (2012). The Effects of Part-Time Work on Women’s Occupational Mobility in Britain: Evidence from the 1958 Birth Cohort Study. National Institute Economic Review, 222(1), R20–R37. https://doi.org/10.1177/002795011222200103
Dex, S., Ward, K., and Joshi, H. (2008). Gender differences in occupational wage mobility in the 1958 cohort. Work, Employment and Society, 22(2), 263–280. https://doi.org/10.1177/0950017008089104
Goldin C. (2014) A Grand Gender Convergence: Its Last Chapter. American Economic Review. 2014;104 (4) :1091-1119
Goldin C, Katz LF. (2016) A Most Egalitarian Profession: Pharmacy and the Evolution of a Family Friendly Occupation. Journal of Labor Economics, 34 (3): 705-745
Harkness, S. (1996). The gender earnings gap: evidence from the UK. Fiscal Studies, 17(2), 1-36. Harkness, S. (2016). “The Effect of Motherhood and Lone Motherhood on the Employment and Earnings of British Women: A Lifecycle Approach.” European Sociological Review.
Harkness, S., and Waldfogel, J. (2003). The family gap in pay: evidence from seven industrialized countries. Research in Labor Economics, 22:369-414.
Jacobsen, J. P., and Rayack, W. L. (1996). Do men whose wives work really earn less?. The American Economic Review, 86(2), 268-273.
Killewald, A. (2013). A reconsideration of the fatherhood premium: Marriage, coresidence, biology, and fathers’ wages. American Sociological Review, 78(1), 96-116.
Killewald, A., and Gough, M. (2013). Does Specialization Explain Marriage Penalties and Premiums? American Sociological Review, 78(3), 477–502.
Lesnard, L. (2010). Setting cost in optimal matching to uncover contemporaneous socio-temporal patterns. Sociological Methods and Research, 38(3), 389-419.
Loughran, D., and Zissimopoulos, J. (2009). Why wait? The effect of marriage and childbearing on the wages of men and women. Journal of Human Resources, 44(2), 326-349
Lundberg, S., and Rose, E. (2000). Parenthood and the earnings of married men and women. Labour Economics, 7(6), 689-710.
Mandel, H., and Semyonov, M. (2006). A welfare state paradox: State interventions and women’s employment opportunities in 22 countries. American journal of sociology, 111(6), 1910-1949. ONS, (2018). Gender Pay Gaps in the UK, 2018. https://www.ons.gov.uk/employmentandlabourmarket/peopleinwork/earningsandworkinghours/bulletins/gen derpaygapintheuk/2018
Paull, G. (2018). Quantitative analysis of those returning to the labour market following a break to care for others. Research report. Government Equalities Office. https://assets.publishing.service.gov.uk/government/uploads/system/uploads/attachment_data/file/717833/ Characteristics_of_Returners_and_Potential_Returners.pdf
Regge, M. and Solli, F. (2013). The Impact of Paternity Leave on Fathers’ Future Earnings. Demography, 50(6): 2255-2277. Stewart, K. (2014). Employment Trajectories and Later Employment Outcomes for Mothers in the British Household Panel Survey: An Analysis by Skill Level. Journal of Social Policy, 43(1): 87-108.
Waldfogel, J. (1998). Understanding the “Family Gap” in Pay for Women with Children. The Journal of Economic Perspectives, 12(1), 137-156. Retrieved from http://www.jstor.org/stable/2646943
Waldfogel, J. (1999). The impact of the family and medical leave act. Journal of Policy Analysis and Management: The Journal of the Association for Public Policy Analysis and Management, 18(2), 281-302.
Yu, W., and Kuo, J. C.L. (2017). The Motherhood Wage Penalty by Work Conditions: How Do Occupational Characteristics Hinder or Empower Mothers? American Sociological Review, 82(4), 744–769. https://doi.org/10.1177/0003122417712729.