Acquired carbapenemase-producing Gram-negative bacteria in England: October 2020 to June 2023
Updated 17 April 2024
Applies to England

© Crown copyright 2024
This publication is licensed under the terms of the Open Government Licence v3.0 except where otherwise stated. To view this licence, visit nationalarchives.gov.uk/doc/open-government-licence/version/3 or write to the Information Policy Team, The National Archives, Kew, London TW9 4DU, or email: psi@nationalarchives.gov.uk.
Where we have identified any third party copyright information you will need to obtain permission from the copyright holders concerned.
This publication is available at https://www.gov.uk/government/publications/carbapenemase-producing-gram-negative-bacteria-laboratory-surveillance/acquired-carbapenemase-producing-gram-negative-bacteria-in-england-october-2020-to-june-2023
Background
Since 1 October 2020, all diagnostic laboratories in England have a duty to notify the following via the UK Health Security Agency (UKHSA)’s Second Generation Surveillance System (SGSS):
- acquired carbapenemase-producing Gram-negative bacteria identified in human samples
- the results of any antimicrobial susceptibility test and carbapenem resistance mechanism in any of the causative agents listed in Schedule 2 of the Health Protection (Notifications) Regulations 2010
This requirement was launched in conjunction with the national Framework of actions to contain carbapenemase-producing Enterobacterales (CPE), which sets out a range of measures that, if implemented well, will help health and social care providers minimise the impact of CPE.
The analyses below are based on data relating to notifications of confirmed acquired carbapenemase-producing Gram-negative bacteria between 1 October 2020 and 30 June 2023 in England. The data was extracted on 15 August 2023 from both UKHSA’s voluntary surveillance database, SGSS, and the Antimicrobial Resistance and Healthcare-Associated Infections (AMRHAI) Reference Unit database.
Rates of acquired carbapenemase-producing Gram-negative bacteria were calculated using mid-year resident population estimates for the respective year and geography. Geographical analyses were based on the patient’s residential postcode. Where this information was unknown, the postcode of the patient’s GP was used. Failing that, the postcode of the reporting laboratory was used. Cases in England were further assigned to one of 9 local areas, formed from the administrative local authority boundaries.
As patients may have more than one positive specimen taken, specimens taken from the same patient that yielded growth of the same pathogen and carbapenemase within a 52-week period from the initial positive sterile site specimen, screening site specimen or other specimen type (grouped together), were regarded as comprising the same episode and were de-duplicated. Carbapenemase-producing Gram-negative bacteria referred isolates and local laboratory isolates were combined for this de-duplication process, with resistance mechanism results from the AMRHAI Reference Unit retained preferentially where patient specimen overlap occurred. This method differs slightly from the weekly causative agent notification data, where data is not de-duplicated incorporating specimen type. In addition, the data presented in the weekly notification reports utilises SGSS reports only.
The following report summarises trends and geographical distribution of carbapenemase mechanisms identified from Gram-negative bacteria in human samples. Species, mechanism, sample type, and age and sex of patients are also described. For the purposes of this report, quarters are calendar quarters, as such January to March is referred to as ‘Q1’, April to June is referred to as ‘Q2’, July to September is referred to as ‘Q3’ and October to December is referred to as ‘Q4’, alongside relevant years.
Microbiology services
For reference services, including species identification and confirmation of susceptibility testing results, laboratories should contact UKHSA’s AMRHAI Reference Unit in Colindale, London.
Table 1 summarises the carbapenemase gene families that are targeted using the routine polymerase chain reaction (PCR) applied to referred Enterobacterales, Pseudomonas spp. and Acinetobacter spp. that are suspected of harbouring an acquired carbapenemase gene. UKHSA strongly recommends that all diagnostic laboratories are able to detect at least the 4 carbapenemase families in bold (the ‘big 4’) using either PCR or immunochromatographic methods.
Where an ‘exceptional’ carbapenemase and species combination result (cells without a ¥ symbol in Table 1) has been identified, or where an unusual organism has been identified with an acquired carbapenemase (that is, any bacterial genera other than a member of the Enterobacterales, Pseudomonas spp. or Acinetobacter spp.), isolates should be sent to the AMRHAI Reference Unit for confirmation.
Table 1. Distribution of carbapenemase genes covered by AMRHAI Reference Unit molecular assay (based on AMRHAI data) [note 1]
| Carbapenemase family | Associated with common ‘host’ organism Enterobacterales | Associated common ‘host’ organism Pseudomonas spp. | Associated with common ‘host’ organism Acinetobacter spp. |
|---|---|---|---|
| KPC | ¥ | <10D | <10D |
| OXA-48-like | ¥ | <10D | 0 |
| NDM | ¥ | ¥ | ¥ |
| VIM | ¥ | ¥ | <10D |
| IMP | ¥ | ¥ | ¥ |
| IMI/NMC-A | ¥B | 0 | 0 |
| GES | ¥ | ¥ | <10D |
| FRI | <10 | 0 | 0 |
| SME | <10C ¥ | 0 | 0 |
| DIM | 0 | <10D | 0 |
| GIM | <10D | <10D | 0 |
| SIM | 0 | <10D | 0 |
| SPM | 0 | <10D | 0 |
| OXA-23-like | <10D | 0 | ¥ |
| OXA-40-like | 0 | 0 | ¥ |
| OXA-51-likeA | 0 | 0 | ¥ |
| OXA-58-like | 0 | 0 | ¥ |
View this table in the data tables file
Notes to Table 1
Note 1. Table 1 uses the following symbols:
¥ = combinations of mechanism and species would not be considered as exceptional results.
A = intrinsic to A. baumannii and only expressed when associated with an insertion element.
B = almost exclusively reported in Enterobacter spp. with less than a handful of reports in other genera.
C = reported only in Serratia marcescens.
D = fewer than 10 in total ever referred to AMRHAI Reference Unit.
Recent developments
Unusual acquired carbapenemase-producing Gram-negative bacteria referred to the AMRHAI Reference Unit in Q2 2023 consisted of 2 VIM-producing Acinetobacter spp. referred from the East and North West of England, one DIM-producing Pseudomonas aeruginosa and a further isolate of Proteus mirabilis positive for the gene encoding an OXA-23-like carbapenemase. All originated from clinically relevant sites rather than colonisations.
Samples from unusual combinations of organism and mechanism should be referred to the AMRHAI Reference Unit for confirmation. Follow-up of such unusual drug/bug combinations has shown that some were due to mixed cultures or reporting errors.
Specimen type
Between October 2020 and June 2023, there were 9,016 acquired carbapenemase-producing Gram-negative bacteria episodes. The majority were identified in screening samples, accounting for 70.3% of carbapenemase notifications, with only 4.9% reported in sterile site specimens (Table 2).
Table 2. Number and percentage of acquired carbapenemase-producing Gram-negative bacterial episodes by specimen type (England): October 2020 to June 2023 [note 2]
| Specimen type | All reports number | All reports percentage [note 4] | From AMRHAI number | From AMRHAI percentage [note 4] |
|---|---|---|---|---|
| Sterile site samples | 438 | 4.9 | 160 | 10.4 |
| Screening samples | 6,335 | 70.3 | 733 | 47.6 |
| Other samples [note 3] | 2,243 | 24.9 | 648 | 42.1 |
| All samples | 9,016 | 100.0 | 1,541 | 100.0 |
View this table in the data tables file
Notes to Table 2
Note 2. The AMRHAI Reference Unit actively encourages submission of sterile site isolates for carbapenemase confirmation; the distribution of specimen type will reflect this.
Note 3. Samples that do not fall into either ‘sterile site’ or ‘screening’ samples, for example, urine and lower respiratory tract specimens.
Note 4. The percentages presented in this table are column percentages, with the breakdown of specimen types shown for all reports and AMRHAI reports separately.
Quarterly trends
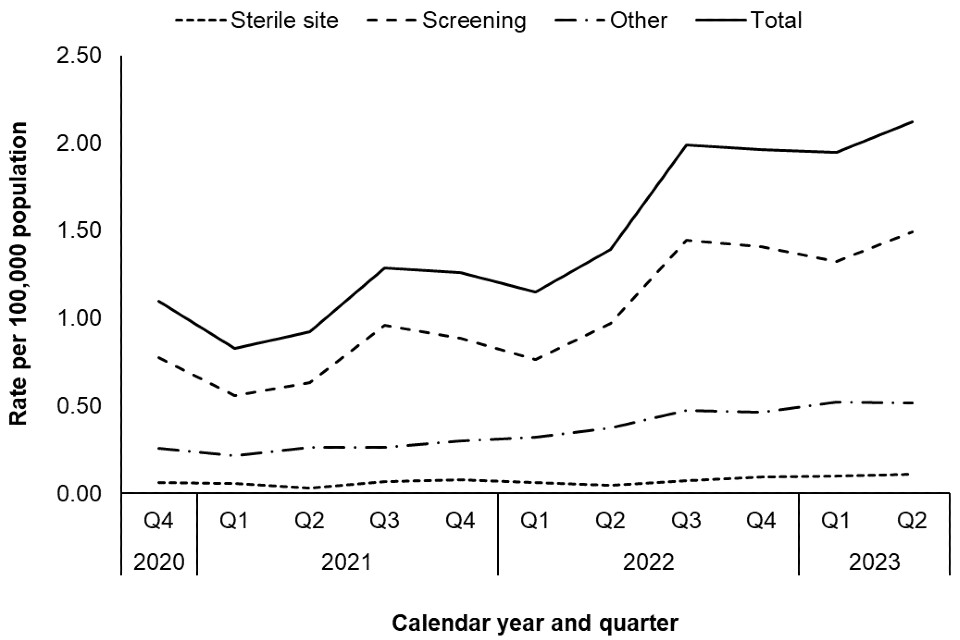
The quarterly rate of acquired carbapenemase-producing Gram-negative bacterial episodes between October 2020 and June 2023 is shown in Figure 1.
Although this quarter the rate of carbapenemase-producing Gram-negative bacterial episodes has slightly increased from 1.94 per 100,000 population in Q1 2023 to 2.12 per 100,000 population in Q2 2023, this rise was predominantly due to increases among screening samples, with the number of sterile site isolates remaining relatively stable (Figure 1). Most of this increase appears to correlate with increased detection relating to screening following localised hospital outbreaks.
Quarterly changes in rate of episodes may reflect an uptick in screening following changes to screening policy rather than an actual increase in incidence. Furthermore, as there are only 11 quarters of notification data, it is too early to conclude that there may be any seasonality, particularly in light of the COVID-19 pandemic, where quarterly changes may be affected by COVID-19 ‘waves’ seen during this period or associated with local carbapenemase-producing Gram-negative bacteria outbreaks.
The remaining data summaries in this report consider all samples grouped together.
Figure 1. Rate of acquired carbapenemase-producing Gram-negative bacteria episodes by specimen type and quarter (England): October 2020 to June 2023
Geographic distribution
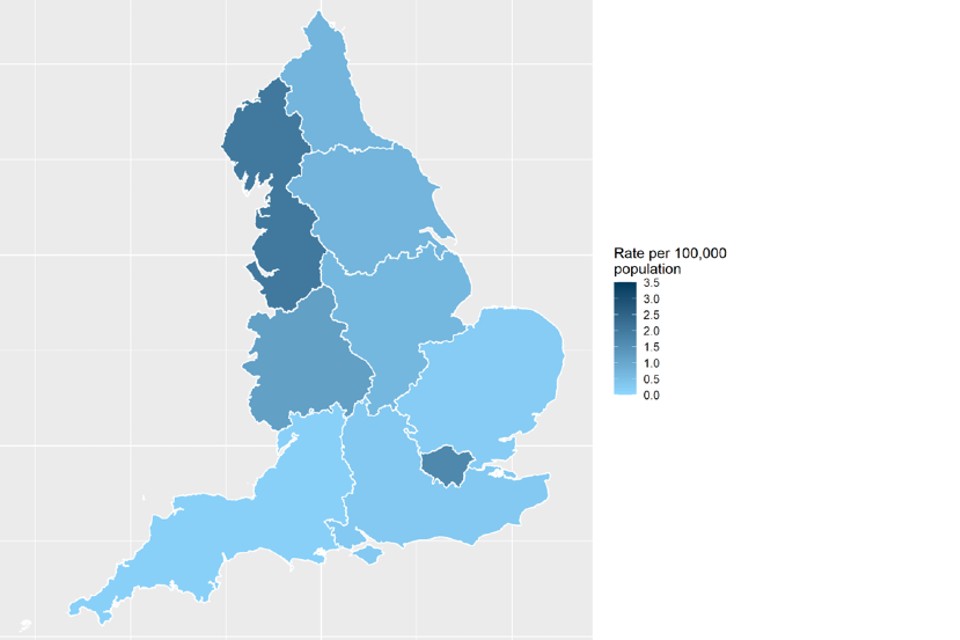
The rate of acquired carbapenemase-producing Gram-negative bacterial episodes varied by Office for National Statistics (ONS) region (Figure 2), with the highest overall rate between July 2022 and June 2023 reported in the North West (2.01 episodes per 100,000 population), followed by the London region (1.68 episodes per 100,000 population). The lowest incidence across the last year was reported in the East of England and South West regions (0.22 and 0.14 episodes per 100,000 population, respectively).
Figure 2. Geographical distribution of acquired carbapenemase-producing Gram negative bacterial incidence rates per 100,000 population (England): July 2022 to June 2023 [note 5]
Contains OS data © Crown copyright and database right 2018
Notes to Figure 2
Note 5. The region geography is based on the laboratory location and linked to the ONS data for regions.
The rate of acquired carbapenemase-producing Gram-negative bacterial episodes for each ONS region by calendar quarter is shown in Table 3.
The rate of bacterial episodes in all ONS regions increased from Q1 2023 to Q2 2023 in all regions except East Midlands, North East and Yorkshire and The Humber. A large increase was noted in West Midlands, where the rate increased from 2.22 to 3.31 per 100,000 population. The increase in West Midlands was only seen in screening samples. The largest decrease was noted in the North East, where the bacterial episode rate decreased from 2.04 in Q1 2023 to 1.25 episodes per 100,000 population in Q2 2023.
Table 3. Rate per 100,000 population of acquired carbapenemase-producing Gram-negative bacterial episodes by ONS region (England): July 2022 to June 2023
| ONS region | Q3 2022 number | Q3 2022 rate | Q4 2022 number | Q4 2022 rate | Q1 2023 number | Q1 2023 rate | Q2 2023 number | Q2 2023 rate |
|---|---|---|---|---|---|---|---|---|
| East Midlands | 128 | 2.62 | 66 | 1.35 | 48 | 0.98 | 43 | 0.88 |
| East of England | 33 | 0.52 | 32 | 0.50 | 25 | 0.39 | 33 | 0.52 |
| London | 275 | 3.13 | 283 | 3.22 | 384 | 4.37 | 388 | 4.41 |
| North East | 45 | 1.70 | 35 | 1.32 | 54 | 2.04 | 33 | 1.25 |
| North West | 347 | 4.68 | 346 | 4.66 | 306 | 4.12 | 345 | 4.65 |
| South East | 49 | 0.53 | 64 | 0.69 | 60 | 0.65 | 69 | 0.74 |
| South West | 19 | 0.33 | 21 | 0.37 | 16 | 0.28 | 17 | 0.30 |
| West Midlands | 119 | 2.00 | 168 | 2.82 | 132 | 2.22 | 197 | 3.31 |
| Yorkshire and The Humber | 106 | 1.93 | 92 | 1.68 | 74 | 1.35 | 73 | 1.33 |
View this table in the data tables file
Geographical differences in carbapenemase family
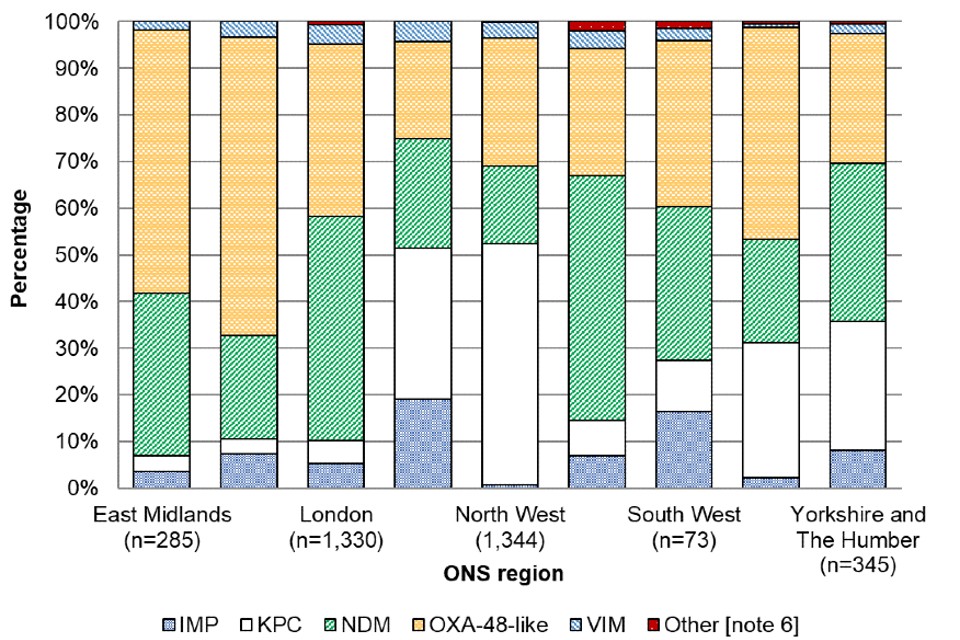
Between July 2022 and June 2023, the most common carbapenemase families reported across all regions were OXA-48-like (35.3%), NDM (31.7%), and KPC (24.9%). However, similarly to the incidence of episodes, the distribution of carbapenemase families identified also varied regionally (Figure 3).
In the North West, which had the highest incidence rate, the most common carbapenemase families identified were KPC (51.8%) and OXA-48-like (27.5%). KPC was not as common in any of the other regions, accounting for fewer than 32.3% of episodes in each region. For example, in London, which also had a high overall incidence rate, KPC accounted for 4.9% of episodes with NDM and OXA-48-like carbapenemases dominating (48.2% and 36.8%, respectively).
Another regional difference was observed in the North East and South West, where IMP was more common compared to any of the other regions, accounting for 19.2% and 16.4% of episodes, respectively (other regions reporting fewer than 8.1%). However, given the small number of carbapenemases reported in some regions, the diversity of carbapenemases reported is likely to be strongly impacted by individual outbreaks. In the 2 regions that had the lowest incidence rates, the most common carbapenemase family was OXA-48-like (63.9% in the East of England and 35.6% in the South West, respectively).
The distribution of carbapenemase families within each ONS region also varied by quarter. For example, the most common carbapenemase family identified in the South West was predominantly OXA-48-like in Q2 2023 but in Q3 2022 it was predominantly NDM. However, for both quarters the majority were identified in screening samples.
Figure 3. Geographical distribution of acquired carbapenemase-producing Gram-negative bacterial episodes by carbapenemase family (England): July 2022 to June 2023
Notes to Figure 3
Note 6. Other carbapenemase families include DIM, GES, GIM, IMI, OXA-23 and SME.
Distribution of species and carbapenemase family
Between July 2022 and June 2023, the most frequently isolated Gram-negative bacterial species with a confirmed acquired carbapenemase was Escherichia coli, accounting for 34.1% of all specimens. This was followed by Klebsiella pneumoniae, and Enterobacter spp., which accounted for 32.6% and 16.1% of all specimens, respectively (Table 4).
The carbapenemase family most frequently identified in E. coli and K. pneumoniae isolates was OXA-48-like (40.7% and 37.7%, respectively) and in Enterobacter spp. isolates was NDM (33.3%). In E. coli and K. pneumoniae isolates, this was followed by NDM and KPC carbapenemase families (38.7% and 17.7% in E. coli, and 30.6% and 27.5% in K. pneumoniae, respectively), and in Enterobacter spp. this was followed by KPC (26.5%) and OXA-48-like (24.0%) carbapenemase families.
Aside from the ‘big 5’ carbapenemase families (KPC, OXA-48-like, NDM, VIM and IMP), the AMRHAI Reference Unit also screens for rarer carbapenemase families, and it is recommended that all isolates suspected to produce a carbapenemase but negative for the ‘big 5’ carbapenemase families are referred to the AMRHAI Reference Unit for further screening. Between October 2020 and June 2023, DIM, GES, GIM, IMI, OXA-23 and SME carbapenemases were identified in small numbers (1, 26, 2, 23, 5 and 2, respectively), with only one isolate (GIM positive) being identified from an invasive specimen.
Table 4. Acquired carbapenemase-producing Gram-negative bacterial episodes by species and carbapenemase family (England): July 2022 to June 2023
| Species | IMP number | IMP % | KPC number | KPC % | NDM number | NDM % | OXA-48-like number | OXA-48-like % | VIM number | VIM % | Other number | Other % | Total number | % of Total per species |
|---|---|---|---|---|---|---|---|---|---|---|---|---|---|---|
| Acinetobacter spp. [note 7] | 13 | 22.8 | 2 | 3.5 | 35 | 61.4 | 4 | 7.0 | 3 | 5.3 | 0 | 0.0 | 57 | 1.3 |
| Citrobacter spp. | 12 | 5.2 | 56 | 24.5 | 46 | 20.1 | 105 | 45.9 | 10 | 4.4 | 0 | 0.0 | 229 | 5.1 |
| Enterobacter spp. | 89 | 12.2 | 193 | 26.5 | 243 | 33.3 | 175 | 24.0 | 20 | 2.7 | 9 | 1.2 | 729 | 16.1 |
| Escherichia coli | 23 | 1.5 | 274 | 17.7 | 598 | 38.7 | 629 | 40.7 | 20 | 1.3 | 0 | 0.0 | 1,544 | 34.1 |
| Other Escherichia spp. | 0 | 0.0 | 5 | 45.5 | 4 | 36.4 | 2 | 18.2 | 0 | 0.0 | 0 | 0.0 | 11 | 0.2 |
| Klebsiella oxytoca | 5 | 3.7 | 83 | 61.5 | 11 | 8.1 | 33 | 24.4 | 3 | 2.2 | 0 | 0.0 | 135 | 3.0 |
| Klebsiella pneumoniae | 33 | 2.2 | 453 | 30.6 | 407 | 27.5 | 557 | 37.7 | 28 | 1.9 | 1 | 0.1 | 1,479 | 32.6 |
| Other Klebsiella spp. | 0 | 0.0 | 16 | 20.3 | 20 | 25.3 | 39 | 49.4 | 4 | 5.1 | 0 | 0.0 | 79 | 1.7 |
| Morganella spp. | 0 | 0.0 | 0 | 0.0 | 4 | 36.4 | 7 | 63.6 | 0 | 0.0 | 0 | 0.0 | 11 | 0.2 |
| Pseudomonas aeruginosa [note 7] | 21 | 18.4 | 7 | 6.1 | 35 | 30.7 | 6 | 5.3 | 37 | 32.5 | 8 | 7.0 | 114 | 2.5 |
| Other Pseudomonas spp. [note 7] | 2 | 12.5 | 1 | 6.3 | 4 | 25.0 | 1 | 6.3 | 7 | 43.8 | 1 | 6.3 | 16 | 0.4 |
| Serratia spp. | 0 | 0.0 | 1 | 6.3 | 3 | 18.8 | 9 | 56.3 | 1 | 6.3 | 2 | 12.5 | 16 | 0.4 |
| Other Enterobacterales [note 8] | 1 | 1.0 | 36 | 34.3 | 28 | 26.7 | 32 | 30.5 | 6 | 5.7 | 2 | 1.9 | 105 | 2.3 |
| Other Gram-negative bacteria [note 9] | 2 | 40.0 | 1 | 20.0 | 2 | 40.0 | 0 | 0.0 | 0 | 0.0 | 0 | 0.0 | 5 | 0.1 |
| Total | 201 | 4.4 | 1,128 | 24.9 | 1,440 | 31.8 | 1,599 | 35.3 | 139 | 3.1 | 23 | 0.5 | 4,530 | 100.0 |
View this table in the data tables file
Notes to Table 4
Note 7. KPC and OXA-48-like in Pseudomonas spp. and OXA-48-like in Acinetobacter spp. are extremely rare, and results should be interpreted with caution. The numbers reported here have not been confirmed by the AMRHAI Reference Unit and laboratories identifying these unusual combinations should be referring such isolates to AMRHAI.
Note 8. Includes coliform, Cronobacter spp., Hafnia spp., Kluyvera spp., Leclercia adecarboxylata, Lelliottia amnigena, Mixta calida, Pantoea spp., Phytobacter ursingii, Pluralibacter gergoviae, Proteus spp., Providencia spp., Raoultella spp., and Shigella spp.
Note 9. The numbers reported here have not been confirmed by the AMRHAI Reference Unit and laboratories identifying these unusual combinations should be referring such isolates to AMRHAI.
Age and sex distribution
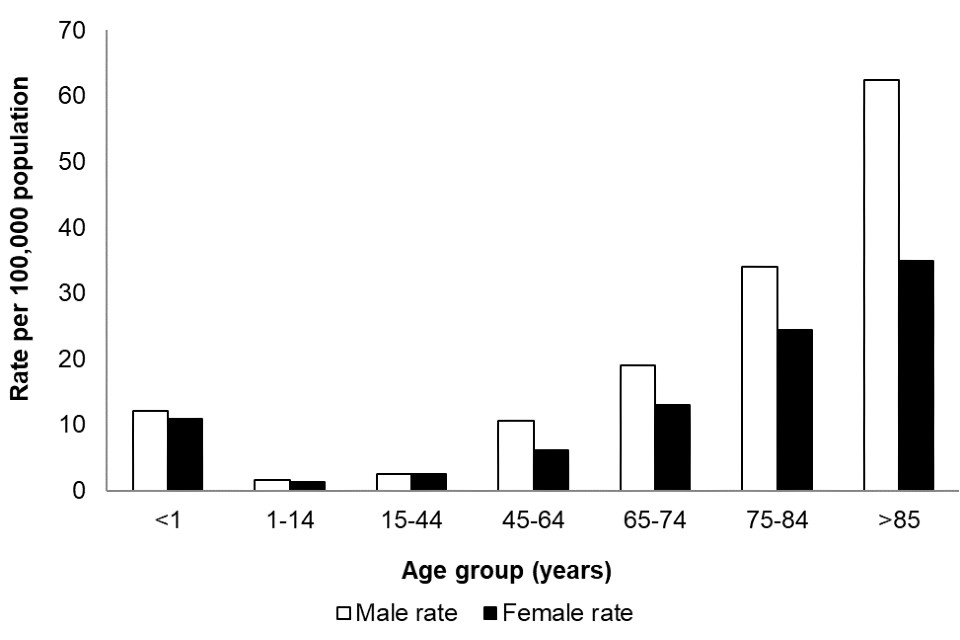
Between July 2022 and June 2023, the rate of acquired carbapenemase-producing Gram-negative bacterial episodes was highest among the oldest and youngest members of the population. A similar age pattern was noted for both sexes, although overall the rate was higher in males compared to females (overall rates of 9.1 and 6.8 episodes per 100,000 population, respectively: Figure 4). This aligns with the age group and sex distribution noted in previously published reports on Gram-negative bacteraemia such as E. coli, Klebsiella spp., P. aeruginosa and Enterobacter spp.
Figure 4. Rate [note 10] of acquired carbapenemase-producing Gram-negative bacterial episodes per 100,000 population by age and sex [note 11] (England): July 2022 to June 2023
Notes to Figure 4
Note 10. Rates have been calculated using cumulative reports across all 10 quarters of reporting, and as such cannot be compared to previous quarters (1).
Note 11. Information about patient sex is only recorded in 99.1% of cases.
Figure 4 shows the acquired carbapenemase-producing Gram-negative bacterial incidence rates by age group between July 2022 to June 2023, with the highest rate reported in those 85 years and over (45.3 per 100,000 population) followed by those aged 75 to 84 years (28.8 per 100,000 population). The overall rate of confirmed carbapenemases was 11.6 per 100,000 population in infants less than one year old.
Quarterly mandatory laboratory return reporting (July 2022 to June 2023)
Table 5. Quarterly mandatory laboratory returns (QMLR) for the total number of rectal swabs and faecal screening specimens taken for CPE screening by acute trust type [note 12] (England): July 2022 to June 2023
| Trust type [note 12] | Q3 2022 reported screens (%) | Q3 2022 total number screens | Q4 2022 reported screens (%) | Q4 2022 total number screens | Q1 2023 reported screens (%) | Q1 2023 total number screens | Q2 2023 reported screens (%) | Q2 2023 total number screens |
|---|---|---|---|---|---|---|---|---|
| Small (n=22) | 13 (59.1) | 3,910 | 15 (68.2) | 4,596 | 14 (63.6) | 6,813 | 14 (63.6) | 6,119 |
| Medium (n=21) | 18 (85.7) | 5,200 | 18 (85.7) | 4,494 | 18 (85.7) | 5,725 | 18 (85.7) | 6,216 |
| Large (n=24) | 21 (87.5) | 13,670 | 21 (87.5) | 14,040 | 19 (79.2) | 11,980 | 18 (75.0) | 11,811 |
| Multi-service (n=7) | 7 (100.0) | 2,116 | 7 (100.0) | 1,887 | 7 (100.0) | 2,219 | 6 (85.7) | 2,148 |
| Specialist (n=16) | 10 (62.5) | 4,267 | 10 (62.5) | 4,220 | 9 (56.3) | 3,845 | 9 (56.3) | 4,113 |
| Teaching (n=47) | 39 (83.0) | 88,994 | 38 (80.9) | 75,420 | 34 (72.3) | 59,020 | 32 (68.1) | 60,266 |
| Total | 108 (78.8) | 118,157 | 109 (79.6) | 104,657 | 101 (73.7) | 89,602 | 97 (70.8) | 90,673 |
View this table in the data tables file
Notes to Table 5
Note 12. Trust type obtained through NHS Digital Estate Return Information Collection (ERIC).
Reporting of quarterly totals of rectal swabs and faecal specimens taken for CPE screening was added to the mandatory QMLR section of the HCAI DCS in October 2019, and reporting became mandatory in October 2020. Between July 2022 and June 2023, there were 403,089 screens reported by 115 NHS trusts leading to an overall trust reporting rate of 83.9% (Table 5). This means that across the 4 quarters, there were 133 instances where an NHS trust did not submit a return. Of the acute trusts that reported screening data, 3.6% reported that they conducted zero screens.
Between July 2022 and June 2023, the number of trusts that reported screens was stable, ranging from 70.8% to 79.6%. Screening was more predominant in the acute teaching trusts, accounting for 70.4% of screening swabs taken during this time period. By reporting acute trust, the total screens reported for the quarter ranged from 0 to 20,088. The full list of reporting, including those that did not submit a return, is available in the appendix by individual NHS acute trust.
Reference
- UKHSA (2023). Quarterly laboratory surveillance of acquired carbapenemase-producing Gram-negative bacteria in England: October 2020 to December 2022 [appendix corrected]
Appendix
Appendix Table 1. QMLR returns for the total number of rectal swabs and faecal screening specimens taken for CPE screening by acute trust (England): July 2022 to June 2023
| Trust name | Trust type | Q3 2022 | Q4 2022 | Q1 2023 | Q2 2023 |
|---|---|---|---|---|---|
| Airedale NHS Foundation Trust | Small | 88 | 125 | 2,161 | 327 |
| Alder Hey Children’s NHS Foundation Trust | Specialist | 1,143 | 1,193 | 1,210 | 1,256 |
| Ashford and St Peter’s Hospitals NHS Foundation Trust | Medium | 265 | 461 | 257 | 228 |
| Barking, Havering and Redbridge University Hospitals NHS Trust | Teaching | 1,185 | 1,158 | 1,171 | 1,322 |
| Barnsley Hospital NHS Foundation Trust | Small | 38 | 30 | 43 | 228 |
| Barts Health NHS Trust | Teaching | 3,109 | 3,252 | 3,143 | 3,706 |
| Bedfordshire Hospitals NHS Foundation Trust | Medium | 125 | 161 | 109 | 112 |
| Birmingham Women’s and Children’s NHS Foundation Trust | Specialist | ||||
| Blackpool Teaching Hospitals NHS Foundation Trust | Teaching | 759 | 853 | 753 | 853 |
| Bolton NHS Foundation Trust | Medium | 342 | 339 | 358 | 697 |
| Bradford Teaching Hospitals NHS Foundation Trust | Teaching | 2,252 | 2,311 | 2,161 | 2,403 |
| Buckinghamshire Healthcare NHS Trust | Multi-service | 396 | 407 | 315 | 473 |
| Calderdale and Huddersfield NHS Foundation Trust | Large | 217 | 225 | 272 | 482 |
| Cambridge University Hospitals NHS Foundation Trust | Teaching | 1,627 | 1,815 | 1,719 | 1,876 |
| Chelsea and Westminster Hospital NHS Foundation Trust | Teaching | ||||
| Chesterfield Royal Hospital NHS Foundation Trust | Small | ||||
| Countess of Chester Hospital NHS Foundation Trust | Small | ||||
| County Durham and Darlington NHS Foundation Trust | Multi-service | 475 | 162 | 161 | 126 |
| Croydon Health Services NHS Trust | Medium | 400 | 272 | 493 | 119 |
| Dartford and Gravesham NHS Trust | Small | 309 | 217 | 263 | 230 |
| Doncaster and Bassetlaw Teaching Hospitals NHS Foundation Trust | Teaching | 177 | 193 | 222 | 304 |
| Dorset County Hospital NHS Foundation Trust | Small | 13 | 3 | 92 | 184 |
| East and North Hertfordshire NHS Trust | Large | 1,494 | 1,530 | 1,144 | 1,252 |
| East Cheshire NHS Trust | Small | ||||
| East Kent Hospitals University NHS Foundation Trust | Teaching | 426 | 312 | 328 | 462 |
| East Lancashire Hospitals NHS Trust | Large | 411 | 549 | 351 | 509 |
| East Suffolk and North Essex NHS Foundation Trust | Large | ||||
| East Sussex Healthcare NHS Trust | Large | 341 | 299 | 299 | 238 |
| Epsom and St Helier University Hospitals NHS Trust | Teaching | 288 | 246 | 277 | 265 |
| Frimley Health NHS Foundation Trust | Large | 745 | 757 | 679 | 793 |
| Gateshead Health NHS Foundation Trust | Medium | 22 | 15 | 55 | |
| George Eliot Hospital NHS Trust | Small | 254 | 213 | ||
| Gloucestershire Hospitals NHS Foundation Trust | Large | 103 | 100 | 129 | 131 |
| Great Ormond Street Hospital For Children NHS Foundation Trust | Specialist | 1,604 | 1,577 | 1,747 | 1,715 |
| Great Western Hospitals NHS Foundation Trust | Medium | 114 | 151 | 147 | 186 |
| Guy’s and St Thomas’ NHS Foundation Trust | Teaching | 433 | 492 | ||
| Hampshire Hospitals NHS Foundation Trust | Large | 288 | 333 | 380 | 258 |
| Harrogate and District NHS Foundation Trust | Small | 84 | 109 | 101 | |
| Homerton Healthcare NHS Foundation Trust | Teaching | 875 | 844 | 854 | 892 |
| Hull University Teaching Hospitals NHS Trust | Teaching | 309 | 209 | 211 | 219 |
| Imperial College Healthcare NHS Trust | Teaching | 20,088 | 19,472 | 18,424 | 17,909 |
| Isle of Wight NHS Trust | Multi-service | 30 | 52 | 35 | 44 |
| James Paget University Hospitals NHS Foundation Trust | Teaching | 29 | 33 | ||
| Kettering General Hospital NHS Foundation Trust | Small | 316 | 259 | 238 | 316 |
| King’s College Hospital NHS Foundation Trust | Teaching | 10,622 | 9,679 | ||
| Kingston Hospital NHS Foundation Trust | Medium | 113 | 88 | 100 | 257 |
| Lancashire Teaching Hospitals NHS Foundation Trust | Teaching | 501 | 591 | 596 | 826 |
| Leeds Teaching Hospitals NHS Trust | Teaching | 4,690 | 58 | 6,322 | 5,040 |
| Lewisham and Greenwich NHS Trust | Large | 1,572 | 1,572 | 829 | 785 |
| Liverpool Heart and Chest Hospital NHS Foundation Trust | Specialist | ||||
| Liverpool University Hospitals NHS Foundation Trust | Teaching | ||||
| Liverpool Women’s NHS Foundation Trust | Specialist | ||||
| London North West University Healthcare NHS Trust | Teaching | 730 | 1,040 | 734 | 1,863 |
| Maidstone and Tunbridge Wells NHS Trust | Large | 314 | 297 | 293 | 311 |
| Manchester University NHS Foundation Trust | Teaching | ||||
| Medway NHS Foundation Trust | Medium | ||||
| Mid and South Essex NHS Foundation Trust | Large | ||||
| Mid Cheshire Hospitals NHS Foundation Trust | Small | ||||
| Mid Yorkshire Hospitals NHS Trust | Large | 134 | 137 | 95 | 136 |
| Milton Keynes University Hospital NHS Foundation Trust | Teaching | ||||
| Moorfields Eye Hospital NHS Foundation Trust | Specialist | 0 | 0 | 0 | 0 |
| Norfolk and Norwich University Hospitals NHS Foundation Trust | Teaching | 542 | 604 | 524 | 523 |
| North Bristol NHS Trust | Large | 112 | 85 | ||
| North Cumbria Integrated Care NHS Foundation Trust | Small | 1,077 | 1,057 | 1,030 | 1,163 |
| North Middlesex University Hospital NHS Trust | Teaching | ||||
| North Tees and Hartlepool NHS Foundation Trust | Medium | 306 | 285 | 284 | 290 |
| North West Anglia NHS Foundation Trust | Large | 168 | 172 | 151 | 207 |
| Northampton General Hospital NHS Trust | Medium | 662 | |||
| Northern Care Alliance NHS Foundation Trust | Teaching | 801 | 859 | 804 | 894 |
| Northern Lincolnshire and Goole NHS Foundation Trust | Medium | 25 | 31 | 52 | 184 |
| Northumbria Healthcare NHS Foundation Trust | Large | 195 | 218 | 185 | 225 |
| Nottingham University Hospitals NHS Trust | Teaching | 2,030 | 1,527 | 1,732 | 1,696 |
| Oxford University Hospitals NHS Foundation Trust | Teaching | 1,690 | 1,824 | 1,781 | 2,002 |
| Portsmouth Hospitals University National Health Service Trust | Large | 221 | 268 | 246 | 264 |
| Queen Victoria Hospital NHS Foundation Trust | Specialist | 0 | 0 | 0 | 6 |
| Royal Berkshire NHS Foundation Trust | Large | 1,895 | 1,994 | 1,497 | 2,514 |
| Royal Cornwall Hospitals NHS Trust | Large | 122 | 174 | 202 | 224 |
| Royal Devon University Healthcare NHS Foundation Trust | Large | 366 | 258 | 192 | 330 |
| Royal Free London NHS Foundation Trust | Teaching | 8,451 | |||
| Royal National Orthopaedic Hospital NHS Trust | Specialist | 136 | 255 | 189 | 201 |
| Royal Papworth Hospital NHS Foundation Trust | Specialist | 48 | 75 | 99 | 44 |
| Royal Surrey County Hospital NHS Foundation Trust | Medium | 1,177 | 1,162 | 1,209 | 1,249 |
| Royal United Hospitals Bath NHS Foundation Trust | Medium | 110 | 160 | 303 | 548 |
| Salisbury NHS Foundation Trust | Small | 111 | 113 | 144 | 188 |
| Sandwell and West Birmingham Hospitals NHS Trust | Large | 0 | 0 | ||
| Sheffield Children’s NHS Foundation Trust | Specialist | 79 | 54 | 111 | 86 |
| Sheffield Teaching Hospitals NHS Foundation Trust | Teaching | 1,212 | 1,135 | 1,127 | 1,138 |
| Sherwood Forest Hospitals NHS Foundation Trust | Medium | ||||
| Somerset NHS Foundation Trust | Multi-service | 826 | 853 | 854 | 1,450 |
| South Tees Hospitals NHS Foundation Trust | Teaching | 265 | 260 | 288 | 466 |
| South Tyneside and Sunderland NHS Foundation Trust | Large | ||||
| South Warwickshire University NHS Foundation Trust | Medium | 309 | 405 | 533 | 638 |
| Southport and Ormskirk Hospital NHS Trust | Small | ||||
| St George’s University Hospitals NHS Foundation Trust | Teaching | 1,521 | 1,476 | 988 | 1,176 |
| St Helens and Knowsley Teaching Hospitals NHS Trust | Teaching | 1,580 | 1,491 | 1,274 | 1,634 |
| Stockport NHS Foundation Trust | Medium | 465 | 420 | 388 | 427 |
| Surrey and Sussex Healthcare NHS Trust | Medium | 167 | 177 | 252 | 265 |
| Tameside and Glossop Integrated Care NHS Foundation Trust | Small | 153 | 182 | 192 | |
| The Christie NHS Foundation Trust | Specialist | 393 | |||
| The Clatterbridge Cancer Centre NHS Foundation Trust | Specialist | ||||
| The Dudley Group NHS Foundation Trust | Medium | 86 | 24 | 40 | 39 |
| The Hillingdon Hospitals NHS Foundation Trust | Small | ||||
| The Newcastle Upon Tyne Hospitals NHS Foundation Trust | Teaching | 666 | 539 | 670 | 1,001 |
| The Princess Alexandra Hospital NHS Trust | Small | 265 | 250 | 232 | 254 |
| The Queen Elizabeth Hospital, King’s Lynn, NHS Foundation Trust | Small | 220 | 211 | 219 | 203 |
| The Robert Jones and Agnes Hunt Orthopaedic Hospital NHS Foundation Trust | Specialist | 44 | 27 | 104 | |
| The Rotherham NHS Foundation Trust | Small | 1 | 1 | 16 | 26 |
| The Royal Marsden NHS Foundation Trust | Specialist | 913 | 691 | ||
| The Royal Orthopaedic Hospital NHS Foundation Trust | Specialist | 300 | 348 | 385 | 412 |
| The Royal Wolverhampton NHS Trust | Large | 1,847 | 2,401 | 2,219 | 2,525 |
| The Shrewsbury and Telford Hospital NHS Trust | Medium | 107 | 116 | 114 | 104 |
| The Walton Centre NHS Foundation Trust | Specialist | ||||
| Torbay and South Devon NHS Foundation Trust | Multi-service | 13 | 8 | 1 | 8 |
| United Lincolnshire Hospitals NHS Trust | Large | 950 | 597 | 743 | 627 |
| University College London Hospitals NHS Foundation Trust | Teaching | 967 | 902 | 957 | 950 |
| University Hospital Southampton NHS Foundation Trust | Teaching | 553 | 574 | 647 | 1,290 |
| University Hospitals Birmingham NHS Foundation Trust | Teaching | ||||
| University Hospitals Bristol and Weston NHS Foundation Trust | Teaching | 0 | |||
| University Hospitals Coventry and Warwickshire NHS Trust | Teaching | 1,058 | 1,200 | 1,146 | |
| University Hospitals Dorset NHS Foundation Trust | Teaching | 229 | 170 | 224 | |
| University Hospitals of Derby and Burton NHS Foundation Trust | Teaching | 256 | 227 | ||
| University Hospitals of Leicester NHS Trust | Teaching | 7,352 | 8,011 | 8,018 | 7,911 |
| University Hospitals of Morecambe Bay NHS Foundation Trust | Teaching | 195 | 127 | 204 | 232 |
| University Hospitals of North Midlands NHS Trust | Teaching | 8,893 | 8,988 | ||
| University Hospitals Plymouth NHS Trust | Teaching | 473 | 808 | 919 | |
| University Hospitals Sussex NHS Foundation Trust | Teaching | 542 | 487 | 526 | 483 |
| Walsall Healthcare NHS Trust | Small | 836 | 873 | 991 | 1,513 |
| Warrington and Halton Teaching Hospitals NHS Foundation Trust | Teaching | 334 | 290 | 272 | 388 |
| West Hertfordshire Teaching Hospitals NHS Trust | Medium | 825 | 0 | 836 | 0 |
| West Suffolk NHS Foundation Trust | Small | ||||
| Whittington Health NHS Trust | Multi-service | 64 | 79 | 543 | |
| Wirral University Teaching Hospital NHS Foundation Trust | Teaching | 1,457 | 1,486 | ||
| Worcestershire Acute Hospitals NHS Trust | Large | 2,175 | 2,074 | 2,074 | |
| Wrightington, Wigan and Leigh NHS Foundation Trust | Medium | 242 | 227 | 195 | 211 |
| Wye Valley NHS Trust | Multi-service | 312 | 326 | 310 | 47 |
| Yeovil District Hospital NHS Foundation Trust | Small | 483 | 937 | 1,083 | 1,173 |
| York and Scarborough Teaching Hospitals NHS Foundation Trust | Teaching | 56 | 45 | 58 | 91 |
View this table in the data tables file
Acknowledgements
These reports would not be possible without the weekly contributions from microbiology colleagues in laboratories across England. The support from colleagues within UKHSA, and the AMRHAI Reference Unit in particular, is valued in the preparation of the report. Feedback and specific queries about this report are welcome via hcai.amrdepartment@ukhsa.gov.uk