Yorkshire and Humberside (low risk area) year end report 2021
Updated 16 February 2023

© Crown copyright 2023
This publication is licensed under the terms of the Open Government Licence v3.0 except where otherwise stated. To view this licence, visit nationalarchives.gov.uk/doc/open-government-licence/version/3 or write to the Information Policy Team, The National Archives, Kew, London TW9 4DU, or email: psi@nationalarchives.gov.uk.
Where we have identified any third party copyright information you will need to obtain permission from the copyright holders concerned.
This publication is available at https://www.gov.uk/government/publications/bovine-tb-epidemiology-reports-2021/yorkshire-and-humberside-low-risk-area-year-end-report-2021
Introduction
The Low Risk Area (LRA) was established in 2013. In 2014 this area was incorporated into the UK government’s strategy to achieve Officially Tuberculosis-Free (OTF) status for England by 2038. A key action was to recognise the different levels of bovine tuberculosis (TB) in different parts of the country and to vary the approach to control accordingly. Overall, the LRA has a very low and stable incidence of infected herds. The current strategy seeks to rapidly control infection when it arises through:
- high sensitivity testing of affected herds
- temporarily enhanced local surveillance (radial and hotspot testing)
- mandatory pre- and post-movement testing of cattle entering the LRA from higher risk areas of the UK
The aim is to preserve the favourable disease status of this area so that its counties can be declared OTF as soon as possible.
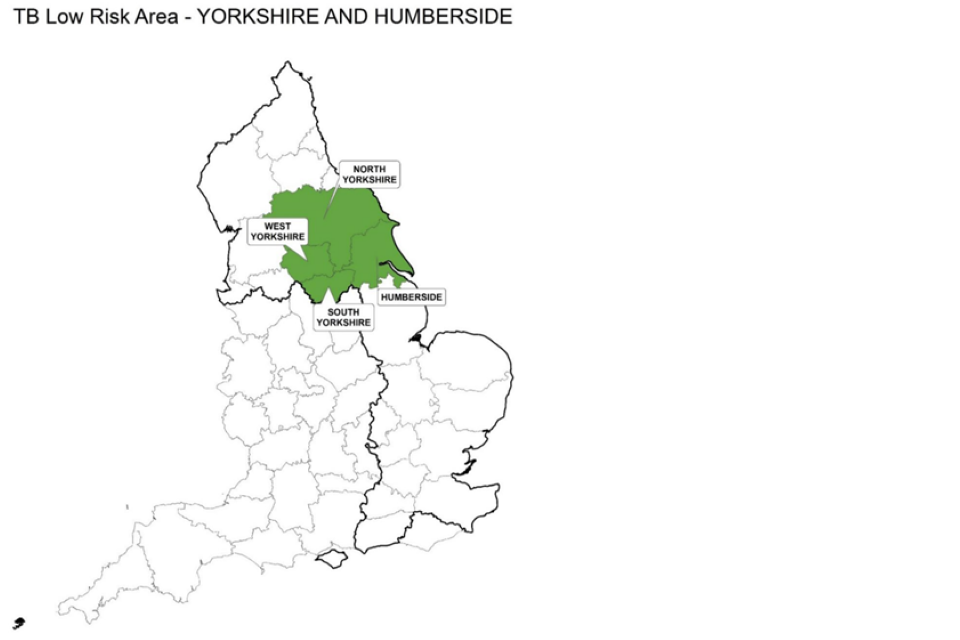
This report describes the frequency and geographical distribution of TB in 2021 in cattle herds in Yorkshire and Humberside (including the counties of North Yorkshire, West Yorkshire, South Yorkshire, and Humberside), which is part of the LRA.
TB in cattle and other mammals is primarily caused by the bacterium Mycobacterium bovis (M. bovis) and the disease is subsequently referred to in this report as TB. Although other sources may refer to TB ‘cases’, this report will use the term ‘incidents’ throughout.
This report is intended for individuals involved in the control of TB, both locally and nationally. This includes, but is not limited to farmers, veterinarians, policy makers and the scientific community.
Details of the data handling methodology used in this report, a glossary of terms, and the TB control measures adopted in the LRA, can be found in the Explanatory supplement for the annual reports 2021.
Types of TB incident
Unless otherwise specified, this report includes all new TB incidents detected during the reporting period. This includes ‘Officially Tuberculosis-Free Status Withdrawn’ (OTF-W) incidents and ‘Officially Tuberculosis-Free Status Suspended’ (OTF-S) incidents.
OTF-W incidents are those involving one or more test reactors with typical lesions of TB identified at post-mortem meat inspection, or one or more animals with M. bovis-positive culture results from tissue samples collected from carcases during the post-mortem inspection, or both.
OTF-S incidents are triggered by reactors to the Single Intradermal Comparative Cervical Tuberculin (SICCT) test, but without subsequent detection of TB lesions or positive culture results in any of those animals.
Cattle industry
In 2021 over 70% of the cattle in the region were located in North Yorkshire, see Appendix 1. Small holdings of less than 50 animals were the most common herd structure across all counties in the region as seen in Appendix 1. Nearly two-thirds of the cattle kept across the region were beef animals, however there was a slightly larger proportion of dairy animals in North Yorkshire.
There were 13 livestock markets operating across the region in 2021. Of these, 10 were in North Yorkshire, 2 in West Yorkshire, and one in Humberside. There were no slaughterhouses (SLHs) in Yorkshire and Humberside contracted to process TB reactor animals. There were 25 Licensed Finishing Units (LFUs) located across Yorkshire and Humberside: 19 in North Yorkshire (one new for 2021), 5 in South Yorkshire and one in Humberside.
New TB incidents
A total of 29 new TB incidents were disclosed across the Yorkshire and Humberside region during 2021 (7 OTF-W and 22 OTF-S) (Figures 1a and 1b). This was a decrease from the 36 incidents disclosed during 2020 (14 OTF-W and 22 OTF-S).
In North Yorkshire, there were 4 OTF-W and 16 OTF-S incidents during 2021, compared to 9 OTF-W and 9 OTF-S incidents in 2020. Although there were fewer OTF-W incidents, the total number of incidents continues the increasing trend seen in North Yorkshire since 2016.
The number of both OTF-W and OTF-S incidents decreased since 2020 in South and West Yorkshire. In South Yorkshire the number of new TB incidents decreased from one OTF-W and 2 OTF-S to no TB incidents in 2021 and in West Yorkshire from 3 OTF-W and 8 OTF-S to 2 OTF-W and 5 OTF-S. The number of incidents decreased in Humberside, from one OTF-W and 3 OTF-S to one of each in 2021.
There were no incidents of TB reported in non-bovine species in Yorkshire and Humberside during 2021.
Figure 1a: Annual number of new TB incidents in Humberside and North Yorkshire, from 2016 to 2021.

Figure 1b: Annual number of new TB incidents in South Yorkshire and West Yorkshire, from 2016 to 2021.

Geographical distribution of TB incidents
As in previous years, new TB incidents were spread across Yorkshire and Humberside and were disclosed in areas with a higher cattle density (Figure 2).
During 2021, there were 4 M. bovis whole genome sequencing (WGS) clades detected across Yorkshire and Humberside without evidence of spatial clustering (Figure 2).
Figure 2: Location of cattle holdings in Yorkshire and Humberside with new TB incidents (OTF-W and OTF-S) in 2021, and cattle holdings with pre-2021 OTF-W incidents still ongoing at the beginning of 2021, overlaid on a cattle density map. Note that ‘OTF-W Introduced 2021’ refers to OTF-W incidents in which cattle movements were the most likely source of infection.
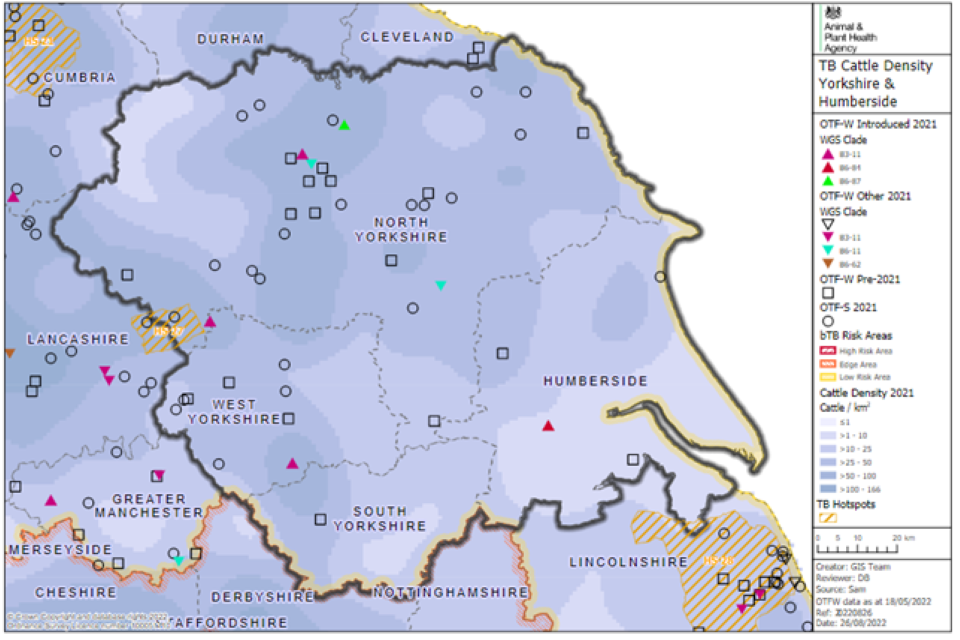
Three incidents with clade B3-11 were detected: on 2 far apart holdings in West Yorkshire, and on one farm in North Yorkshire. One of the 2 incidents in West Yorkshire was situated to the east of potential HS27. Movement of cattle from the LRA was considered a likely risk pathway, but other risk pathways associated with wildlife and fomites could not be ruled out. The other incident in West Yorkshire was most likely to be attributable to cattle movements from the LRA and the incident in North Yorkshire was most likely to be attributable to cattle movements from the High Risk Area (HRA) (Figure 3).
Two B6-11 incidents were detected in North Yorkshire. Both holdings were LFUs and a veterinary investigation into the likely source of infection was not completed.
One B6-84 incident in Humberside, which was most likely introduced by cattle imported from Northern Ireland or another country.
One B6-87 incident in North Yorkshire, was detected in a water buffalo. This was a multispecies premises containing cattle, bison, deer, pigs, and llamas. The water buffalo that yielded a positive M. bovis culture from which clade B6-87 was isolated originated from a farm in Devon (HRA), in the homerange for B6-87. It is considered that the most likely source of infection was the movement of this infected animal onto the premises in North Yorkshire (Figure 3).
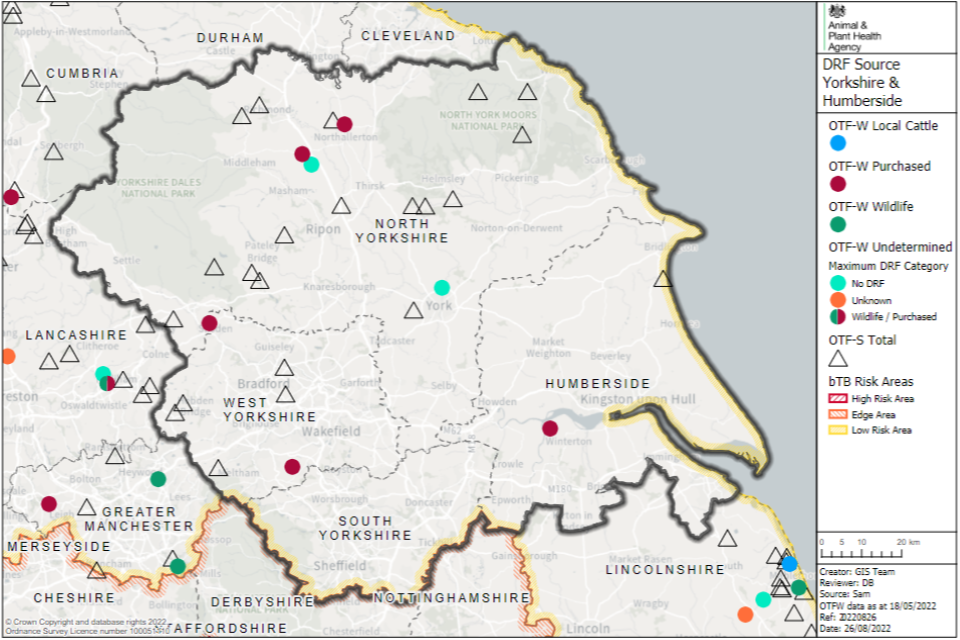
Figure 3: Map of the source of infection pathway recorded with the highest level of certainty, for OTF-W incidents, and the location of OTF-S incidents in Yorkshire and Humberside which started in 2021. Local cattle refer to residual infection and contiguous cattle risk pathways. Purchased refers to cattle movement risk pathways. Wildlife refers to both badger and other wildlife risk pathways.
Potential or confirmed TB hotspot areas
Potential Hotspot Area HS27
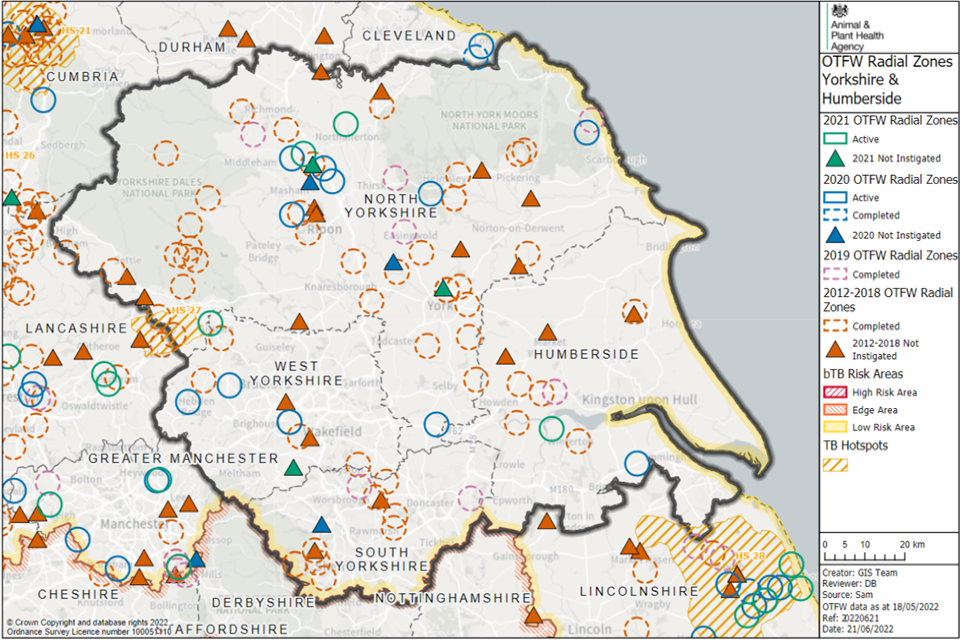
Potential HS27 was instated in January 2020 in the south-western corner of North Yorkshire, straddling the county boundary with Lancashire (Figure 4).
During the reporting period, there was one new OTF-S incident in a herd located in the North Yorkshire part of the potential hotspot. Furthermore, there was one new OTF-S incident disclosed in the Lancashire part of potential HS27. Since its implementation, only one wild deer carcase has been submitted to APHA for examination, with negative culture results for M. bovis.
Potential Hotspot Area HS28
The development of potential HS28 in Lincolnshire during 2020 could pose a risk to the region. A very small area of this potential hotspot spans the county boundary into Humberside. Despite this risk, no new TB cases were disclosed in the south-eastern corner of Humberside in 2021. There has also yet to be confirmation of TB in wildlife reservoirs. This however remains an area of concern to the region.
Figure 4: Potential hotspot areas and radial surveillance zones around OTF-W incidents that were active, completed or not instigated in Yorkshire and Humberside during 2021, by year of initiation.
Main risk pathways and key drivers for TB infection
The main risk pathways and key drivers for TB infection within Yorkshire and Humberside in 2021 are considered here. Evidence collected during APHA veterinary investigations into the source of infection within herds was used to inform this understanding. In 2021, 23 out of 29 (79%) of new TB incidents in Yorkshire and Humberside received a preliminary or final APHA veterinary investigation to identify the source of infection.
It can be challenging to retrospectively establish the route of infection for a TB incident herd. Ideally this investigation includes a thorough on-farm investigation and scrutiny of routinely collected data; such as cattle movement records, and the results of WGS where available. Up to 3 hazards and risk pathways were selected for each incident investigated. Each of these potential sources were given a score that reflects the likelihood of that pathway being the true one, based on the available evidence.
Details of the protocol used for these investigations, and the subsequent methodology used to calculate the weighted contribution of the different suspected sources of M. bovis infection can be found in the Explanatory supplement to the annual reports 2021.
The key drivers of the TB epidemic in Yorkshire and Humberside during 2021 were identified as follows:
- purchase of undetected infected cattle
- local spread into the region from adjoining LRA and Edge Area counties
The main TB risk factor for cattle herds in this region remains the purchase of undetected infected animals from higher risk areas of the country. In part, this is evidenced by the diverse range of WGS clades identified across the region.
There is some risk of local spread into the region from adjoining LRA and Edge Area counties. Particular sources of risk include potential hotspots HS27 and HS28 (north-east Lincolnshire), and north Derbyshire. Apart from one new OTF-W TB incident near potential HS27 (described above) there were no new TB incidents in these areas in 2021. These areas will continue to be monitored.
As in previous years, there was a high degree of uncertainty around the source of TB infections in 2021, with 28% of the herd incidents attributed to ‘other or unknown source’. This category is added to those incidents in which there was high uncertainty around the selected pathways (see explanatory supplement for methodology). Most incidents in the Yorkshire and Humberside area are OTF-S and these always carry a higher level of uncertainty around the sources of infection as, by definition, the genotype of M. bovis could not be determined. Due to the small number of OTF-W incidents, it is difficult to draw any concrete conclusions for the aggregated data from veterinary investigations at the area level as seen in Appendix 3.
Forward look
Continued publicity and education to the farming industry to ensure that everyone is equally aware of, and aims to minimise, the risk from purchasing cattle is central to reducing the incidence of TB into the area. The promotion and use of interactive mapping tools may help to mitigate some of the risk from cattle movements. This, coupled with further education on good herd biosecurity practice, will help to maintain and reduce the low incidence of TB we currently enjoy across the region.
The ongoing implementation of routine and targeted surveillance methods is critical in enabling Yorkshire and Humberside to maintain its low incidence of TB. Radial testing, post-movement and traced bovine tests remain key to promptly disclose incidents and limit the potential for further spread. If the combination of these different testing regimes alongside routine surveillance continues, there is a good prospect that the region of Yorkshire and Humberside will maintain a low TB risk status.
Appendix 1: Cattle industry demographics
Table 1: Number of cattle premises by size band in Yorkshire and Humberside at 1 January 2021, by county (RADAR data).
| Size of herds | Number of herds in Humberside | Number of herds in North Yorkshire | Number of herds in South Yorkshire | Number of herds in West Yorkshire |
|---|---|---|---|---|
| Undetermined | 8 | 45 | 9 | 18 |
| 1-50 | 318 | 1,285 | 207 | 609 |
| 51-100 | 114 | 563 | 68 | 139 |
| 101-200 | 113 | 554 | 54 | 102 |
| 201-350 | 47 | 328 | 31 | 45 |
| 351-500 | 12 | 107 | 11 | 20 |
| 501+ | 9 | 112 | 6 | 10 |
| Total number of herds | 621 | 2,994 | 386 | 943 |
| Mean herd size | 86 | 123 | 84 | 67 |
| Median herd size | 47 | 62 | 39 | 25 |
Table 2: Number and percentage of total animals by breed purpose in Yorkshire and Humberside at 1 January 2021, by county.
| Breed purpose | Number (and percentage of total) cattle in Humberside | Number (and percentage of total) cattle in North Yorkshire | Number (and percentage of total) cattle in South Yorkshire | Number (and percentage of total) cattle in West Yorkshire |
|---|---|---|---|---|
| Beef | 44,078 (82%) | 233,776 (63%) | 23,543 (73%) | 43,315 (68%) |
| Dairy | 8,156 (15%) | 123,335 (33%) | 7,532 (23%) | 17,223 (27%) |
| Dual purpose | 1,411 (2%) | 10,212 (2%) | 1,165 (3%) | 2,463 (3%) |
| Unknown | 3 | 5 | 0 | 1 |
| Total | 53,648 | 367,328 | 32,240 | 63,002 |
Appendix 2: Summary of headline cattle TB statistics
Table 3: Herd-level summary statistics for TB in cattle in 2021 in Humberside, North Yorkshire, South Yorkshire, and West Yorkshire.
| Herd-level statistics | Humberside | North Yorkshire | South Yorkshire | West Yorkshire |
|---|---|---|---|---|
| (a) Total number of cattle herds live on Sam at the end of the reporting period | 788 | 3,517 | 455 | 1,149 |
| (b) Total number of cattle herds subject to annual TB testing (or more frequent) at the end of the reporting period (any reason) | 39 | 287 | 17 | 196 |
| (c) Total number of whole herd skin tests carried out at any time in the period | 158 | 854 | 105 | 335 |
| (d) Total number of OTF cattle herds having TB whole herd tests during the period for any reason | 143 | 730 | 98 | 311 |
| (e) Total number of OTF cattle herds at the end of the report period (herds not under any type of Notice Prohibiting the Movement of Bovine Animals (TB02 restrictions) | 775 | 3,449 | 437 | 1,122 |
| (f) Total number of cattle herds that were not under restrictions due to an ongoing TB incident at the end of the report period | 787 | 3,505 | 455 | 1,147 |
| (g.1) Total number of new OTF-S TB incidents detected in cattle herds during the report period | 1 | 16 | 0 | 5 |
| (g.2) Total number of new OTF-W TB incidents detected in cattle herds during the report period | 1 | 4 | 0 | 2 |
| (h.1) Of the new OTF-W herd incidents, how many occurred in a holding affected by another OTF-W incident in the previous three years? | 0 | 0 | 0 | 0 |
| (h.2) Of the new OTF-W herd incidents, how many could be considered secondary to a primary incident based on current evidence? | 0 | 0 | 0 | 0 |
| (h.3) Of the new OTF-W herd incidents, how many were triggered by skin test reactors or 2x inconclusive reactors (IRs) at routine herd tests? | 0 | 2 | 0 | 0 |
| (h.4) Of the new OTF-W herd incidents, how many were triggered by skin test reactors or 2xIRs at other TB test types (such as forward and back-tracings, contiguous, check tests)? | 1 | 1 | 0 | 0 |
| (h.5) Of the new OTF-W herd incidents, how many were first detected through routine slaughterhouse TB surveillance? | 0 | 3 | 0 | 2 |
| (i.1) Number of new OTF-S incidents revealed by enhanced TB surveillance (radial testing) conducted around those OTF-W herds | 0 | 4 | 0 | 3 |
| (i.2) Number of new OTF-W incidents revealed by enhanced TB surveillance (radial testing) conducted around those OTF-W herds | 0 | 0 | 0 | 0 |
| (j) Number of OTF-W herds still open at the end of the period (including any ongoing OTF-W incidents that began in a previous reporting period) | 1 | 7 | 0 | 2 |
| (k) Number of OTF-W herds still open at the end of the period that are within a finishing unit | 1 | 5 | 0 | 0 |
| (l) New confirmed (positive M. bovis culture) incidents in non-bovine species detected during the report period (indicate host species involved) | 0 | 0 | 0 | 0 |
Table 4: Animal-level summary statistics for TB in cattle in 2021.
| Animal-level statistics (cattle) | Humberside | North Yorkshire | South Yorkshire | West Yorkshire |
|---|---|---|---|---|
| (a) Total number of cattle tested in the period (animal tests) | 16,255 | 108,807 | 8,840 | 18,189 |
| (b.1) Reactors detected by tuberculin skin tests during the year | 2 | 24 | 0 | 9 |
| (b.2) Reactors detected by additional IFN-γ blood tests (skin-test negative or IR animals) during the year | 4 | 27 | 11 | 0 |
| (c) Reactors detected during year per incidents disclosed during year | 3.00 | 2.55 | 0.00 | 1.29 |
| (d) Reactors per 1,000 animal tests | 0.37 | 0.47 | 1.24 | 0.49 |
| (e.1) Additional animals slaughtered during the year for TB control reasons (dangerous contacts, including any first time IRs) | 0 | 0 | 0 | 0 |
| (e.2) Additional animals slaughtered during the year for TB control reasons (private slaughters) | 0 | 0 | 0 | 0 |
| (f) SLH cases (tuberculous carcases) reported by the Food Standards Agency (FSA) during routine meat inspection | 1 | 10 | 0 | 2 |
| (g) SLH cases confirmed by culture of M. bovis | 0 | 4 | 0 | 2 |
Note (c) Reactors detected during year per incidents disclosed during year, reactors may be from incidents disclosed in earlier years, as any found through testing during the report year count here.
Note (g) SLH cases confirmed by culture of M. bovis, not all cases reported are submitted for culture analysis. All cases reported are from any period prior to or during restrictions.
Appendix 3: Suspected sources of M. bovis infection for all of the new OTF-W and OTF-S incidents identified in the report period
Each TB incident could have up to 3 potential risk pathways identified. Each risk pathway is given a score that reflects the likelihood of that pathway bringing TB into the herd. The score is recorded as either definite (score 8), most likely (score 6), likely (score 4) or possible (score 1). The source(s) for each incident are weighted by the certainty ascribed. Any combination of definite, most likely, likely, or possible can contribute towards the overall picture for possible routes of introduction into a herd. If the overall score for a herd is less than 6, then the score is made up to 6 using the ‘Other or unknown source’ option. Buffering up to 6 in this way helps to reflect the uncertainty in assessments where only ‘likely’ or ‘possible’ sources are identified.
Table 5 combines the data from multiple herds and provides the proportion of pathways in which each source was identified, weighted by the certainty that each source caused the introduction of TB. The output does not show the proportion of herds where each pathway was identified (this is skewed by the certainty calculation). WGS of M. bovis isolates can be a powerful tool in identifying a likely source of infection, however WGS clades are not determined for OTF-S herds. As a result of varying levels of uncertainty, only broad generalisations should be made from these data. A more detailed description of this methodology is provided in the Explanatory supplement for the annual reports 2021.
Table 5: Suspected sources of M. bovis infection for all new OTF-W and OTF-S incidents identified in Yorkshire and Humberside in 2021.
| Source of infection | Possible (1) | Likely (4) | Most likely (6) | Definite (8) | Weighted contribution |
|---|---|---|---|---|---|
| Badgers | 6 | 1 | 0 | 0 | 10.5% |
| Cattle movements | 6 | 1 | 4 | 3 | 28.2% |
| Contiguous | 0 | 1 | 1 | 0 | 5.5% |
| Residual cattle infection | 0 | 0 | 1 | 0 | 3.3% |
| Domestic animals | 0 | 0 | 0 | 0 | 0.0% |
| Non-specific reactor | 1 | 2 | 1 | 0 | 10.0% |
| Fomites | 3 | 0 | 0 | 0 | 2.2% |
| Other wildlife | 6 | 4 | 0 | 0 | 15.0% |
| Other or unknown source | 3 | 0 | 0 | 0 | 26.1% |
Please note each TB incident could have up to 3 potential pathways so totals may not equate to the number of actual incidents that have occurred.