2018 international traders and investors study: technical report (online version)
Published 3 May 2019

© Crown copyright 2019
This publication is licensed under the terms of the Open Government Licence v3.0 except where otherwise stated. To view this licence, visit nationalarchives.gov.uk/doc/open-government-licence/version/3 or write to the Information Policy Team, The National Archives, Kew, London TW9 4DU, or email: psi@nationalarchives.gov.uk.
Where we have identified any third party copyright information you will need to obtain permission from the copyright holders concerned.
This publication is available at https://www.gov.uk/government/publications/2018-international-traders-and-investors-study/2018-international-traders-and-investors-study-technical-report
2018 International Traders and Investors Study: Technical report
1. Methodology note
This report sets out the technical design and implementation of the International Traders and Investors Study 2018.
1.1 Objectives
One of the Department for International Trade’s (DIT) core responsibilities is to develop new trade and investment policies promoting UK businesses globally, and provide support for UK businesses who export whilst also facilitating inward and outward investment.
There are two international GREAT Campaigns specifically designed to help showcase some of these opportunities available to international buyers and investors, and which aim to make businesses more aware of these opportunities in the UK; the International Trade Campaign and the Invest in GREAT Britain Campaign.
The key research objectives of this study were to:
- understand international perceptions of the UK as a place to trade with and/or invest in
- evaluate the UK’s strengths and capabilities and provide benchmarking figures for selected competitors
- assess likelihood of international businesses to trade with or invest in the UK against other key competitors
- measure levels of awareness, exposure and subsequent impact of the international B2B GREAT campaigns, and assess the effectiveness of the different channels and messages
To meet these objectives, Ipsos MORI was commissioned to conduct 2,000 interviews with businesses that have the potential to trade with and/or invest in the UK. Fieldwork took place in 8 markets: France, Germany, United States of America (USA), Japan, China, Hong Kong (HK), India and United Arab Emirates (UAE). The survey was conducted using CATI (Computer Assisted Telephone Interviewing) between 2 May and 9 August 2018.
Whilst there have been previous international business perception studies which have covered similar issues – most recently in 2016 on behalf of UKTI (Perceptions of the UK for Trade and Investment), it is not possible to compare findings due to substantive differences in sample design. This survey has been designed to provide representative findings across the GREAT international campaign’s priority audience (i.e. businesses that were likely to trade and/or invest internationally across the eight priority markets, rather than the business population as a whole in each market)[footnote 1]. In practice, this meant using an identical sample frame and design across each market to enable comparisons to be made. This methodology can be replicated to provide comparisons with future waves of the survey. In contrast, previous studies have included businesses from multiple sources to varying degrees across markets (e.g. contacts provided by UKTI, re-contacts from previous survey waves, and Dun and Bradstreet) which meant that the exact approach could not be replicated.
1.2 Sampling
Sample population
The research focused on the campaign target audiences, i.e. businesses that met the following criteria:
- Profit making organisations with an annual turnover of at least $2 million. Organisations defined as ‘Public Corporation’, ‘Central Government’, ‘Local Authority’ and ‘Non-profit body or Associations’ were excluded.
- Had at least 10 employees employed across the whole organisation including in other countries.
- Said that they had previously, or were likely to, trade and/or invest internationally in the future.
Businesses were selected for inclusion in the sample if they met criteria one and two (this information was included in the sample frame). Interviewers also verified this information at the start of the interview. Businesses were screened in the interview on the third criteria.
Sample frame
The sample was drawn from Dun and Bradstreet - a commercial database of businesses. This frame was chosen because it is the most comprehensive one that was available across all target markets.
Sample design
This study was designed to be representative of businesses which met the three eligibility criteria above (i.e. profit making, with at least 10 employees and an annual turnover of $2 million and have the potential to trade with/invest in the UK).
This was a quota survey; quotas were set on turnover and industry sector to reflect the population of businesses in each market, based on Dun and Bradstreet. However, because the incidence of businesses that had previously or were likely to trade and/or invest internationally was unknown prior to interview (and varied considerably by sector, size and market), it was not possible to set precise quotas for the number of interviews that would be achieved by turnover and sector. Instead the quotas acted to ensure that the sectoral profile of the businesses that were contacted was representative of the sectoral make-up of the Dun and Bradstreet sample frame for the key markets. Businesses were then asked several screening questions to identify whether they met criterion three and were therefore eligible to take part in the survey. This process is outlined in more detail in the following sections.
Sample selection
In total, 87,930 businesses were selected from Dun and Bradstreet. Table one presents the total number of leads by market. The lower numbers in Hong Kong and UAE reflected the smaller Dun and Bradstreet populations in these countries.
The sample for each market was allocated into random batches and released gradually during fieldwork; subsequent batches were released when the live sample was exhausted. Moreover, each sample record had to be contacted at least five times (higher in USA, Hong Kong and UAE), at different times/day of the week.
Table 1: Number of Dun & Bradstreet records by market
| Territory | Total |
|---|---|
| France | 12,507 |
| Germany | 12,500 |
| India | 12,500 |
| UAE | 3,097 |
| USA | 17,141 |
| HK | 5,056 |
| China | 12,609 |
| Japan | 12,520 |
| Total | 87,930 |
In each market, the sample was stratified by turnover and industry sector prior to selection. A representative sample of businesses were selected in each market, based on population data provided by Dun and Bradstreet of all businesses on their database that were profit making with at least 10 employees and at least $2 million annual turnover (including businesses without a telephone number on the database). This is presented in Tables two and three below. The eligibility rate for each sector (within each country) was closely monitored throughout fieldwork, and the target number of interviews adjusted to reflect the eligibility rate in the field.
This approach was chosen due to the absence of robust, market-level population data that showed the proportion of businesses in each market who traded and/or invested outside their home market. This iterative approach meant that the target number of interviews in each sector in each market was adjusted throughout fieldwork to account for variations in eligibility rates in different sectors within the same market. For example, if construction businesses made up 10% of the sample, we would ensure that 10% of all screening is conducted with construction businesses. If the screening revealed that 5% of construction businesses were eligible (i.e. traded and/or invested outside their home market), the quota for construction would be adjusted to reflect this (i.e. 5% of construction businesses would be eligible for interview). This process was repeated for the different sectors and the target for each sector was scaled to ensure that the total number of interviews met the overall target of 250 interviews per market.
Table 2: Dun & Bradstreet population profile for each market (by sector)[footnote 2]
Download the supporting tables for technical report ODS file (ODS, 12KB) to see table 2.
Table 3: Dun & Bradstreet population profile for each market (by turnover)[footnote 3]
Download the supporting tables for technical report ODS file (ODS, 12KB) to see table 3.
1.3 Questionnaire design
The questionnaire was developed in collaboration with DIT and was largely based on previous versions of this survey. A copy of the questionnaire is available in the appendix.
The questionnaire was translated into local languages as well as also being available in English in all countries. Interviewers were briefed by the Ipsos MORI research team in their local languages. They also received written briefing notes, a copy of the survey questionnaire and a letter to send to respondents requesting more information about the survey. Ipsos MORI also set up a survey webpage that interviewers could direct businesses to should they wish to check that the survey was genuine.
The average interview length (excluding the screening questions) was 22 minutes, minimum length was 10 and maximum length was 48 minutes. Table four below outlines the questionnaire length by market.
Table 4 : Questionnaire length (excluding screening)
| Country | Average length (minutes) |
|---|---|
| Overall | 22 |
| France | 21 |
| Germany | 23 |
| India | 19 |
| USA | 20 |
| UAE | 23 |
| China | 23 |
| Japan | 27 |
| Hong Kong | 21 |
Questionnaire overview
The survey started with a series of screening questions to identify eligible businesses to complete the survey.
The following types of businesses were screened out:
- charitable organisations
- businesses with less than 10 employees
- businesses with an annual turnover of less than $2mil. (or equivalent in local currency)
- businesses who have not or do not plan to trade or invest internationally
Businesses that passed the screener were asked questions on these themes:
A. Awareness of promotional activity (unprompted) B. Trade and Investment activities in the UK and competitor countries C. Key attributes associated with the UK and competitor countries D. Campaign awareness (prompted) E. Awareness of DIT and key information sources F. Contact and links with the UK and impact of EU Exit on perceptions of the UK
Respondents were classified as a “prospective trader” or “prospective investor” based on their survey response. They were then asked questions about their trade or investment intentions and their perception of the UK in relation to trade or investment. The aim was to achieve an equal number of interviews about trading and investing. Businesses that were both a prospective trader and investor were allocated to the group with the least number of responses within that market.
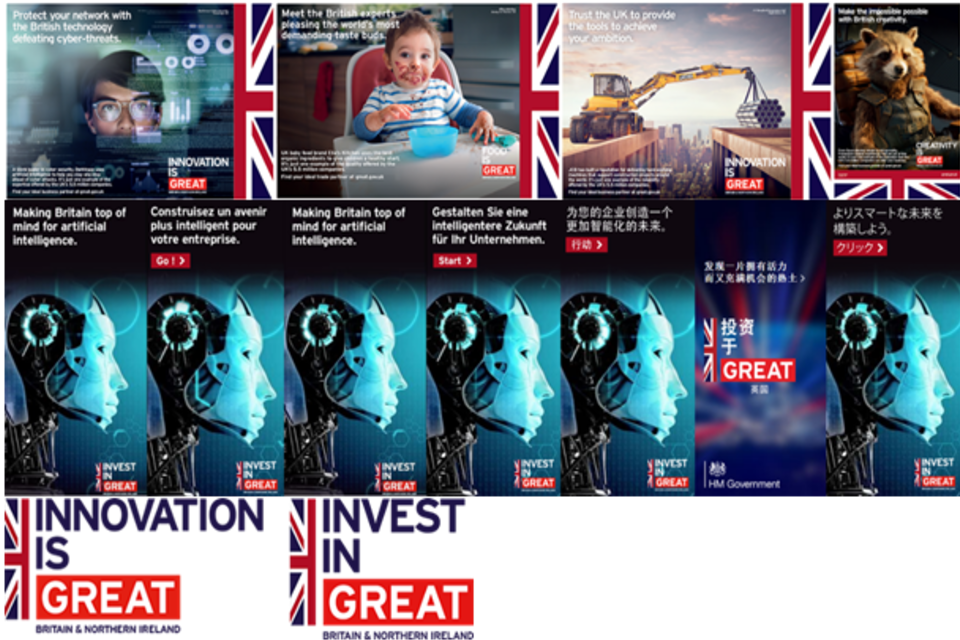
Campaign materials
All respondents were asked to go online[footnote 4] to view a selection of campaign materials to aid recall, as part of the interview (Figure 1 below). Prospective investors and traders were shown images from the Invest in GREAT Britain or International Trade Campaigns, respectively, in local languages.
Figure 1 : Images shown to survey respondents who could access web page
1.4 Fieldwork
Interviews were conducted with the senior person who confirmed their involvement in making decisions about investments, or buying products or services, on behalf of their organisation at the beginning of the interview.
Computer-assisted telephone interviewing (CATI) was used in all countries. The survey scripting was carried out by Ipsos’ central programming team (using IBM’s Dimensions software). Local interviewing teams were supplied with secure access to the script for their market.
Interviewers were briefed by local supervisors prior to commencing fieldwork. All interviewing was conducted during standard working hours unless otherwise requested. Where respondents were unable to participate at the point of first contact, follow-up appointments were booked as necessary.
Fieldwork outcomes
A total of 2,005 interviews (c.250 in each market) were completed. The overall survey co-operation rate was 41%. The final fieldwork outcomes are summarised in Table five below. As can be seen, the eligibility rate varied considerably by country. For example, it was relatively high in India, UAE, China and Hong Kong compared to the remaining markets. One possible reason for this is the high proportion of businesses in sectors that were more likely to trade and/or invest overseas: China and India had a high percentage of businesses in manufacturing, whilst Hong Kong and UAE had a high proportion of businesses in the wholesale and retail sector. However, this is not the only explanation because the majority of Japan’s businesses were also in these sectors, but it had the lowest incidence of prospective traders and investors.
Table 5: Sample outcomes[footnote 5] [footnote 6] [footnote 7]
| Outcome | Overall | France | Germany | India | USA | UAE | China | Japan | Hong Kong |
|---|---|---|---|---|---|---|---|---|---|
| Completed interviews | 2,005 | 250 | 253 | 250 | 251 | 250 | 251 | 250 | 250 |
| Sample called | 62,085 | 9,886 | 8,763 | 3,334 | 14,705 | 4,227 | 8,406 | 7,290 | 5,474 |
| Soft appointments | 4,490 | 1,555 | 4 | 316 | 1,221 | 171 | 12 | 789 | 422 |
| Hard appointments | 156 | 56 | 66 | 0 | 34 | 0 | 0 | 0 | 0 |
| Maximum number of call attempts reached | 7,331 | 945 | 11 | 626 | 1,117 | 1,324 | 1,480 | 111 | 1,717 |
| Screen outs (ineligible) | 7,244 | 1,796 | 671 | 81 | 847 | 89 | 113 | 3,560 | 87 |
| Refusals | 12,562 | 2,417 | 1,417 | 685 | 3,021 | 355 | 1,837 | 1,937 | 893 |
| Unusable (including no reply) | 28,297 | 2,867 | 6,341 | 1,376 | 8,214 | 2,038 | 4,713 | 643 | 2,105 |
| Eligibility rate | 22% | 12% | 27% | 76% | 23% | 74% | 69% | 7% | 74% |
| Co-operation rate | 42% | 46% | 40% | 32% | 27% | 49% | 17% | 65% | 27% |
1.5 Weighted and unweighted sample profiles
Weights were applied to survey data to ensure that they matched the profile of the population of interest. The screened sample was weighted to reflect the population of eligible businesses from the Dun and Bradstreet business database. All screened-out businesses were then removed and the weights rescaled for completed interviews only.
Due to small base sizes, sector classifications were merged into these categories:
- manufacturing
- construction
- wholesale, retail, motor repair
- professional services: information and communication; finance, insurance and real estate; professional, scientific and technical; admin & support; education, health and social work)
- other: agriculture, forestry, fishing; mining and quarrying; electricity, gas, steam and aircon; water, sewerage and waste; transport and storage; accommodation and food service; arts, recreation and other services)
Table 6 presents the weighted and unweighted interviews by market.
Table 6 : Weighted (w) and unweighted (u) sample profiles
Download the supporting tables for technical report ODS file (ODS, 12KB) to see table 6.
1.6 Effective base sizes and margins of error
Applying weighting to data, whilst making the figures more representative, can also reduce the statistical reliability of the results by reducing the effective base sizes for the purpose of statistical testing[footnote 8]. The impact of weighting for each market is shown in Table 7 along with associated confidence intervals at 95% confidence level (that is, the range of values that one can be 95% certain contains the true average had the whole population been surveyed). As outlined below, the effective base sizes are in line with actual base sizes, thus the impact of weighting on results is minimal.
Table 7 : Effective base sizes
| Total (unweighted) | Effective base size (post-weighting) | Maximum confidence interval (+%) | |
|---|---|---|---|
| Total | 2,005 | 1,976 | +2.2 |
| China | 251 | 245 | +6.3 |
| Japan | 250 | 245 | +6.3 |
| HK | 250 | 247 | +6.2 |
| India | 250 | 243 | +6.3 |
| USA | 251 | 250 | +6.2 |
| France | 250 | 248 | +6.2 |
| Germany | 253 | 251 | +6.2 |
| UAE | 250 | 248 | +6.2 |
1.7 Data processing
One open ended question was coded. No other data entry was required because the survey was conducted using CATI; all routings were built into the script. Coding was carried out by a dedicated specialised team. A coding frame was created by the team in the first instance and approved by the research team.
1.8 Sub-group definitions
This section provides an overview of the subgroups used for analysis in this study. Respondents were classified into each group based on the responses they gave in the survey. Some of the information was taken from the sample profile but respondents were asked to confirm the sample information was correct during the interview. This was the case for the size, sector and market groups.
1.8.1 Size
Sub-group analysis was based on business turnover and size. Table eight shows how the overall sample breaks down by company turnover and number of employees. This breakdown was reflective of the target sample for this study; businesses who trade/invest internationally or are considering doing so, and those with a minimum annual turnover of $2 million and at least 10 employees.
Table 8.1 : Breakdown of respondents by turnover
| Turnover in US dollars | Number of respondents |
|---|---|
| 2 million to 9.9 million | 1,005 |
| 10 million to 49.9 million | 612 |
| 50 million to 99.9 million | 174 |
| 100 million to 499.9 million | 166 |
| 500 million to 999.9 million | 27 |
| 1 billion and above | 21 |
Table 8.2: Breakdown of respondents by size
| Number of employees | Number of respondents |
|---|---|
| 10 to 49 | 633 |
| 50 to 249 | 826 |
| 250 to 499 | 239 |
| 500 to 999 | 121 |
| 1,000 to 1,999 | 75 |
| 2,000 to 4,999 | 60 |
| 5,000 and above | 51 |
1.8.2 Sector
Table nine shows the sector breakdown of businesses within the study. A representative sample of businesses in each market was initially obtained from the sample supplier, Dun and Bradstreet. As interviews progressed and quotas were adapted according to the findings from the screening and eligibility checks, the profile by sector was adapted to be reflective of the target population.
In total, 522 of the respondents overall fell into the DIT priority sectors (that is, those sectors which are explicitly targeted as part of the international GREAT international business campaigns). This is shown in Table 10 below.
Table 9: Breakdown of respondents by sector
| Sector | Number of respondents |
|---|---|
| Agriculture, forestry, fishing | 28 |
| Mining, quarrying | 22 |
| Manufacturing | 786 |
| Electricity, gas, steam and aircon | 22 |
| Water, sewerage, waste | 6 |
| Construction | 100 |
| Wholesale, retail, motor repair | 550 |
| Transport, storage | 90 |
| Accommodation, food service | 33 |
| Information and communication | 70 |
| Finance and insurance | 28 |
| Real estate | 32 |
| Professional, scientific, technical | 108 |
| Admin and support | 30 |
| Education | 4 |
| Health and social work | 21 |
| Arts, entertainment, recreation | 9 |
| Other services | 66 |
Table 10: Breakdown of respondents by DIT target sector
| DIT priority sector | Number of respondents |
|---|---|
| Automotive | 13 |
| Creative | 70 |
| Education | 58 |
| Food and drink | 71 |
| Healthcare | 13 |
| Infrastructure | 102 |
| Life sciences (main) | 25 |
| Life sciences (related) | 74 |
| Nuclear | 1 |
| Retail | 34 |
| Sports economy | 61 |
1.8.3 Market
When interpreting overall findings, it is important to note that they comprise responses from 8 different markets and that the responses have not been weighted by market (i.e. all markets have been treated equally in the weighting scheme regardless of their number of eligible businesses).
In most research studies, there will be an element of cultural bias which affects how people in different countries respond to survey questionnaires. This may affect responses to some extent, though in this study we believe that variations within the samples in each market and broader socio-political factors will have a greater effect on how respondents answer questions about doing business with other countries and the subsequent variations by market.
1.8.4 Trade and Invest
In order to be eligible to participate in the survey, businesses needed to either already be trading or investing internationally or be considering doing so in the future. For the purposes of the survey, every respondent was assigned to either a ‘trader’ or ‘investor’ sub-group depending on their current/potential international business activities. This was to keep the questionnaire length manageable; so in particular sections of the survey each respondent was only asked about either trade or invest factors and not both (which would have made the questionnaire too long).
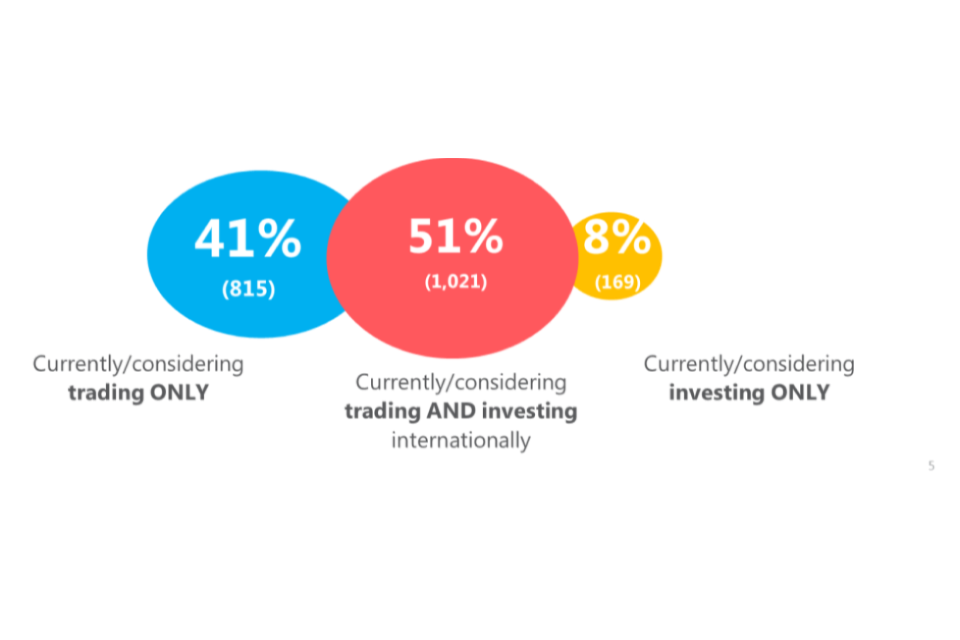
Whilst every respondent in the survey was assigned to either a ‘Trader’ or ‘Investor’ group, it is important to bear in mind that there was significant overlap between the two groups. As Figure 2 shows, half of respondents were both. There were significantly more businesses that only traded/would consider trading (41%) compared to those that only invested/would consider investing (8%).
This means that when interpreting the views of ‘Traders’ and ‘Investors’, it should be borne in mind that ‘Traders’ were mainly engaged in trading only whilst ‘Investors’ were more likely to be doing/thinking of doing both.
In the overall sample, 1,079 respondents were classified as ‘Traders’ and asked questions relating to trade, whilst 926 were classified as ‘Investors’.
Figure 2: Breakdown of respondents by international trading and investment activities
1.8.5 GREAT Recognition
As well as questions relating to UK business promotional activity more broadly, respondents were asked specifically about international B2B GREAT campaign material. Those who could access the internet at the point of interview were prompted with a selection of images taken from either the International Trade Campaign or the Invest in GREAT Britain and Northern Ireland campaign (shown to Traders/Investors accordingly) in local languages, as well as the over-arching campaign logo. Those without internet access were given a detailed description[footnote 9] of the promotional activity.
Whilst the images used and description given were tailored to the International Trade Campaign or the Invest in GREAT Britain and Northern Ireland campaign, it is possible that respondents may also be referring to other GREAT campaigns using similar imagery/messaging (such as those run by Visit Britain and the British Council).
In the analysis, ‘GREAT recogniser’ included respondents who recalled or recognised any of the GREAT campaign materials.
1.8.6 Links with UK
Those who previously lived in, studied in or visited the UK, as well as those who reported having family, friends or business contacts based in the UK were included in this subgroup. This aimed to provide insight into the behaviours of those who were more likely to be familiar with the UK via other means versus those who were not.
1.9 Quality
This work was carried out in line with Market Research Society standards and the requirements of the international quality standard for Market Research, ISO 20252:2012, as well as the Ipsos MORI Terms and Conditions which can be found at http://www.ipsos-mori.com/terms.
1.10 Reporting methodology
Unless specified otherwise, all commentary in the report focused on differences between sub- groups that are statistically significant at a 95 per cent confidence level. This means that if the survey were to be conducted 100 times, a finding of the same nature (e.g. sub-group A is more likely to respond in a certain way than sub-group B) would be found on at least 95 occasions. Strictly speaking, statistical testing can only be applied in pure terms to random probability approaches, which is not the case here. We have applied statistical testing for this study for illustrative purposes.
Where percentages do not sum to 100, this may be due to computer rounding, the exclusion of ‘don’t know/not applicable’ categories, or multiple answers.
2 Background quality report
2.1 Data quality of data sources
Fieldwork was managed by the Ipsos Central Coordination team (CCT). This team liaised with local interviewing teams on all aspects of fieldwork including monitoring and quality assurance.
Local fieldwork teams were required to submit:
- weekly sample outcome reports: these were reviewed by the CCT and followed up with local fieldwork teams as required (for example, if there was a high percentage of numbers that had not been contacted)
- twice weekly reports on performance against quotas. These reports were also shared with DIT
Local fieldwork agencies also undertook quality checks such as listening in to interviews and/or live monitoring of individual interviewer performance.
2.2 Quality control
This section provides an overview of the steps the central team and the local partners undertook during and after fieldwork to maximise data quality.
The quality control steps undertaken during fieldwork period included:
- interim data checks on the first few interviews in each market to ensure that all routing was working correctly and respondents provided genuine answers (i.e. no respondents who selected ‘don’t know’ on majority of answers to speed through the questionnaire or did not provide required answer at all)
- back-checking of at least 10% of completed interviews
- checks on the distribution of values within variables
- coding checks on the open-ended question
The steps undertaken after fieldwork ended to maximise data quality included final:
- frequency checks on all questions – to re-check routing
- checks to ensure only permitted values have been inputted
- checks on response distribution
- checks on ‘straight-lining’ at grid questions
- checks to ensure the dataset contains no duplicate or near-duplicate records (these checks showed that there were no interviews with either duplicate IDs or duplicate values across all variables)
- checks to identify any remaining impossible/implausible values
- assessment of item non-response and outliers
- assessment of back-checking
- consistency checks on trend variables
3 Appendix
3.1.1 Questionnaire
Download the questionnaire ODT file.
3.1.2 Data tables
Download the supporting tables for technical report ODS file (ODS, 12KB).
Enquiries
Any enquiries about this publication should be sent to enquiries@trade.gov.uk.
-
8 priority markets were included: France, Germany, USA, Japan, China, Hong Kong (HK), India and United Arab Emirates (UAE). ↩
-
Dun and Bradstreet use the US 1987 SIC Major Industry Sector classification for countries outside of the UK. Dun and Bradstreet databases contain data collected worldwide and thus use a universal US 1987 SIC as opposed to UK specific classification only. ↩
-
Quotas were set on turnover under or over $50 million as per DIT target groups. ↩
-
Respondents who were unable to access the internet to view the images were provided with the following description of the promotional activity by the interviewer: Can you recall having seen, read or heard any advertising, events or promotion which includes phrases using the word GREAT to promote ‘Great Britain’ as a place to do business with? This might have included the phrases ‘Innovation is GREAT’, ‘Creativity is GREAT’ or ‘Invest in GREAT’. These advertisements, events or promotional items include the words Britain and Northern Ireland and part of the red, white and blue union flag. They may also have included images relating to UK business. ↩
-
Outstanding soft appointments remained unfulfilled as quota cells had been filled. Soft appointments can usually described as permissions to call back at another time if respondent is busy/unavailable. ↩
-
Outstanding hard appointments remained unfulfilled as quota cells had been filled. Hard appointments are confirmed by respondents and booked for a prearranged time and date. ↩
-
Co-operation rate based on estimated eligibility (%) = completed interviews divided by (completed interviews + (refusal*eligibility rate)) multiplied by 100. ↩
-
Statistical testing can only be applied in pure terms to random probability approaches, which is not the case here. We have applied statistical testing for this study for illustrative purposes. ↩
-
Campaign description read to those who could not access web page at time of interview: Can you recall having seen, read or heard any advertising, events or promotion which includes phrases using the word GREAT to promote ‘Great Britain’ as a place to do business with? This might have included the phrases ‘Innovation is GREAT’, ‘Creativity is GREAT’ or ‘Invest in GREAT’. These advertisements, events or promotional items include the words Britain and Northern Ireland and part of the red, white and blue union flag. They may also have included images relating to UK business. ↩