Wider Determinants of Health: statistical commentary, November 2022 update
Published 1 November 2022
Applies to England

© Crown copyright 2022
This publication is licensed under the terms of the Open Government Licence v3.0 except where otherwise stated. To view this licence, visit nationalarchives.gov.uk/doc/open-government-licence/version/3 or write to the Information Policy Team, The National Archives, Kew, London TW9 4DU, or email: psi@nationalarchives.gov.uk.
Where we have identified any third party copyright information you will need to obtain permission from the copyright holders concerned.
This publication is available at https://www.gov.uk/government/statistics/wider-determinants-of-health-november-2022-update/wider-determinants-of-health-statistical-commentary-november-2022-update
1. New in this update
New data have been added to the Wider Determinants of Health profile tool on the Fingertips platform. The following indicators have been updated and are available at local authority level as well as for England, the regions, and various inequality groups:
- percentage of people aged 16 to 64 in employment
- percentage of people unemployed (model based)
- percentage of people economically inactive
- gap in the employment rate between those with a physical or mental long term health condition and the overall employment rate
- the percentage of the population with a physical or mental long term health condition in employment
- violent crime - violence offences per 1,000 population
- violent crime - sexual offences per 1,000 population
We have added back series data to the following indicator:
- percentage of the population who are in receipt of long term support for a learning disability that are in paid employment
2. Main findings
-
In England during 2021 to 2022, 75.4% of people were employed. This represents an increase from 75.1% in 2020 to 2021 but remains lower than in 2019 to 2020 (76.2%).
-
In England during 2021 the unemployment rate was 4.5%. This represents a minor reduction from 2020 where the rate was 4.7% but was an increase from 2019 (3.9%).
-
For 2021 to 2022 the economic inactivity rate was 21.2%. This is a continuation of the increasing trend seen since 2019 to 2020.
-
The percentage of the population with a physical or mental long term health condition in employment in 2021 to 2022 was 65.5%. This represents an increase in the employment rate from 2020 to 2021 (64.4%) while the gap between those with a physical or mental long term health condition and the overall employment rate continues to reduce.
-
In England during 2021 to 2022 there were 34.9 violent offences per 1,000 population. This continues the annual increase since 2013 to 2014.
3. Summary of updated indicators
3.1 Work and the labour market indicators
For the financial year 2021 to 2022, 75.4% of people were employed. This represents an increase from 75.1% in 2020 to 2021 but remains lower than in 2019 to 2020 (76.2%). Breaking the data down by ethnicity, the percentage of people in employment in the White ethnic group was 76.9%. This compares with 78.2% in the Indian, 69.4% in the Other, 66.8% in the Black or Black British, 66.6% in the Mixed, and 59.2% in the Pakistani/Bangladeshi groups. There was a 7 percentage point difference between males (79.1%) and females (71.8%). The male rate had increased slightly since 2020 to 2021 while the female rate remained the same.
The employment rate for the English regions ranged from 70.0% in the North East to 78.1% in the South East. The employment rate in the North East reduced slightly since 2020 to 2021 while employment increased in the South East over the same period. By local authority, in 2021 to 2022 the employment rate ranged from 55.8% in East Lindsey to 89.7% in Richmondshire.
Figure 1 shows: Percentage of people in employment (aged 16 to 64), Districts and Unitary Authorities, 2021 to 2022
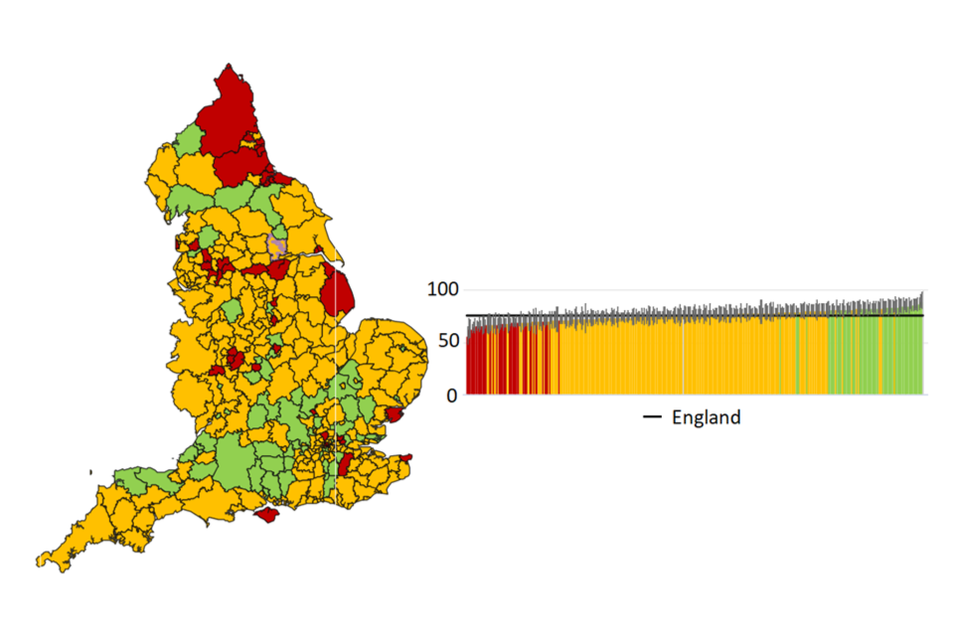
Source: Annual Population Survey - Labour Force Survey
For 2021 the unemployment rate was 4.5%. This represents a minor reduction from 2020 where the rate was 4.7% but was an increase from 2019 (3.9%). For 2021 to 2022 the economic inactivity rate was 21.2%. There was an increasing trend in economic inactivity from 2019 to 2020 (20.6%) to 2020 to 2021 (20.8%).
The unemployed and the economically inactive represent two distinct categories. Groups comprising the economically inactive include people who were: long-term sick or disabled, temporary sick (with no employment), looking after family/home, students, and retired people. The economic inactivity rate, together with the unemployment rate and employment rate provide information of the labour market status of all people in the population range. A person’s employment status is associated with a range of health outcomes and therefore these indicators form an important part of understanding the wider determinants of health.
The percentage of the population with a physical or mental long term health condition in employment in 2021 to 2022 was 65.5%. This represents an increase in the employment rate from 2020 to 2021 (64.4%). The gap in the employment rate between those with a physical or mental long term health condition and the overall employment rate continued to reduce in 2021 to 2022 to 9.9 percentage points.
Figure 2 shows: Gap in the employment rate between those with a physical or mental long term health condition (aged 16 to 64) and the overall employment rate, England, 2013 to 2014 to 2021 to 2022
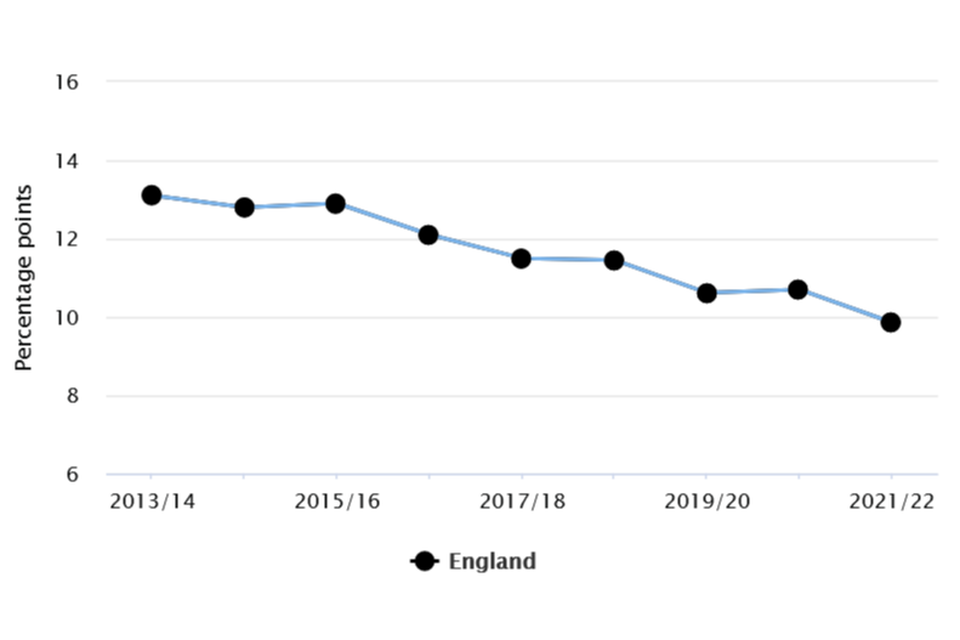
Source: OHID, using the Annual Population Survey (ONS)
3.2 Violent crime indicators
In England during the financial year 2021 to 2022 there were 34.9 violent offences per 1,000 population. This continues the annual increase observed since 2013 to 2014. During 2021 to 2022 there were 3.0 sexual offences per 1,000 population. This rate had also increased annually since 2013 to 2014 but had levelled off during 2020 to 2021. The most recent data point represents an increase.
During 2021 to 2022 the rate of violent crime ranged from 27.0 in the London region to 43.9 per 1,000 population in the North West. Over the same period, the rate of violent crime ranged from 20.2 in the least deprived decile to 53.2 per 1,000 population in the most deprived decile of district and unitary authorities.
Comparing the police recorded offences with self-reported data from the Crime Survey for England and Wales, suggests that the rise in recorded violence against the person is largely due to improvements in police forces’ compliance with the National Crime Recording Standard (NCRS) rather than a real rise in violent crime.
4. Background and further information
The Wider Determinants of Health tool brings together available indicators at England and local authority level on the wider determinants of health, with links to further resources. The Wider Determinants of Health tool is designed to:
- draw attention to the broad range of individual, social and environmental factors which influence our health
- provide the public health system with intelligence on the wider determinants of health to help improve population health and reduce health inequalities
The indicators that have been brought together for this tool are a combination of wider determinants, health behaviours and health outcomes.
View the Wider Determinants of Health Profile
Responsible statistician, product lead: Mark Cook