Heritage - Taking Part Survey 2019/20
Published 16 September 2020
Applies to England

© Crown copyright 2020
This publication is licensed under the terms of the Open Government Licence v3.0 except where otherwise stated. To view this licence, visit nationalarchives.gov.uk/doc/open-government-licence/version/3 or write to the Information Policy Team, The National Archives, Kew, London TW9 4DU, or email: psi@nationalarchives.gov.uk.
Where we have identified any third party copyright information you will need to obtain permission from the copyright holders concerned.
This publication is available at https://www.gov.uk/government/statistics/taking-part-201920-heritage/heritage-taking-part-survey-201920
The Taking Part survey is a continuous face to face household survey of adults aged 16 and over and children aged 5 to 15 years old in England. This chapter summarise results from adults (16+) and their participation in heritage from the 2019/20 survey, which ran from April 2019 to March 2020.
Differences between groups are only reported on in this publication where they are statistically significant i.e. where we can be confident that the differences seen in our sampled respondents reflect the population [footnote 1].
1. Definitions
The Taking Part survey asks adults (16+) whether they have visited any heritage sites from a given list. This includes visiting a city or town with historic character, a monument such as a castle, fort or ruin, and a historic park or garden open to the public. A full list is provided in Annex C
2. Visiting heritage sites
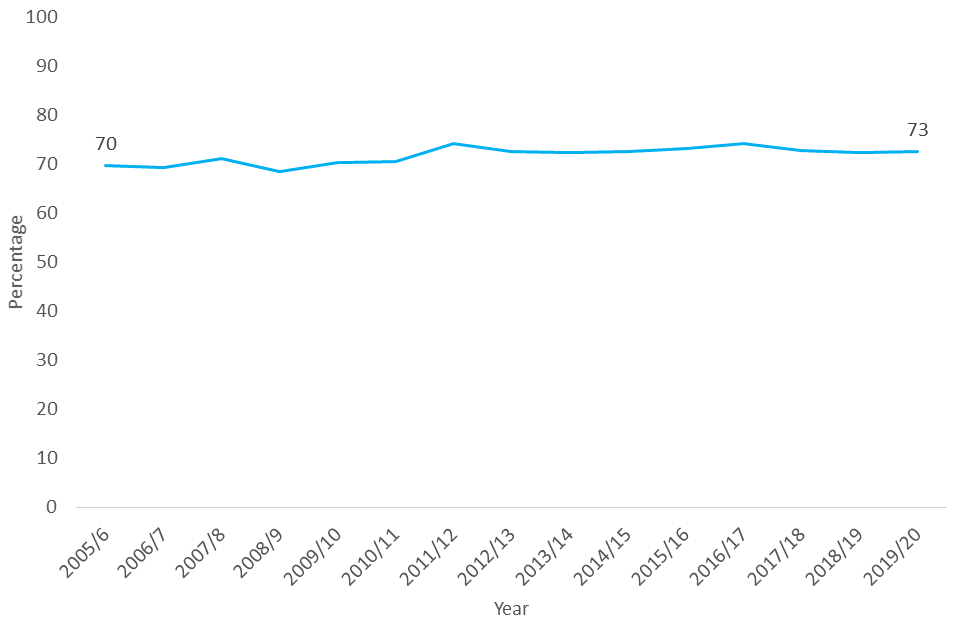
In 2019/20, 73% of people reported having visited a heritage site in the last 12 months, similar to 2018/19.
Figure 2.1: Proportion of respondents who had visited a heritage site in the last 12 months, 2005/06 to 2019/20
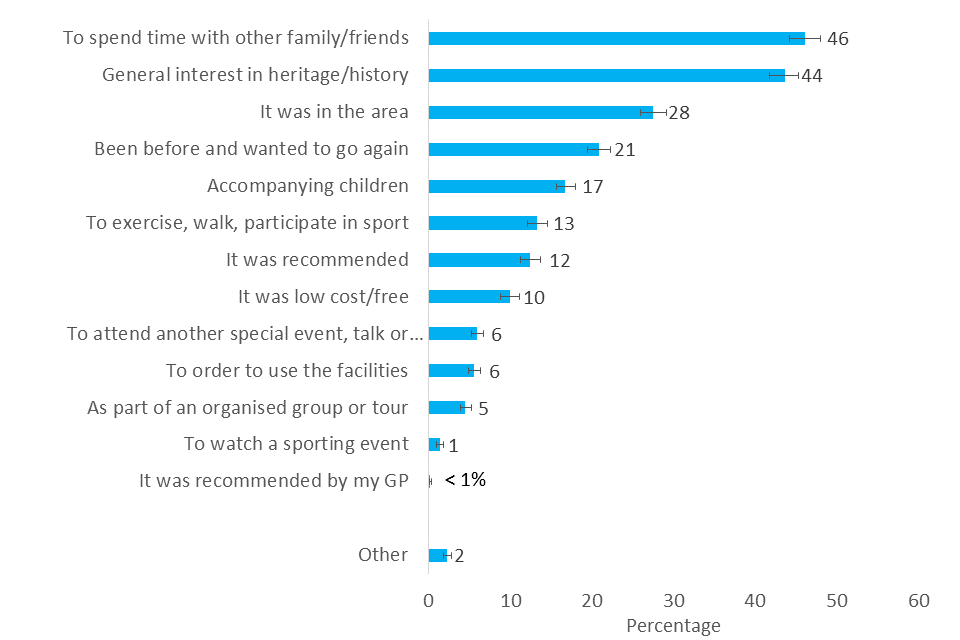
The most common reasons given for visiting a heritage site were to spend time with friends and family (46%), closely followed by having a general interest in heritage or history (44%); the same top two reasons as in 2018/19. Two options increased in popularity from 2018/19 to 2019/20; ‘Accompanying children’ (from 13 to 17%) and ‘been before and wanted to go again’ (from 17 to 21%).
Figure 2.2 – Reasons given for visiting a heritage site reported by respondents in the last 12 months, 2019/20
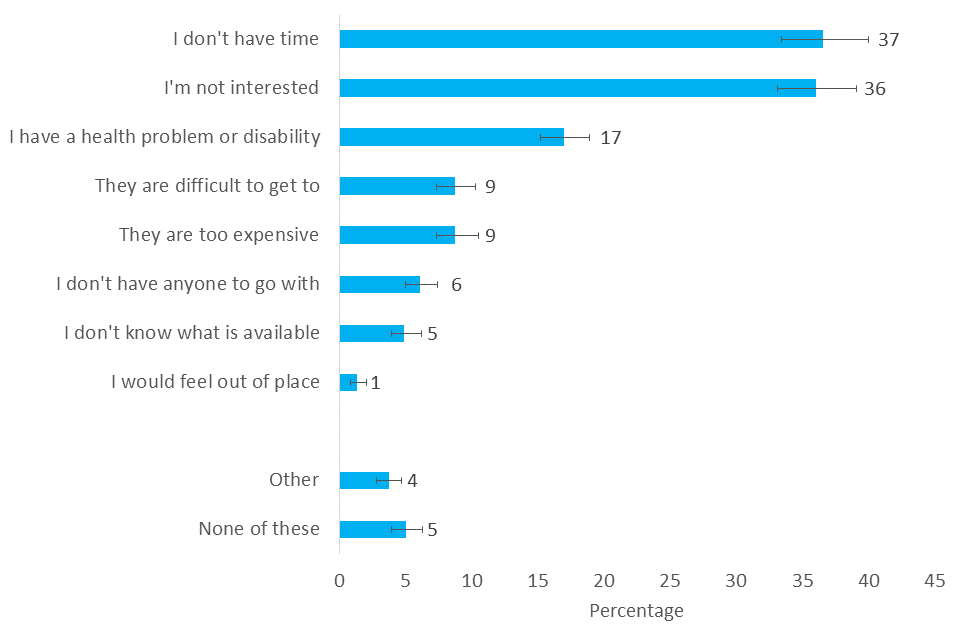
Those who had not visited any heritage events in the past 12 months were asked why they hadn’t. Beyond reporting not having time (37%) and not being interested (36%), 17% reported a health problem or disability as a barrier, 9% felt heritage events were difficult to get to, and 9% thought they were too expensive.
Figure 2.3 - Barriers reported by respondents to visiting heritage events in the past 12 months, 2019/20
3. Digital Participation in Heritage
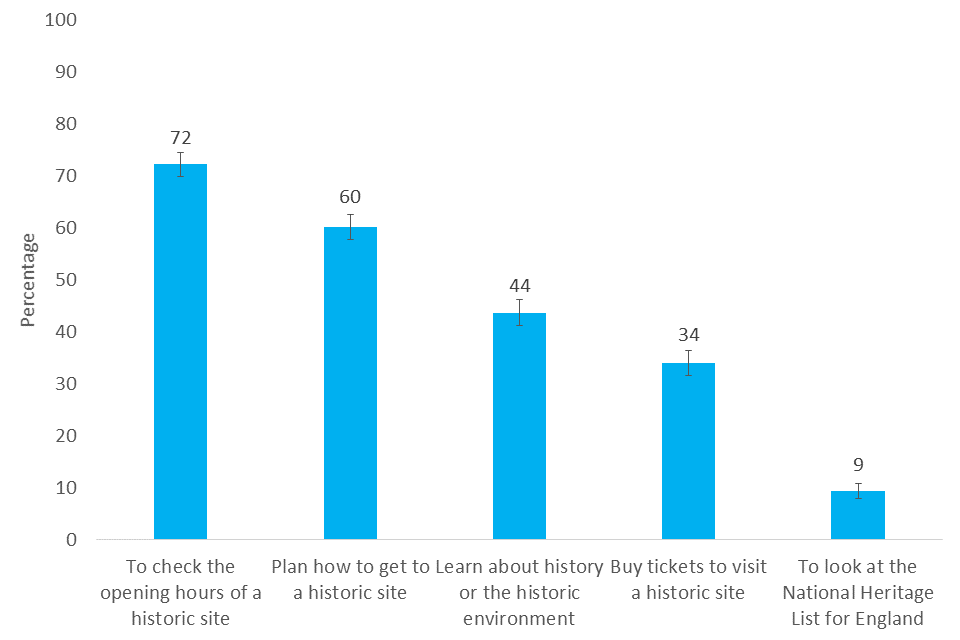
In 2019/20, 30% of respondents reported having visited or used a heritage website or app in the past 12 months, similar to 2018/19 (28%). Respondents were asked for their reasons for visiting a heritage website or using an app. The most common reasons given, similar to 2018/19, were to check the opening hours of a historic site (72%), plan how to get to a historic site (60%) and learn about history or the historic environment (44%).
Figure 2.4 - Top five most commonly reported reasons for visiting a heritage website or using an app in the past 12 months, 2019/20
4. Volunteering in Heritage
An estimated 5% of respondents reported having volunteered in a sector connected with heritage in the past 12 months. This estimate is similar to previous years.
For headline statistics on volunteering please see results from DCMS’ Community Life Survey.
5. Who visits heritage sites?
There are differences between demographic groups for visiting of heritage sites.
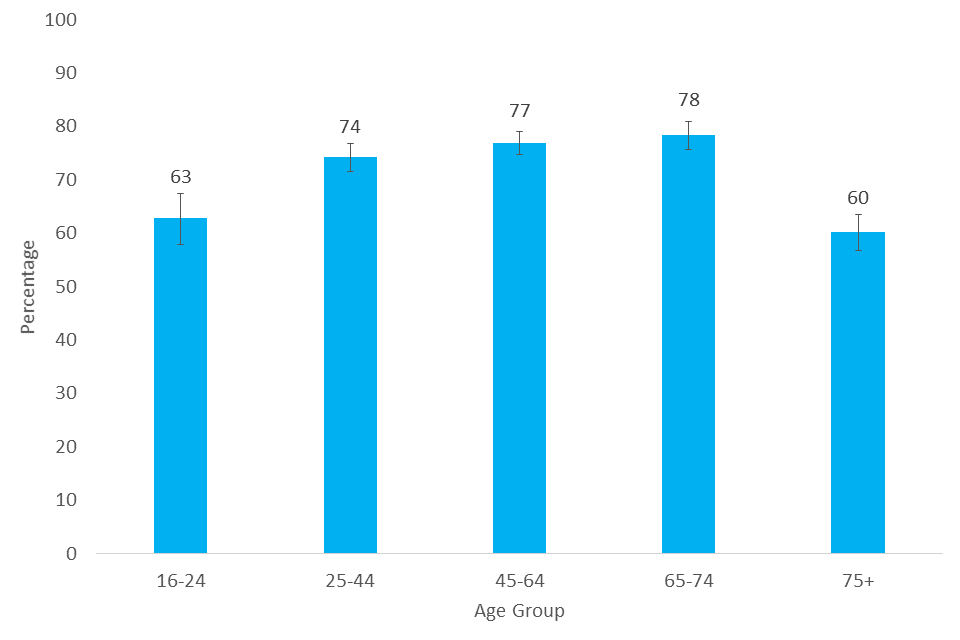
The age groups of 16-24 and 75+ had less respondents reporting that they had visited a heritage site in the last 12 months (60-63%) compared to other age groups (74-78%). A similar trend was seen in 2018/19, but in 2019/20, no difference in participation between the age groups 16-24 and 75+ was seen.
Figure 2.5 - Percentage of respondents who visited a heritage site in the last 12 months by age group, 2019/20
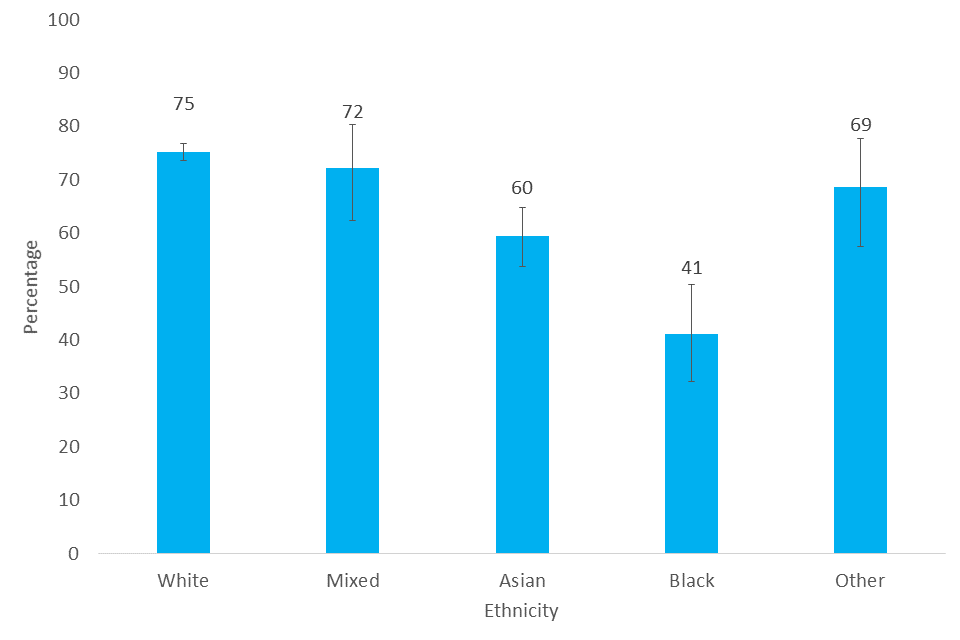
Visiting heritage sites was reported less often by Black respondents (41%) compared to other ethnicities (60-75%). Additionally, it was observed that Asian respondents (60%) were less likely to have visited than White respondents (75%). This is a similar trend to 2018/19.
Figure 2.6 - Percentage of respondents who visited a heritage site in the last 12 months by ethnicity, 2019/20
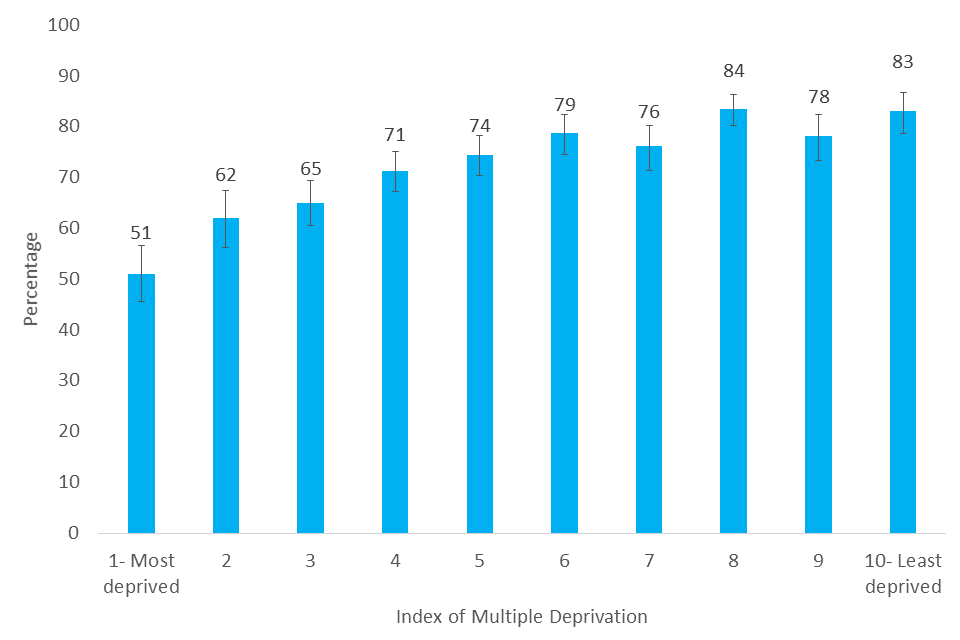
Those in the most deprived areas [footnote 2] (51%) were less likely to have visited heritage sites than those in the least deprived areas (83%), a trend also observed in 2018/19.
Figure 2.7 - Percentage of respondents who visited a heritage site in the last 12 months by Index of Multiple Deprivation, 2019/20
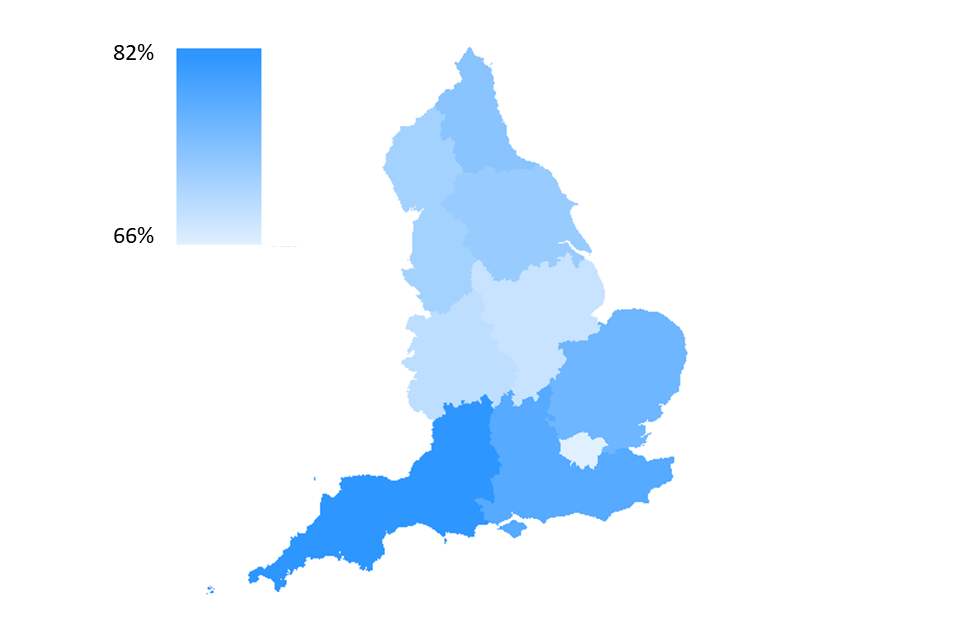
Respondents in London were less likely to visit heritage sites (66%) than those in the South East (78%) or South West (82%).
** Figure 2.8 - Percentage of respondents who visited a heritage site in the last 12 months by region, 2019/20**
Socio-economic background [footnote 3] was a predictor of participation, with 84% of those with ‘higher managerial, administrative and professional occupations’ participating, compared to 62% of those with ‘routine and manual occupations’.
The gap in heritage participation between those with a long-term illness or disability and those without has narrowed. In 2005/06, a significant difference was observed in participation, whereas in 2016/17, 2018/19, and 2019/20, no difference is seen. This narrowing is interesting given that having a long-term health problem or disability was found to be the third most common barrier to visiting a heritage site (see figure 2.3).
Further demographic data
- Those living in rural areas (83%) were more likely to have visited heritage sites than those in urban areas (70%).
- Those working visited heritage sites more (77%) than those not working (66%).
- Visiting heritage sites was more popular for homeowners (78%) than private tenants (72%), with both groups higher than social renters (50%).
- There was no significant variability between different genders.
-
The 95% confidence intervals are indicated by error bars on the charts. They show the range that we are 95% confident the true value for the population falls between. When there is no overlap between the error bars for two or more groups, we can be more confident that the differences between groups represent true differences between these groups in the population ↩
-
The Index of Multiple Deprivation, commonly known as the IMD, is the official measure of relative deprivation for small areas in England. It is calculated using several measures such as income deprivation, crime and living environment deprivation. The Index of Multiple Deprivation ranks every small area in England from 1 (most deprived area) to 32,844 (least deprived area), which we have sorted into deciles for this publication. ↩
-
Using National Statistics Socio-economic classification (NS-SEC), respondents were categorised as being in one of three groups – Higher managerial, adminisitative and professional occuptions; Intermediate occuptions; Routine occupations. The NS-SEC classifies people depending on their employment. For more information see Annex B. ↩