Local tobacco control profiles for England: short statistical commentary, July 2021
Published 6 July 2021
Applies to England

© Crown copyright 2021
This publication is licensed under the terms of the Open Government Licence v3.0 except where otherwise stated. To view this licence, visit nationalarchives.gov.uk/doc/open-government-licence/version/3 or write to the Information Policy Team, The National Archives, Kew, London TW9 4DU, or email: psi@nationalarchives.gov.uk.
Where we have identified any third party copyright information you will need to obtain permission from the copyright holders concerned.
This publication is available at https://www.gov.uk/government/statistics/local-tobacco-control-profiles-for-england-july-2021/local-tobacco-control-profiles-for-england-short-statistical-commentary-july-2021
New in this update
New smoking attributable mortality and hospital admissions data has been added to the local tobacco control profiles (LTCP) on the Fingertips platform. The following indicators have been updated and are available at local authority level as well as for England, the regions, and various inequality groups:
- smoking attributable mortality (new method)
- smoking attributable deaths from cancer (new method)
- smoking attributable deaths from heart disease (new method)
- smoking attributable deaths from stroke (new method)
- smoking attributable hospital admissions (new method)
Main findings
There were an estimated 191,900 deaths attributed to smoking in England in the years 2017 to 2019.
The rate of deaths attributable to smoking has decreased from 244.2 (per 100,000) in 2013 to 2015 to 202.2 (per 100,000) in the latest 3 year period (2017 to 2019).
There were an estimated 84,780 deaths from cancer, 27,950 deaths from heart disease, and 8,630 deaths from stroke attributed to smoking in England in the period 2017 to 2019.
There were an estimated 448,030 smoking attributable hospital admissions in England in 2019 to 2020.
The rate has decreased very slightly to 1,398 admissions per 100,000 in 2019 to 2020 from 1,426 admissions per 100,000 in 2018 to 2019.
All the smoking attributable mortality and admission rates were highest in the most deprived areas.
Key definitions used in this release
Smoking attributable mortality
Deaths from conditions which are partially caused by smoking. A fraction of the deaths from smoking related conditions are included based on the latest academic evidence about the contribution smoking makes to the condition
Smoking attributable hospital admissions
Admissions to hospital for conditions which are partially caused by smoking. A fraction of the admissions from smoking related causes are included based on the latest academic evidence about the contribution smoking makes to the condition
Background
Public Health England (PHE) has updated the methodology used to calculate smoking attributable mortality and hospital admissions indicators. This change in methodology has resulted in lower rates than previously published. This difference is illustrated and explained in the consultation report. The new methodology has been applied to the trend back to the period 2013 to 2015 for mortality and to the period 2015 to 2016 for admissions.
Smokers are much more likely than non-smokers to get a wide range of diseases including respiratory diseases, cardiovascular diseases and a wide range of cancers. For these conditions, it is possible to calculate the risk of them occurring in smokers compared with non-smokers. This is called a relative risk and is specific to each disease, age group and sex.
The previous relative risks were based on data from 1982 to 1988. Since then a variety of studies been undertaken that examine to what extent smoking is a risk factor for a number of conditions. In June 2018 the Royal College of Physicians published a report ‘Hiding in plain sight: Treating tobacco dependency in the NHS’ which included a review of relative risks based on the most up-to-date literature available. More information on this report and links to it and other relevant literature can be found in the consultation report.
The risk of a smoking related disease remains much higher in smokers than non-smokers and smoking is as lethal to individuals this year as it was last year. What has changed is the estimate of the total number of deaths and admissions in England caused by smoking. Not long ago, more deaths in England were caused by smoking alone than by alcohol, obesity, drug use and AIDS combined. As the number of smokers declines the total burden of death and disease in England will fall too.
Summary of updated indicators
Smoking attributable mortality (new method)
For the period 2017 to 2019 there were an estimated 191,900 deaths attributed to smoking in England. The rate of deaths attributable to smoking in England has decreased from 244.2 (per 100,000) in the 3 year period 2013 to 2015 to 202.2 (per 100,000) in the most recent period (2017 to 2019).
Figure 1: Smoking attributable mortality (new method), England
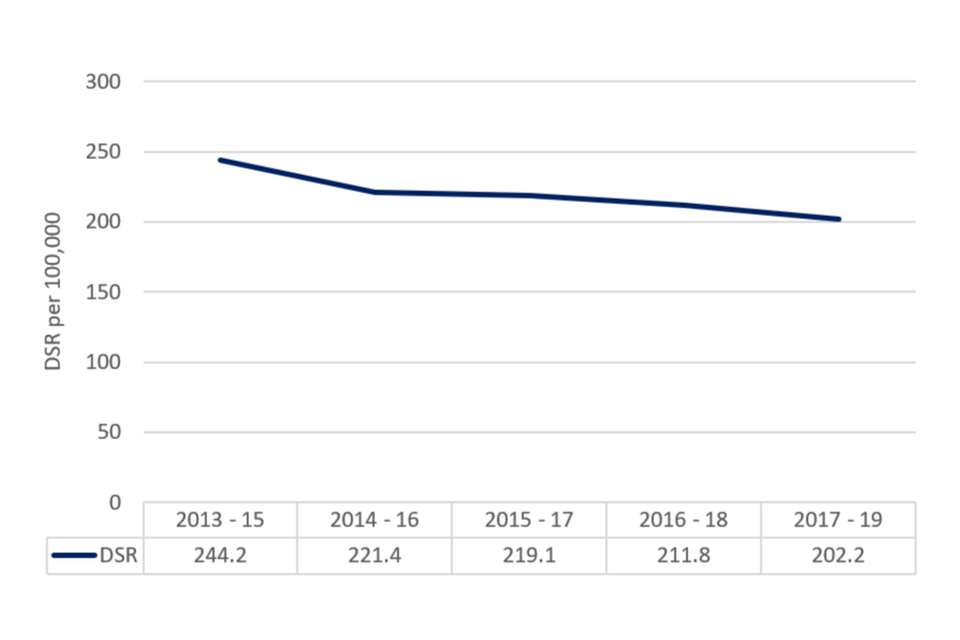
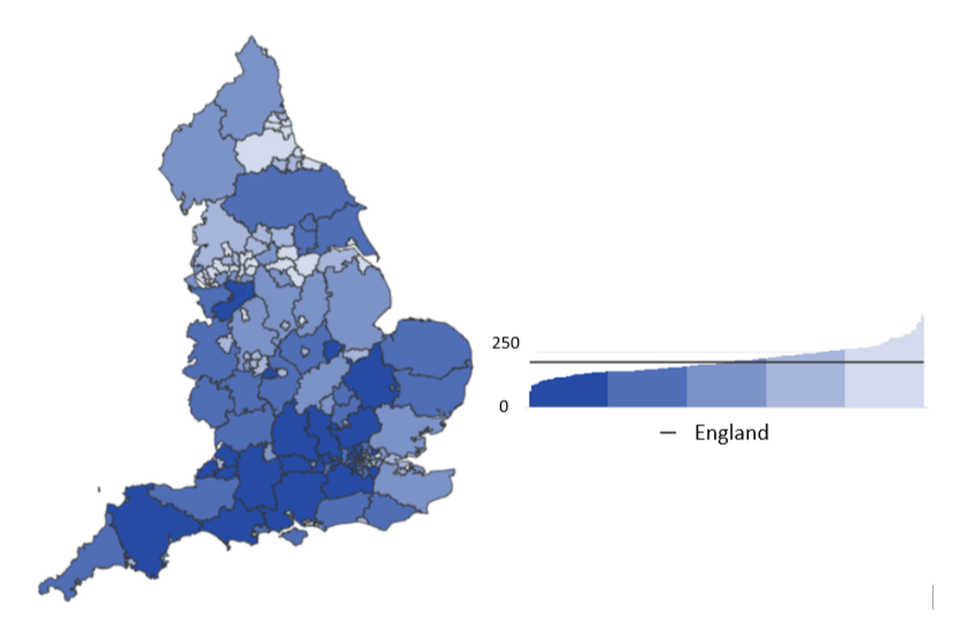
The rate of deaths attributable to smoking is highest in the most deprived decile (302.9 per 100,000) compared to the least deprived decile (142.7 per 100,000). For 2017 to 2019, Kingston upon Hull (419.7 per 100,000) had the highest rate of deaths attributable to smoking while Harrow (103.4 per 100,000) had the lowest.
Figure 2: Smoking attributable mortality (new method), County and UA, 2017 to 2019
Smoking attributable deaths from cancer (new method)
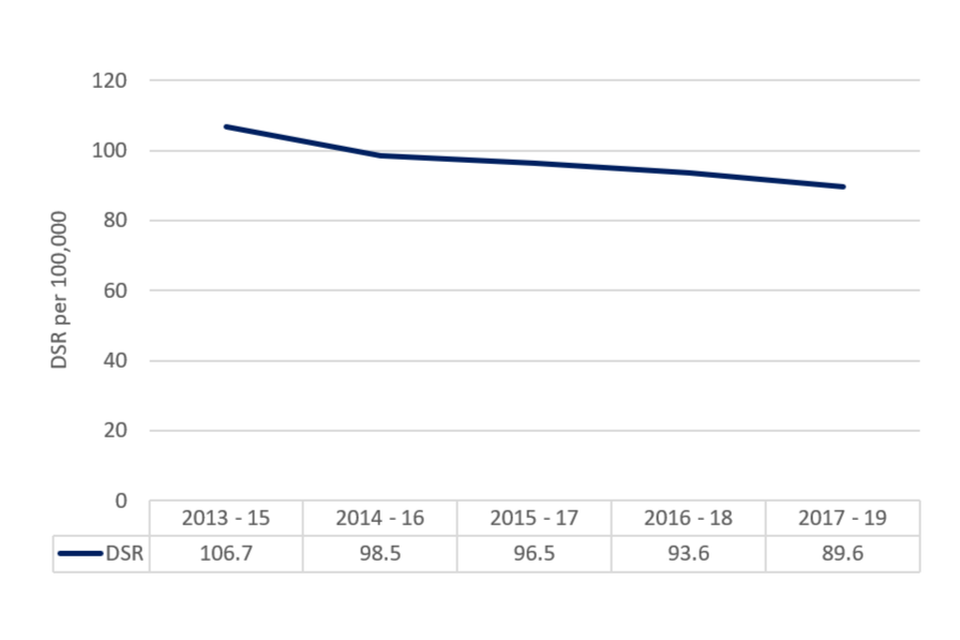
There were an estimated 84,780 smoking attributable deaths from cancer in 2017 to 2019. This equates to a rate of 89.6 per 100,000 and is the lowest rate since 2013 to 2015 (106.7 per 100,000).
The rate of smoking attributable deaths from cancer in the most deprived decile is almost double (127.6 per 100,000) the rate observed in the least deprived decile (65.4 per 100,000). For 2017 to 2019, Kingston upon Hull (168.4 per 100,000) had the highest rate of cancer deaths attributable to smoking while Harrow (47.7 per 100,000) had the lowest.
Figure 3: Smoking attributable deaths from cancer (new method), England
Smoking attributable deaths from heart disease (new method)
There were 27,950 deaths from heart disease attributed to smoking in 2017 to 2019. The rate has fallen slightly to 29.3 (per 100,000) in the latest period from 31.0 (per 100,000) in 2016 2018.
Figure 4: Smoking attributable deaths from heart disease (new method), England
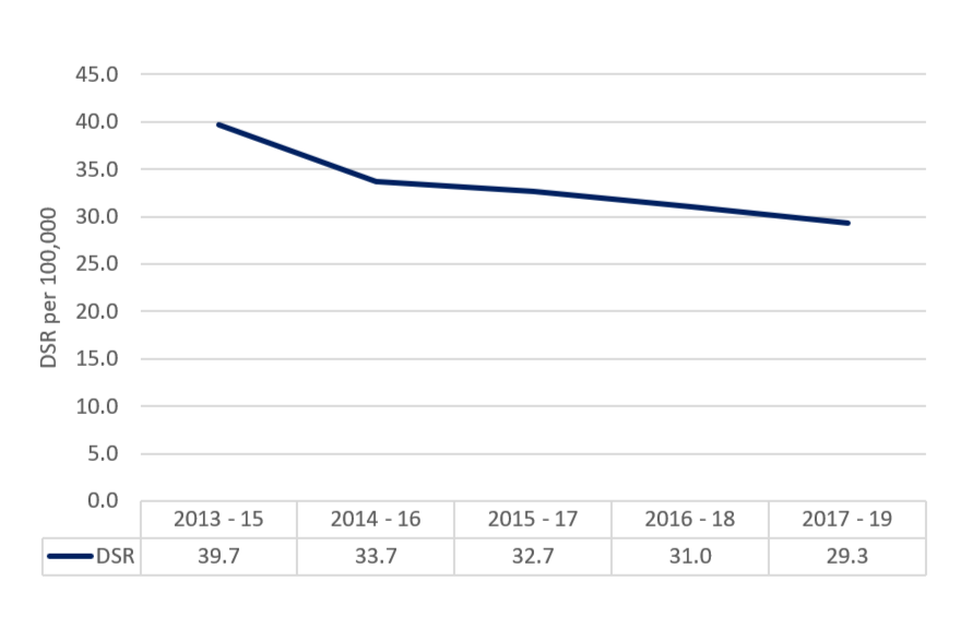
The rate of smoking attributable deaths from heart disease in the most deprived decile is more than double (47.1 per 100,000) the rate observed in the least deprived decile (19.2 per 100,000). For 2017 to 2019, Manchester (66.9 per 100,000) had the highest rate of smoking attributable deaths from heart disease while Wokingham (14.3 per 100,000) had the lowest.
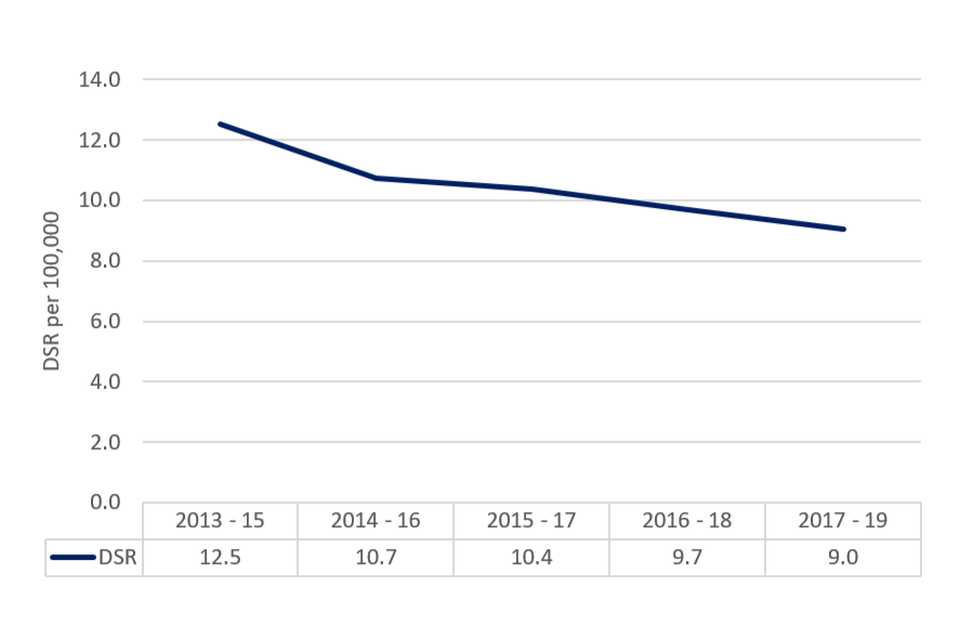
Smoking attributable deaths from stroke (new method)
In 2017 to 2019 there were an estimated 8,630 deaths from stroke related to smoking in England. The rate has decreased to 9.0 per 100,000 in 2017 to 2019 from 9.7 deaths per 100,000 in 2016 to 2018.
Figure 5: Smoking attributable deaths from stroke (new method), England
As seen in many other smoking indicators, there is a marked and persistent deprivation inequality observed for smoking related deaths from stroke – the rate for the most deprived (12.6 per 100,000) is double the rate for the least deprived (6.6 per 100,000). For 2017 to 2019, Kingston upon Hull (22.2 per 100,000) had the highest rate of smoking attributable deaths from stroke while Richmond upon Thames (4.6 per 100,000) had the lowest.
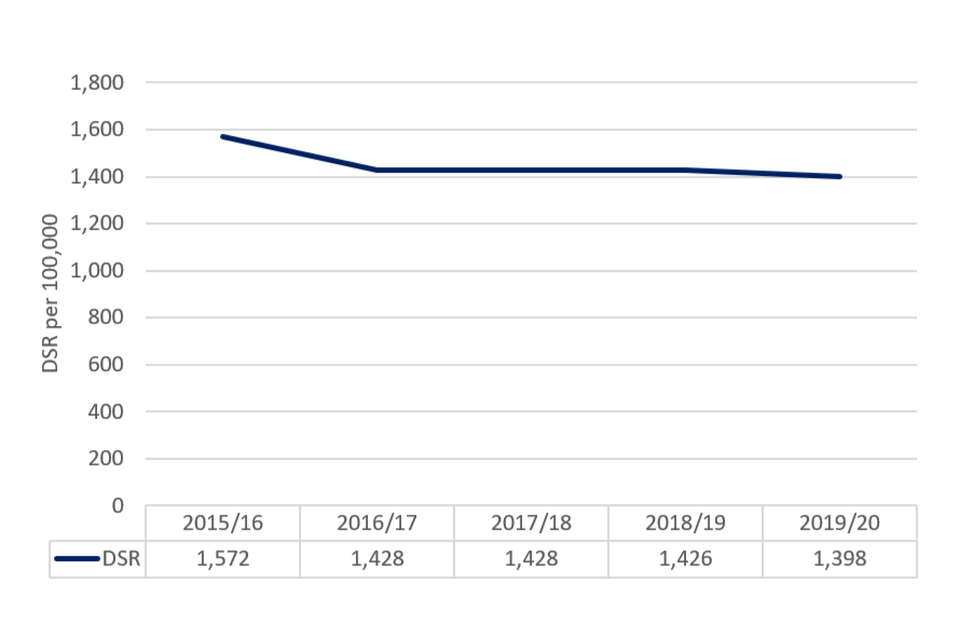
Smoking attributable hospital admissions (new method).
In 2019 to 2020 there were an estimated 448,030 smoking related hospital admissions in England. The rate has decreased to 1,398 admissions per 100,000 in 2019 to 2020 from 1,426 admissions per 100,000 in 2018 to 2019.
Figure 6: Smoking related hospital admissions, England, 2015 to 16 to 2019 to 2020
The rate of smoking related hospital admissions in the most deprived decile is more than double (1,995 per 100,000) the rate observed in the least deprived decile (943 per 100,000). For 2017 to 2019, Blackpool (3,071 per 100,000) had the highest rate of smoking related hospital admissions while Wokingham (516 per 100,000) had the lowest.
Background and further information
The local tobacco control profiles for England provides a snapshot of the extent of tobacco use, tobacco related harm, and measures being taken to reduce this harm at a local level. These profiles have been designed to help local government and health services to assess the effect of tobacco use on their local populations. They will inform commissioning and planning decisions to tackle tobacco use and improve the health of local communities.
The tool allows you to compare your local authority against other local authorities in the region and benchmark your local authority against the England or regional average.
View the LTCP for England.
Responsible statistician, product lead: Mark Cook For queries relating to this publication, please contact: Tobacco.Profiles@phe.gov.uk