Housing Benefit Debt Recovery statistics: April 2021 to March 2022
Published 7 September 2022
Applies to England, Scotland and Wales

© Crown copyright 2022
This publication is licensed under the terms of the Open Government Licence v3.0 except where otherwise stated. To view this licence, visit nationalarchives.gov.uk/doc/open-government-licence/version/3 or write to the Information Policy Team, The National Archives, Kew, London TW9 4DU, or email: psi@nationalarchives.gov.uk.
Where we have identified any third party copyright information you will need to obtain permission from the copyright holders concerned.
This publication is available at https://www.gov.uk/government/statistics/housing-benefit-debt-recoveries-statistics-april-2021-to-march-2022/housing-benefit-debt-recovery-statistics-april-2021-to-march-2022
The latest release of these statistics can be found in the collection of Housing Benefit: debt recoveries statistics.
Housing Benefit (HB) is an income-related benefit that is intended to help meet housing costs for rented accommodation.
This publication updates statistics on the amount of HB that local authorities (LAs) identified had been overpaid to claimants, the amount recovered and the amount written off, with data for the financial year ending (FYE) 2022 (April 2021 to March 2022).
1. Main stories
During FYE 2022:
-
LAs identified £411 million overpaid HB – £31 million more than during FYE 2021
-
LAs recovered £423 million overpaid HB – £9 million more than during FYE 2021
-
LAs wrote off £63 million overpaid HB – £0.5 million less than during FYE 2021
-
at the start of Q4 of FYE 2022, there was £1.78 billion outstanding overpaid HB – £96 million less than at the start of Q4 of FYE 2021
2. What you need to know
This summary contains statistics on the amount of overpaid HB identified, recovered and written-off by LAs. The statistics are based on the Housing Benefit Debt Recovery (HBDR) returns, collected from LAs each quarter.
The statistics are published twice a year, in March and September. The March publication contains data for the first two quarters of the financial year (April to September). The September publication contains data for the whole of the financial year.
Data tables containing data that underpin the charts and figures featured in this statistical summary are available. As well as the regional and GB totals shown in this statistical summary, the data tables show figures for individual LAs.
Some LAs do not send data returns every quarter or cannot supply data for all fields. In early years of the HBDR collection, estimates were made of missing data. These were added to the data that LAs did return to produce estimates of GB totals.
In the charts in this summary, GB figures up to Quarter 2 of FYE 2017 are “imputed” totals, based on estimates of missing LA data. From Quarter 3 of FYE 2017, figures shown are those actually returned by LAs, with no estimates being made for missing data. However, the amount of missing data excluded from the figures is small – in FYE 2022, returns were received covering 99.2% of HB claimants in GB.
Since the end of 2018, most new working-age claimants have claimed the housing element of Universal Credit (UC) rather than HB. The number of people claiming HB has been steadily decreasing and will continue to fall as existing HB claims transfer to UC. This has had an impact, both on the amount of overpaid HB identified by LAs, and the amount of overpaid HB that they recover.
3. Key trends
Since FYE 2020, LAs have either recovered or written-off more HB overpayments than they have identified. As a result, the total amount of outstanding debt has fallen. At the start of Q4 of FYE 2022, total outstanding debt stood at £1.78 billion. This was £96 million (5%) less than at the start of Q4 of FYE 2021.
During the COVID lockdowns, many LAs redeployed staff away from debt recovery to frontline activities and restricted face-to-face meetings between staff and claimants. Subsequently, FYE 2021 saw the lowest amount of overpaid HB identified by LAs since the statistics began. In total, £380 million of overpaid HB was identified in FYE 2021 compared with £599 million in FYE 2020.
The amount of overpaid HB that LAs identified increased by £31 million, or 8%, between FYE 2021 and FYE 2022, to £411 million. However, the amount of overpaid HB that LAs identified remained below pre-Pandemic levels and, after increasing, from £92 million in Q3 of FYE 2021 to £107 million in Q2 of FYE 2022, in Q3 of FYE 2022 it started to fall again. In Q4 of FYE 2022 LAs identified £100 million overpaid HB.
The amount of overpaid HB that LAs recovered followed a similar trend, falling by 28% between FYE 2020 and FYE 2021. In FYE 2022, the amount of overpaid HB that LAs recovered increased slightly, by £9 million, or 2%. However, after increasing, from £99 million in Q2 of FYE 2021 to £109 million in Q2 of FYE 2022, in Q3 of FYE 2022 it started to fall again. In Q4 of FYE 2022 LAs recovered £102 million overpaid HB.
The amount of overpaid HB that LAs wrote-off fell by £0.5 million, or 1%, in FYE 2022, to £63 million.
4. Total outstanding HB overpayments
At the start of Q4 of FYE 2022, total outstanding HB overpayments stood at £1.78 billion. This was £96 million (5%) less than at the start of Q4 of FYE 2021.
Total outstanding HB overpayments in Great Britain from Q1 FYE 2010 to Q4 FYE 2022 (£ billions)
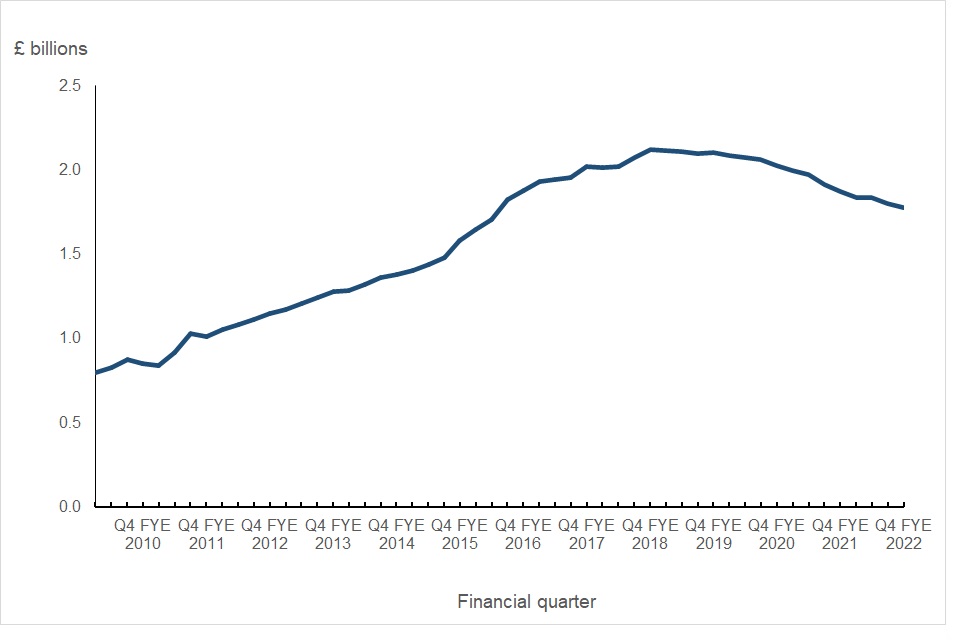
Note: GB figures up to Q2 of FYE 2017 are “imputed” totals, based on estimates of missing LA data. From Q3 of FYE 2017, figures shown are those actually returned by LAs. Source: HBDR data tables.
Up to the end of FYE 2018, the amount of overpaid HB that LAs recovered or wrote-off each quarter was, on average, around 75% to 80% of the amount of overpaid HB that they identified. As a result, the total amount of outstanding overpaid HB steadily increased.
Since FYE 2020, the total amount of overpaid HB outstanding has been falling because LAs are recovering or writing-off more HB overpayments than they newly identify. In Q4 of FYE 2022, LAs recovered £102 million overpaid HB and wrote-off £21 million overpaid HB, compared with £100 million overpaid HB identified.
Amount of overpaid HB identified / recovered and written-off by LAs from Q1 FYE 2010 to Q4 FYE 2022 (£ millions)
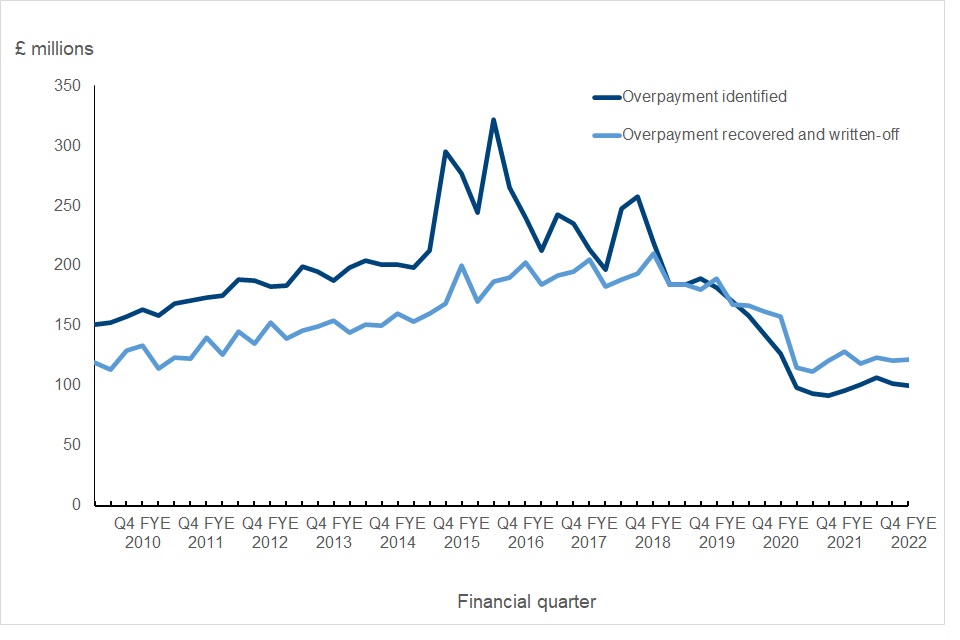
Note: GB figures up to Q2 of FYE 2017 are “imputed” totals, based on estimates of missing LA data. From Q3 of FYE 2017, figures shown are those actually returned by LAs. Source: HBDR data tables.
At the start of Q4 of FYE 2022, London LAs reported £607 million outstanding overpaid HB, just over a third (34%) of the GB total. At the start of Q4 of FYE 2022, 90% of the outstanding overpaid HB in GB was in LAs in England, 3% in LAs in Wales and 8% in LAs in Scotland.
Total outstanding HB overpayments by region, at the start of Q4 of FYE 2022
| Region | Total outstanding HB overpayments (£ millions) | Percentage of GB total |
|---|---|---|
| Great Britain | 1,778 | 100% |
| North East | 60 | 3% |
| North West | 179 | 10% |
| Yorkshire and The Humber | 93 | 5% |
| East Midlands | 83 | 5% |
| West Midlands | 159 | 9% |
| East | 121 | 7% |
| London | 607 | 34% |
| South East | 197 | 11% |
| South West | 91 | 5% |
| Wales | 48 | 3% |
| Scotland | 138 | 8% |
Source: HBDR data tables.
5. HB overpayments newly identified by LAs
There was a steady increase in the amount of overpaid HB that LAs identified, from £151 million in Q1 of FYE 2010 to £213 million in Q2 of FYE 2015.
In Q3 of FYE 2015, there was a sharp increase in the amount of overpaid HB identified, followed by several years in which the amount of overpaid HB identified by LAs fluctuated.
There was a sustained fall in the amount of overpaid HB identified by LAs, from £190 million in Q3 of FYE 2019 to £92 million in Q3 of FYE 2021. The amount of overpaid HB identified by LAs subsequently increased, to £107 million in Q2 of FYE 2022. However, in Q4 of FYE 2022 it had fallen again, to £100 million.
Factors influencing the amount of HB overpayment identified by LAs include:
-
the Fraud and Error Reduction Incentive Scheme (FERIS) was introduced in Q3 of FYE 2015 to help LAs to identify and prevent HB overpayment. Around the same time, real-time information (RTI) on claimant’s incomes became available to LAs. The income that claimants reported on their HB claims was checked against RTI on claimants’ actual income from HMRC. These checks led to undeclared income, and consequently overpaid HB, being identified by LAs
-
UC rollout – at the start of Q3 FYE 2015, there were just over 4.9 million HB claimants in GB. By the start of Q4 FYE 2022, this number had fallen by 46% to just over 2.6 million. Since Q3 of FYE 2019, most new working-age claimants have claimed the housing element of UC rather than HB
-
during the COVID lockdowns in Q4 FYE 2020 and FYE 2021, many LAs redeployed staff away from debt recovery to frontline activities and restricted face-to-face meetings between staff and claimants
HB overpayments newly identified in Great Britain, from Q1 of FYE 2010 to Q4 of FYE 2022 (£ millions)
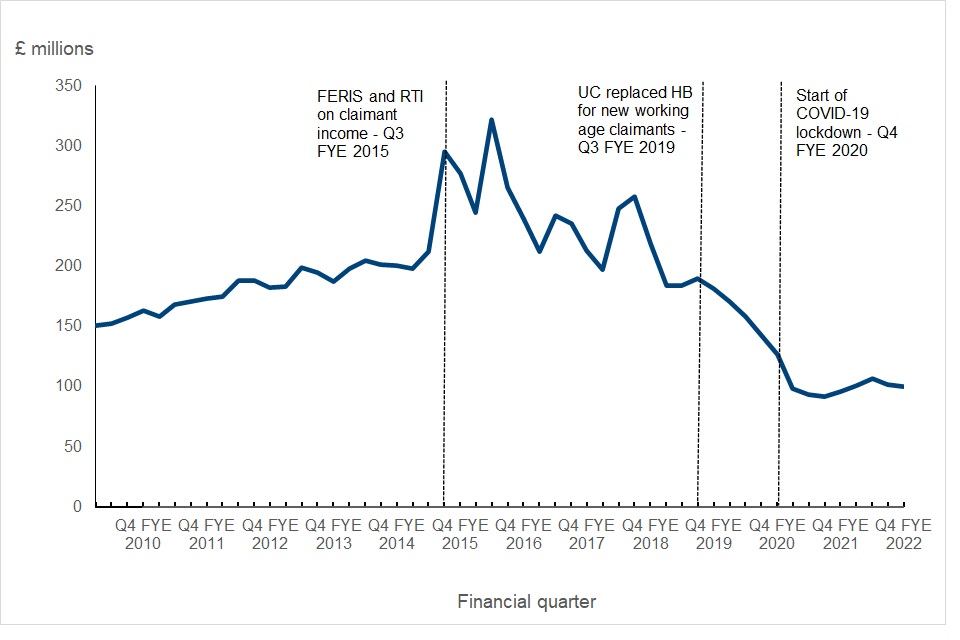
Note: GB figures up to Q2 of FYE 2017 are “imputed” totals, based on estimates of missing LA data. From Q3 of FYE 2017, figures shown are those actually returned by LAs. Source: HBDR data tables.
The amount of overpaid HB identified by LAs in FYE 2022 ranged from £13 million (3% of the GB total) in Wales and the North East to £125 million (31% of the GB total) in London. Of the overpaid HB identified in GB, 91% was identified by LAs in England, 3% by LAs in Wales and 6% by LAs in Scotland.
HB overpayments newly identified by LAs, by region, FYE 2022
| Region | HB overpayments identified (£ millions) | Percentage of GB total |
|---|---|---|
| Great Britain | 411 | 100% |
| North East | 13 | 3% |
| North West | 36 | 9% |
| Yorkshire and The Humber | 22 | 5% |
| East Midlands | 19 | 5% |
| West Midlands | 60 | 15% |
| East | 30 | 7% |
| London | 125 | 31% |
| South East | 46 | 11% |
| South West | 24 | 6% |
| Wales | 13 | 3% |
| Scotland | 23 | 6% |
Source: HBDR data tables.
During FYE 2022, LAs identified overpaid HB equivalent to £12.51 per claimant per month. LAs in London identified the highest amount of overpaid HB, equivalent to £21.26 per claimant per month. LAs in England identified overpaid HB equivalent to £13.47 per claimant per month, compared with £7.78 in Wales and £6.90 in Scotland.
Average HB overpayment newly identified per claimant per month by region during FYE 2022
| Region | Average HB overpayment newly identified per claimant per month |
|---|---|
| Great Britain | £12.51 |
| England | £13.47 |
| North East | £7.81 |
| North West | £9.00 |
| Yorkshire and the Humber | £8.02 |
| East Midlands | £9.16 |
| West Midlands | £19.64 |
| East | £12.03 |
| London | £21.26 |
| South East | £12.91 |
| South West | £10.01 |
| Wales | £7.78 |
| Scotland | £6.90 |
Source: HBDR data tables.
6. HB overpayments recovered
The amount of overpaid HB recovered by LAs steadily increased, reaching a high of £175 million in Q4 of FYE 2018. Subsequently, the amount of overpaid HB recovered by LAs fell steadily, to £132 million in Q4 of FYE 2020.
The start of the COVID-19 lockdown saw a sharp fall in the amount of overpaid HB recovered by LAs. In Q1 of FYE 2021, it fell by nearly £30 million, to £103 million. In Q2 of FYE 2021 it fell again, to £99 million. There was a small increase in the amount of overpaid HB recovered by LAs, to £109 million in Q2 of FYE 2022. By Q4 of FYE 2022, however, it had fallen again, to £102 million.
HB overpayments recovered in Great Britain from Q1 of FYE 2010 to Q4 of FYE 2022 (£ millions)
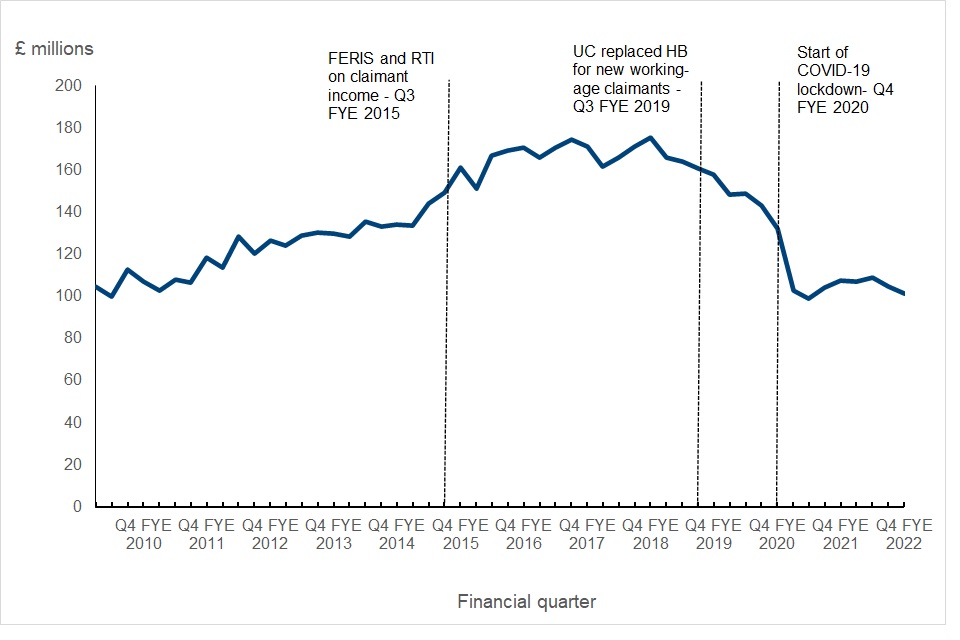
Note: GB figures up to Q2 of FYE 2017 are “imputed” totals, based on estimates of missing LA data. From Q3 of FYE 2017, figures shown are those actually returned by LAs. Source: HBDR data tables.
In FYE 2022, LAs in London reported 27% of the total amount of HB overpayments recovered in GB. Of the total HB overpayments recovered in GB, 92% was recovered by LAs in England, 3% by LAs in Wales and 5% by LAs in Scotland.
HB overpayments recovered by region, FYE 2022
| Region | HB overpayments recovered (£ millions) | % of GB total |
|---|---|---|
| Great Britain | 423 | 100% |
| North East | 15 | 3% |
| North West | 39 | 9% |
| Yorkshire and The Humber | 24 | 6% |
| East Midlands | 22 | 5% |
| West Midlands | 65 | 15% |
| East | 34 | 8% |
| London | 114 | 27% |
| South East | 50 | 12% |
| South West | 25 | 6% |
| Wales | 14 | 3% |
| Scotland | 22 | 5% |
Source: HBDR data tables.
7. HB overpayments written off
Each year, the amount of overpaid HB written-off by LAs has been highest in Q4 (January to March) of the financial year. Q1 of the following year has seen a sharp fall.
In Q1 of FYE 2022, LAs wrote-off £12 million overpaid HB. This increased to £21 million in Q4 of FYE 2022. The overall amount of overpaid HB written-off in FYE 2022 was £0.5 million, or 1%, less than in FYE 2021.
Taking the financial year as a whole, FYE 2018 saw the highest amount of overpaid HB written-off, at £100 million, or £25 million per quarter. Since FYE 2018, the amount of overpaid HB written-off has fallen. In FYE 2022, £63 million was written-off, or just over £15 million per quarter.
HB overpayments written off in Great Britain, from Q4 of FYE 2010 to Q4 of FYE 2022 (£ millions)
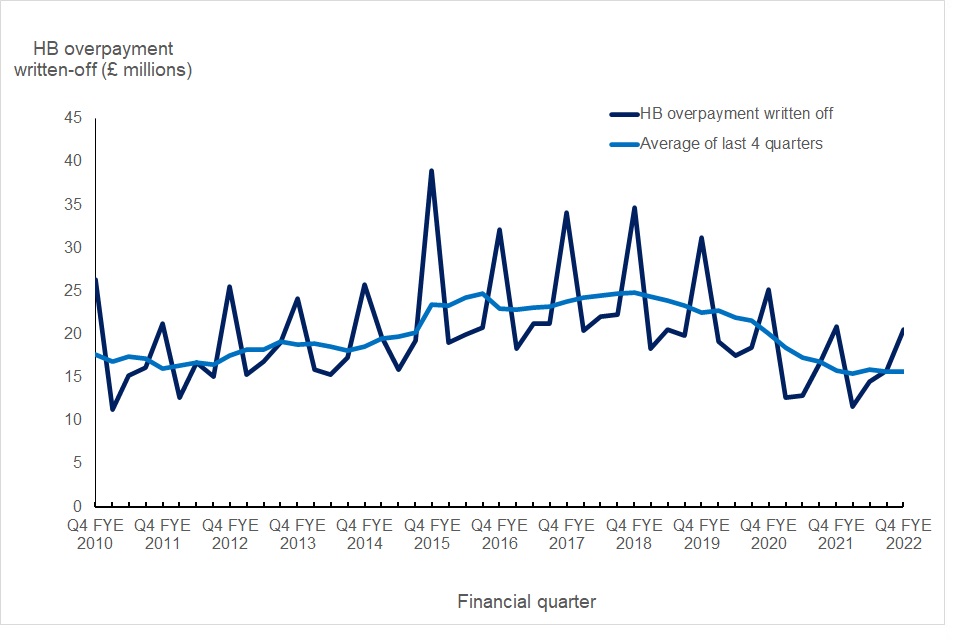
Note: GB figures up to Q2 of FYE 2017 are “imputed” totals, based on estimates of missing LA data. From Q3 of FYE 2017, figures shown are those actually returned by LAs. Source: HBDR data tables.
The amount of overpaid HB written-off by LAs in FYE 2022 ranged from £2.2 million (4% of the GB total) in Wales to £17.7 million (28% of the GB total) in London. 89% of write-off was made by LAs in England, 4% by LAs in Wales and 7% by LAs in Scotland.
HB overpayments written off by region, FYE 2022
| Region | HB overpayments written-off (£ millions) | Percentage of GB total |
|---|---|---|
| Great Britain | 62.6 | 100% |
| North East | 3.5 | 6% |
| North West | 6.4 | 10% |
| Yorkshire and The Humber | 4.6 | 7% |
| East Midlands | 3.3 | 5% |
| West Midlands | 4.3 | 7% |
| East | 4.4 | 7% |
| London | 17.7 | 28% |
| South East | 7.0 | 11% |
| South West | 4.6 | 7% |
| Wales | 2.2 | 4% |
| Scotland | 4.4 | 7% |
Source: HBDR data tables.
8. About these statistics
This summary contains statistics on the amount of overpaid HB identified, recovered and written-off by LAs. The statistics are based on the Housing Benefit Debt Recovery (HBDR) returns, collected from LAs each quarter.
Publication schedule
The statistics are published twice a year, in March and September. The March publication contains data for the first two quarters of the financial year (April to September). The September publication updates the statistics with data for the whole of the financial year. Where LAs notified us of changes to their first two quarters’ data or provided a late Quarter 1 or Quarter 2 return after the deadline for the March 2022 publication, these have been incorporated into this publication.
Supplementary statistics
Data tables containing data that underpin the charts and figures featured in this statistical summary are available. As well as the regional and GB totals shown in this statistical summary, the data tables show figures for individual LAs.
LAs are asked to provide a breakdown between overpaid “Rent Allowance” (HB paid to LA tenants) and “Rent Rebate” (HB paid to housing association and private sector tenants). This breakdown is shown in the supplementary tables, in those LAs for which it is available.
Data completeness
Some LAs do not send data returns every quarter or cannot supply data for all fields. This produces missing data in the returns. The table at the end of this summary shows the scale of missing data, each year since the HBDR collection began.
In the first year of the HBDR collection (FYE 2009) LAs that returned data accounted for less than 75% of all HB claimants. In view of the scale of missing returns in FYE 2009, data for FYE 2009 have been excluded from the charts in this summary.
After the first year, response rates improved. In FYE 2010, responses were received covering approximately 96.5% of all HB claimants and from FYE 2014, over 99% of HB claimants were covered by the returns.
Up to Q2 of FYE 2017, when an LA did not send a return, its figures were estimated. These estimates were added to the returns that LAs did submit, to produce an “imputed” GB total. Information on how these estimates were calculated is available in the background information and methodology document.
During FYE 2017, the methodology for treating missing LA data was reviewed. It was decided that, in recent years, the amount of data missing from the HBDR return had reduced to the point that estimates were unnecessary. Therefore, in this statistical summary, while “imputed” GB totals are shown for earlier years, all of the figures from Q3 of FYE 2017 onwards are based on the data actually returned by LAs.
Figures for Q1 and Q2 of FYE 2022 that were published in March 2022 covered around 98% of HB claimants in GB.
Since March 2022, we have been able to improve return rates and fill some of the gaps in the Q1 and Q2 data. Overall, in FYE 2022, returns were received covering 99.2% of HB claimants in GB. In line with our policy since the September 2017 publication, a decision has been taken that data for FYE 2022 published in this summary should be based on the figures actually returned by LAs, rather than estimates. We continue to work with LAs to reduce the number of missing returns and will review our policy for treating missing data should the number of missing returns increase.
Comparability
As well as missing data, the background information and methodology document describes a number of other factors that need to be considered when comparing data. These include:
-
it is not possible to make direct comparisons between the amount of HB overpayments that LAs identify during a particular period and the amount of overpayment that they recover in that period. Firstly, because overpayments are not necessarily identified in the same period that they occurred. Secondly, because overpayments are not necessarily recovered in the same period that they are identified
-
the number of people claiming HB has been decreasing and will continue to fall as Universal Credit (UC) replaces HB for working age claimants
-
the Fraud and Error Reduction Incentive Scheme (FERIS) provided LAs with tools to help them identify and prevent overpaid HB. Real-time information (RTI) on claimants’ income became available to LAs at around the same time (Q3 of FYE 2015). This allowed LAs to identify income that claimants had failed to report on their HB claims, which in turn led to an increase in the amount of overpaid HB that LAs were able to identify
-
at the start of the COVID-19 pandemic, many LAs redeployed staff away from debt recovery to frontline activities and restricted face-to-face meetings between staff and claimants
-
LAs sometimes identify an amount by which a HB claimant has been overpaid, but then revise this amount at a later date. In some cases, for instance, “underlying entitlement” might be retrospectively applied to an overpayment, reducing the amount that the claimant was originally thought to owe. Conversely, an LA might retrospectively reverse their decision to write-off an overpayment. These revisions lead to a discrepancy between figures for one quarter and the next
The total amount of HB overpayment at the start of a quarter should, in theory, equal the total amount of overpayment at the start of the previous quarter, plus the amount of overpayment newly identified during the previous quarter, minus the amount of overpayment recovered and written-off during the previous quarter. However, this is not the case in all LAs. Nationally, the total amount of outstanding HB overpayment that LAs reported at the start of Q4 of FYE 2022 was 0.37% less than the figures reported in Q3 suggested it would be. This difference was a result of revisions made in Q4 to overpayments that LAs first identified in previous quarters. The background information and methodology document describes this issue in more detail.
Local authority mergers
There have recently been a number of local authority mergers. Four LAs in Buckinghamshire, for instance, merged to form a single LA. Although the LAs officially merged in 2020, their IT systems merged later. As a result, in Q4 of FYE 2022, there was an incomplete return for Buckinghamshire LA.
The way that figures are presented in the supplementary tables has changed since the last set of HBDR statistics were published in March 2022. The statistics shown are based on the current LA configuration, with figures for the “old” LAs that merged to form the new LAs no longer shown. This is consistent with HB caseload figures published on Stat-Xplore.
Average HB overpayment identified per claimant per month
This summary includes a table showing the equivalent amount of overpaid HB, per claimant per month. This is calculated by dividing the total amount of overpaid HB identified by LAs in FYE 2022, by the sum of the HB caseload in each month of FYE 2022. Data on the number of HB claimants was taken from Stat-Xplore.
This is not an exact measure because, although LAs might report during a particular quarter that they had identified an amount of overpaid HB, this overpayment might have occurred in a previous quarter or financial year and the claimant whose HB was overpaid may no longer have been receiving HB when the overpayment was identified.
Rounding policy
Percentage figures presented in this document are rounded to the nearest 1%. In some cases, figures may not add up to 100% due to rounding.
In the supplementary tables, raw data provided by LAs have been added to generate regional and national totals, before being rounded to the nearest £1,000. As a result of this rounding, the sum of the LA figures shown in the tables may be slightly different to the regional and national totals.
Related statistics
These statistics show the amount of HB overpayment that is identified and subsequently recovered by LAs. DWP carry out a sampling exercise to estimate overall levels of fraud and error in HB, including overpayment not identified by LAs. According to the latest estimate, published in May 2022, there was approximately £860 million overpaid HB in FYE 2022. An estimated £540 million was overpaid due to fraud, £260 million due to claimant error and £70 million due to official error.
9. HBDR data: collection processes and accuracy
Data collection
The table below details the list of questions asked to LAs as part of the data collection process.
| Field | Overpayment Questions |
|---|---|
| 1 | Total value of HB overpayments outstanding at the start of the quarter |
| 2 | Total value of HB overpayments identified during the quarter |
| 3 | Total value of HB overpayments recovered during the quarter |
| 4 | Total value of HB overpayments written off during the quarter |
LAs are asked to provide a breakdown between overpaid “Rent Allowance” (HB paid to LA tenants) and “Rent Rebate” (HB paid to housing association and private sector tenants). Where this breakdown is available it is shown in the “supplementary tables”.
Average data return rates
| Collection Period | Percentage of HB caseload covered by the HBDR returns |
|---|---|
| FYE 2009 | 74.0% |
| FYE 2010 | 96.5% |
| FYE 2011 | 96.3% |
| FYE 2012 | 97.9% |
| FYE 2013 | 98.7 % |
| FYE 2014 | 99.1% |
| FYE 2015 | 99.3% |
| FYE 2016 | 99.9% |
| FYE 2017 | 99.3% |
| FYE 2018 | 100.0% |
| FYE 2019 | 100.0% |
| FYE 2020 | 99.9% |
| FYE 2021 | 99.3% |
| FYE 2022 | 99.2% |
10. Further information
Our background information and methodology document provides further information on the HBDR statistics, including some of the processes involved in developing and releasing these statistics.
Data tables containing data that underpin the charts and figures featured in this statistical summary are also published.
National Statistics status
The UK Statistics Authority has designated these statistics as National Statistics, at June 2012, in accordance with the Statistics and Registration Service Act 2007 and signifying compliance with the Code of Practice for Statistics.
National Statistics status means that our statistics meet the highest standards of:
-
trustworthiness
-
quality
-
public value
Once statistics have been designated as National Statistics it is our responsibility to maintain compliance with these standards. In order to assess the quality of the HBDR statistics, in July 2021, LAs were sent a survey, asking them a number of questions about how they complete their returns. Information collected on this survey has been incorporated into the background information and methodology document.
Other National and Official Statistics
Details of other National and Official Statistics produced by the DWP:
- a schedule of statistical releases over the next 12 months and a list of the most recent releases
Feedback
Specific HBDR statistics feedback can be submitted via our HBDR user questionnaire
Completed questionnaires can be returned by email to cbm.stats@dwp.gov.uk
Users can also join the “Welfare and Benefit Statistics” community. DWP announces items of interest to users via this forum, as well as replying to users’ questions
Lead Statistician: Owen Williams
DWP Press Office: 020 3267 5144
ISBN: 978-1-78659-392-4