Farm rents - England 2020
Updated 23 January 2024
Applies to England

© Crown copyright 2024
This publication is licensed under the terms of the Open Government Licence v3.0 except where otherwise stated. To view this licence, visit nationalarchives.gov.uk/doc/open-government-licence/version/3 or write to the Information Policy Team, The National Archives, Kew, London TW9 4DU, or email: psi@nationalarchives.gov.uk.
Where we have identified any third party copyright information you will need to obtain permission from the copyright holders concerned.
This publication is available at https://www.gov.uk/government/statistics/historic-farm-rents/farm-rents-england-2020
Farm Rents, England 2020/21
Data on farm rents are used by tenant farmers and landlords to set rents and by Defra to inform decisions on statutory succession. Throughout this release the results from the 2020/21 Farm Business Survey (FBS) will be referred to as the 2020 results.
This release provides estimates of average rents paid under Full Agricultural Tenancies, Farm Business Tenancies, seasonal agreements and informal agreements for 2019 to 2020, together with the area of land covered by these agreements.
All rental values are annual figures for March/February years.
Key results
- The average annual rent for Full Agricultural Tenancy (FAT) agreements in 2020 was £185 per hectare, a 5% increase compared to 2019. The South West saw the largest fall in average rent to £178 per hectare, 6% lower than 2019, whilst the North East saw the largest increase of 21% to £166 per hectare.
- Farm Business Tenancy (FBT) agreements increased by 8% to £239. The North East decreased by 13% to £203, the largest decrease. The North West increased the most by 17% to £149. The average length of term was 4 years 11 months.
- Seasonal rent was little changed compared to 2019 increasing by only 1% to £150. All farm types saw a rise in seasonal rent except lowland grazing livestock where there was a 3% fall to £117. The average term of seasonal agreements was 9 months.
- Informal rents decreased by 4% to £219. In the North East informal rents more than doubled rising by 122% to £169 per hectare. The average length of informal agreements was 1 year and 2 months.
1 All Agreement Types
The total number of agreements is estimated to be 94,029, a small decrease from 2019. The breakdown by agreement type is shown in Figure 1.1. While FAT and FBT agreements show a decline, informal agreements show an increase with seasonal agreements increasing slightly.
Figure 1.1 Total number of agreements by type(a)(b)
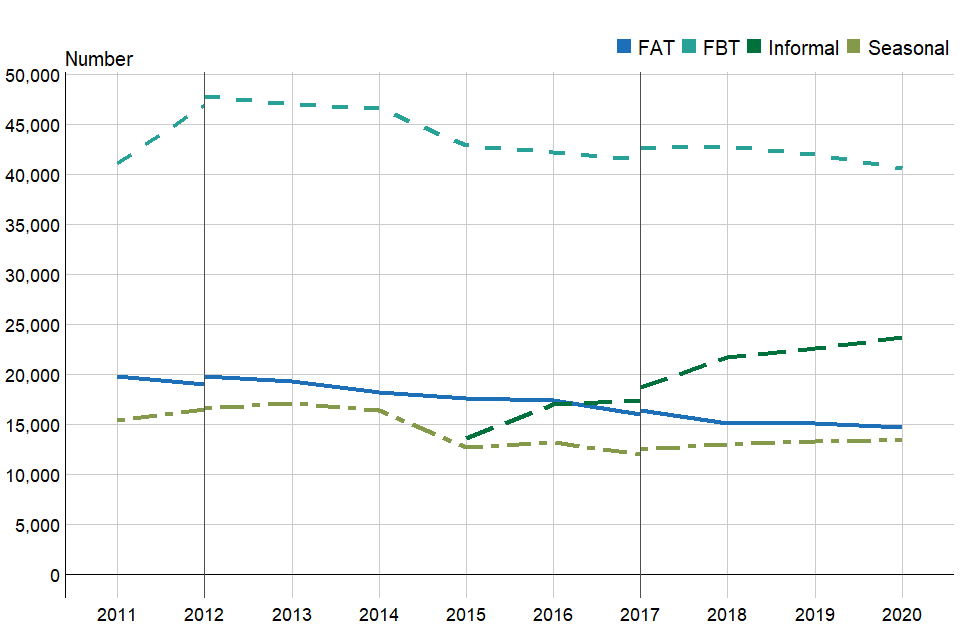
(a) The breaks in the series shown in 2012 and 2017 represent changes in the method used to assign farms to a specific farm type. Where breaks occur, average income has been calculated using both methods for comparability.
(b) Until 2014, FBT included Farm Business Tenancies and similar informal agreements. Informal agreements in this context were those that are based on the same principles as an FBT but without the accompanying legal documentation.
1.1 Total rent paid
With the exception of seasonal agreements, the total annual rent paid has increased. FBTs and FATs have the highest rent paid with seasonal the least (Figure 1.2 and Table 1.1). The values expressed in real terms are shown in Figure 1.3 and Table 1.2.
Figure 1.2 Total annual rent paid by agreement type at current prices (£)(a)(b)
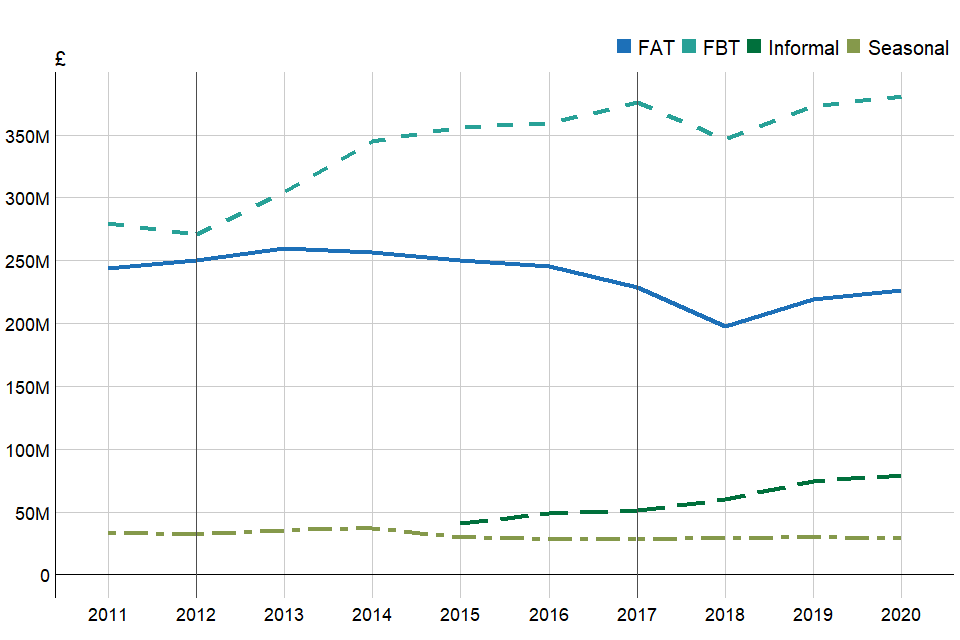
(a) The breaks in the series shown in 2012 and 2017 represent changes in the method used to assign farms to a specific farm type. Where breaks occur, average income has been calculated using both methods for comparability.
(b) Until 2014, FBT included Farm Business Tenancies and similar informal agreements. Informal agreements in this context were those that are based on the same principles as an FBT but without the accompanying legal documentation.
Table 1.1 Total annual rent paid by agreement type at current prices (£ million)
| Tenancy | 2018 | 2019 | 2020 | % change 2019 to 2020 | 95% Confidence interval 2020 (+/-) |
|---|---|---|---|---|---|
| FAT | 197.9 | 219.5 | 226.5 | 3 | 40.2 |
| FBT | 346.9 | 373.1 | 380.5 | 2 | 55.5 |
| Seasonal | 28.7 | 29.8 | 29.0 | -3 | 6.4 |
| Informal | 59.8 | 74.1 | 79.5 | 7 | 15.6 |
| All | 753.3 | 726.5 | 734.2 | 1 | 67.8 |
Figure 1.3 Total annual rent paid by agreement type in real terms at 2020 prices (£ million)(a)(b)(c)
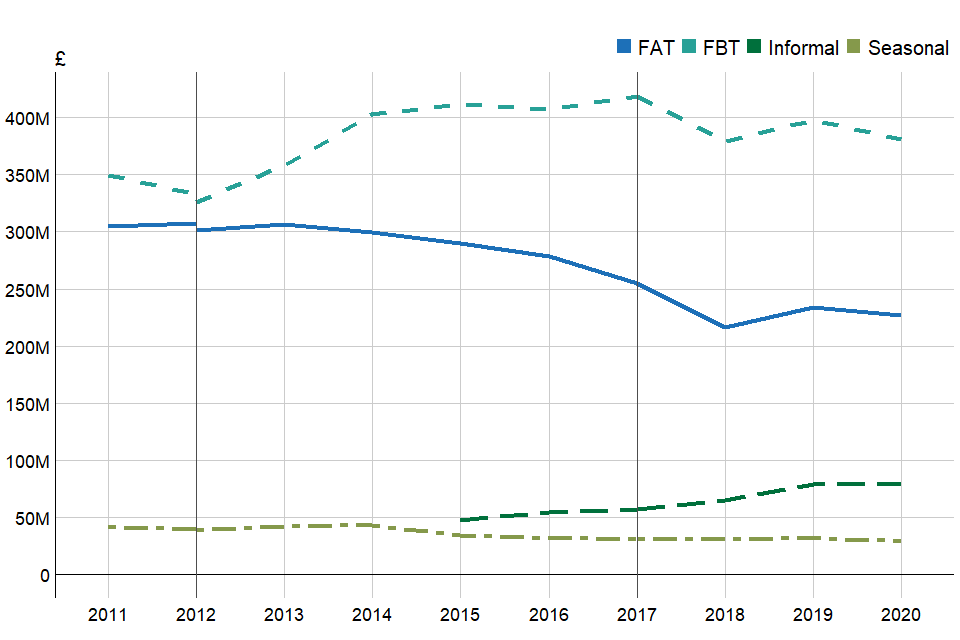
(a) The breaks in the series shown in 2012 and 2017 represent changes in the method used to assign farms to a specific farm type. Where breaks occur, average income has been calculated using both methods for comparability.
(b) Until 2014, FBT included Farm Business Tenancies and similar informal agreements. Informal agreements in this context were those that are based on the same principles as an FBT but without the accompanying legal documentation.
(c) Uses GDP deflator.
Table 1.2 Total annual rent paid by agreement type in real terms at 2020 prices (£ million)(a)
| Tenancy | 2018 | 2019 | 2020 | % change 2019 to 2020 | 95% Confidence interval 2020 (+/-) |
|---|---|---|---|---|---|
| FAT | 216.2 | 234.1 | 226.5 | -3 | 40.2 |
| FBT | 379.0 | 398.0 | 380.5 | -4 | 55.5 |
| Seasonal | 31.4 | 31.8 | 29.0 | -9 | 6.4 |
| Informal | 65.3 | 79.0 | 79.5 | 1 | 15.6 |
| All | 823.0 | 775.0 | 734.2 | -5 | 67.8 |
(a) Uses GDP deflator.
1.2 Average rent paid per hectare
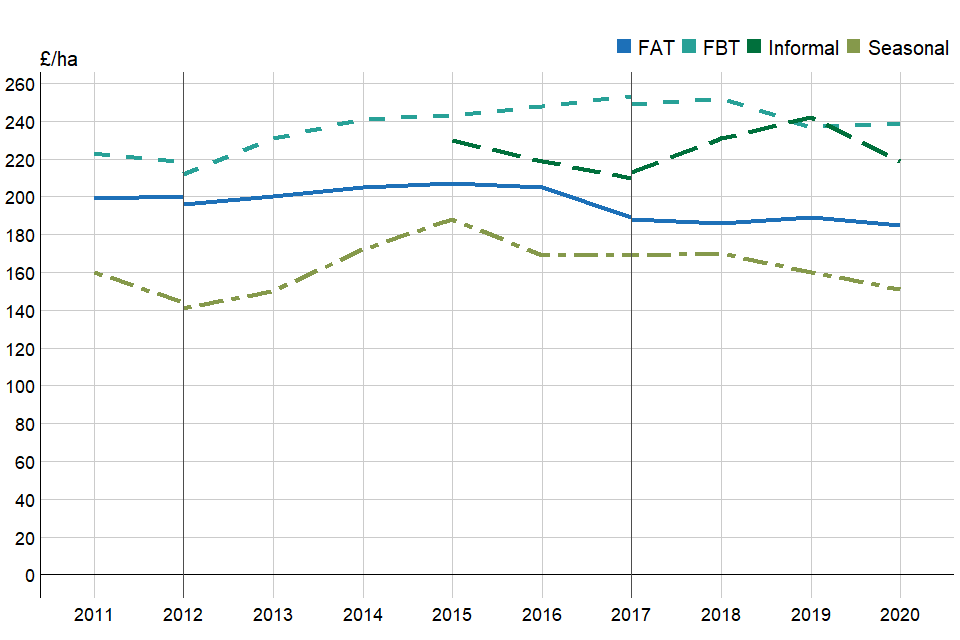
The average rent for FATs increased by 5% in 2020 to £185 per hectare while FBTs increased by 8% to £239 per hectare. Seasonal agreements saw little change, with a rise of just 1% to £151 per hectare. Informal agreements also increased, up 4% to £219 per hectare (Table 1.3 and Figure 1.4). The values expressed in real terms are shown in Figure 1.5 and Table 1.4.
Figure 1.4 Average annual rents by agreement type at current prices (£/ha)(a)(b)
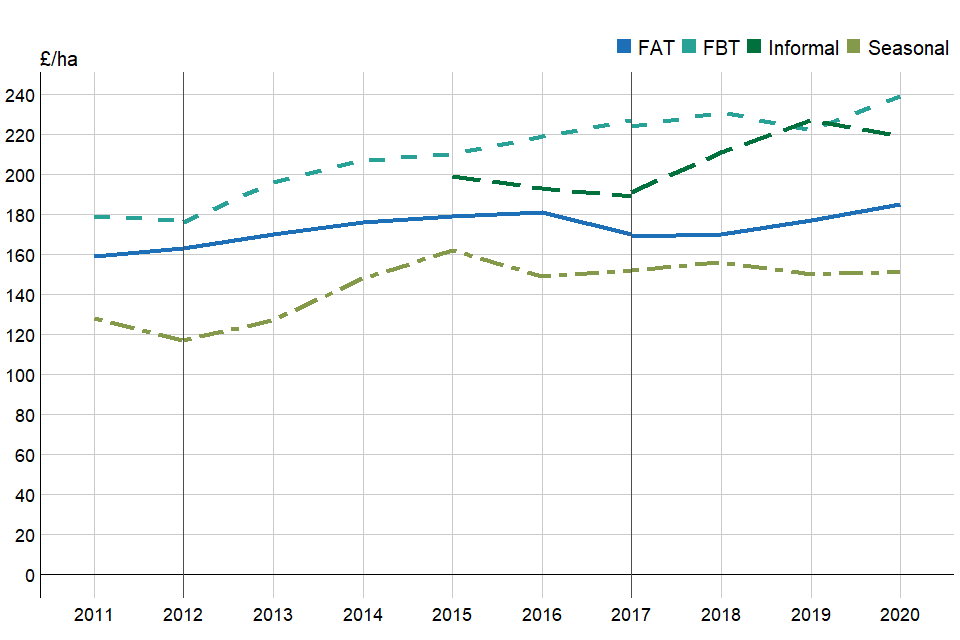
(a) The breaks in the series shown in 2012 and 2017 represent changes in the method used to assign farms to a specific farm type. Where breaks occur, average income has been calculated using both methods for comparability.
(b) Until 2014, FBT included Farm Business Tenancies and similar informal agreements. Informal agreements in this context were those that are based on the same principles as an FBT but without the accompanying legal documentation.
Table 1.3 Average annual rents by agreement type at current prices (£/ha)
| Tenancy | 2018 | 2019 | 2020 | % change 2019 to 2020 | 95% Confidence interval 2020 (+/-) |
|---|---|---|---|---|---|
| FAT | 170 | 177 | 185 | 5 | 22 |
| FBT | 231 | 222 | 239 | 8 | 21 |
| Seasonal | 156 | 150 | 151 | 1 | 21 |
| Informal | 211 | 227 | 219 | -4 | 30 |
| All | 210 | 204 | 213 | 4 | 12 |
Figure 1.5 Average annual rents by agreement type in real terms at 2020 (£/ha)(a)(b)(c)
(a) The breaks in the series shown in 2012 and 2017 represent changes in the method used to assign farms to a specific farm type. Where breaks occur, average income has been calculated using both methods for comparability.
(b) Until 2014, FBT included Farm Business Tenancies and similar informal agreements. Informal agreements in this context were those that are based on the same principles as an FBT but without the accompanying legal documentation.
(c) Uses GDP deflator.
Table 1.4 Average annual rents by agreement type in real terms at 2020 (£/ha)(a)
| Tenancy | 2018 | 2019 | 2020 | % change 2019 to 2020 | 95% Confidence interval 2020 (+/-) |
|---|---|---|---|---|---|
| FAT | 186 | 189 | 185 | -2 | 22 |
| FBT | 252 | 237 | 239 | 1 | 21 |
| Seasonal | 170 | 160 | 151 | -6 | 21 |
| Informal | 231 | 242 | 219 | -10 | 30 |
| All | 229 | 218 | 213 | -2 | 12 |
(a) Uses GDP deflator.
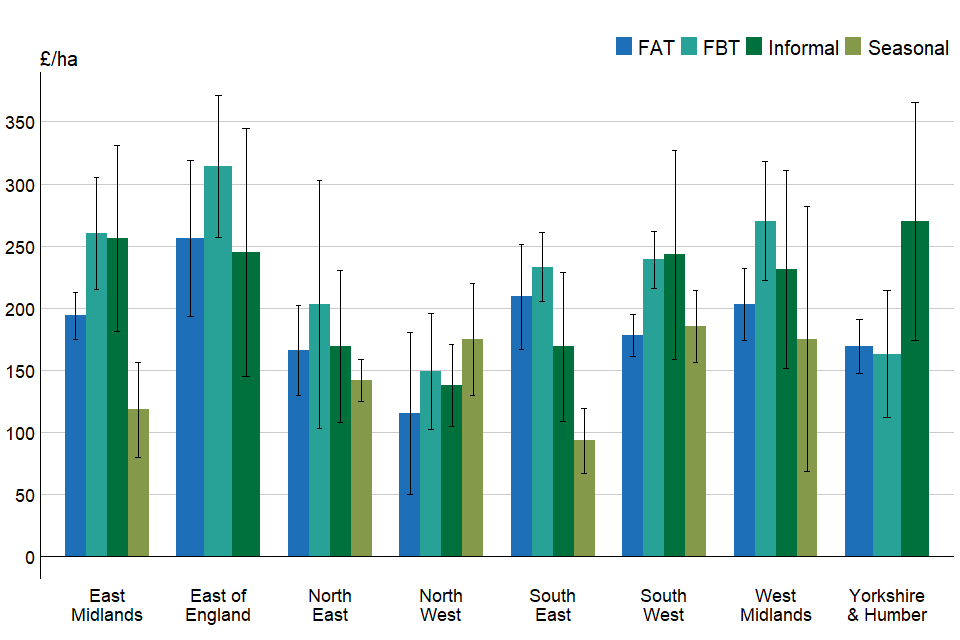
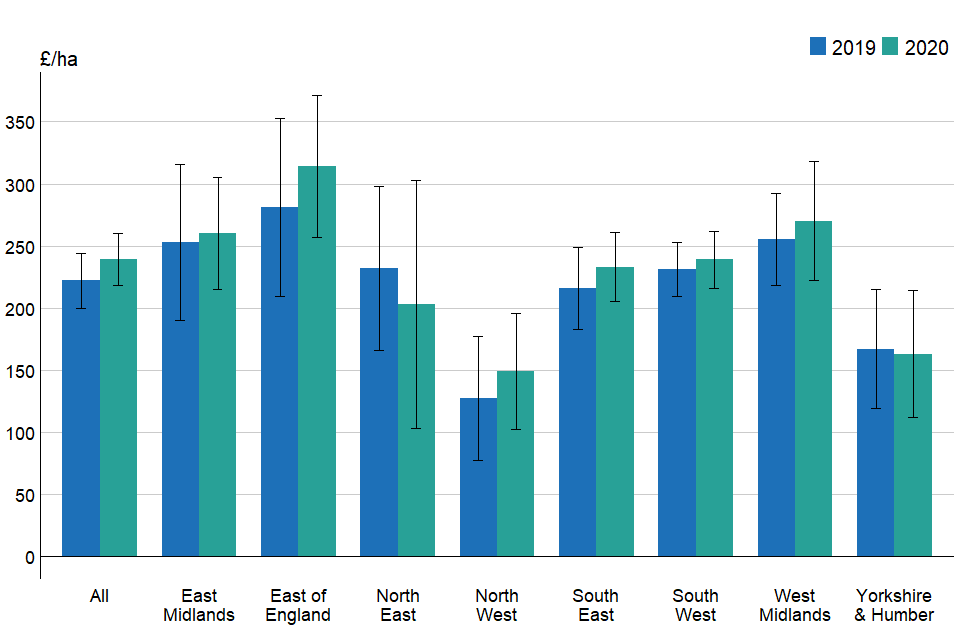
Average rent per hectare tends to be higher for FBTs than for FATs, and to be higher in the East of England and Midlands than in other regions (Figure 1.6). There is considerable variation in rents across agreements. This reflects factors such as the quality of the land and that agreements may be for land only or may also include any combination of dwellings, buildings and other assets.
Figure 1.6 Regional average annual rents by agreement type with 95% confidence intervals 2020 (£/ha)
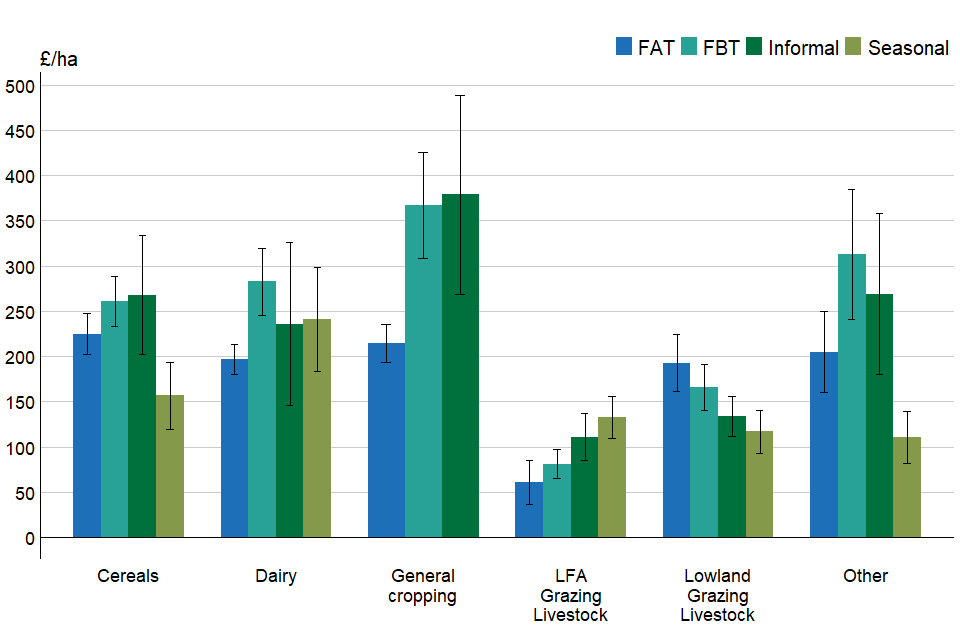
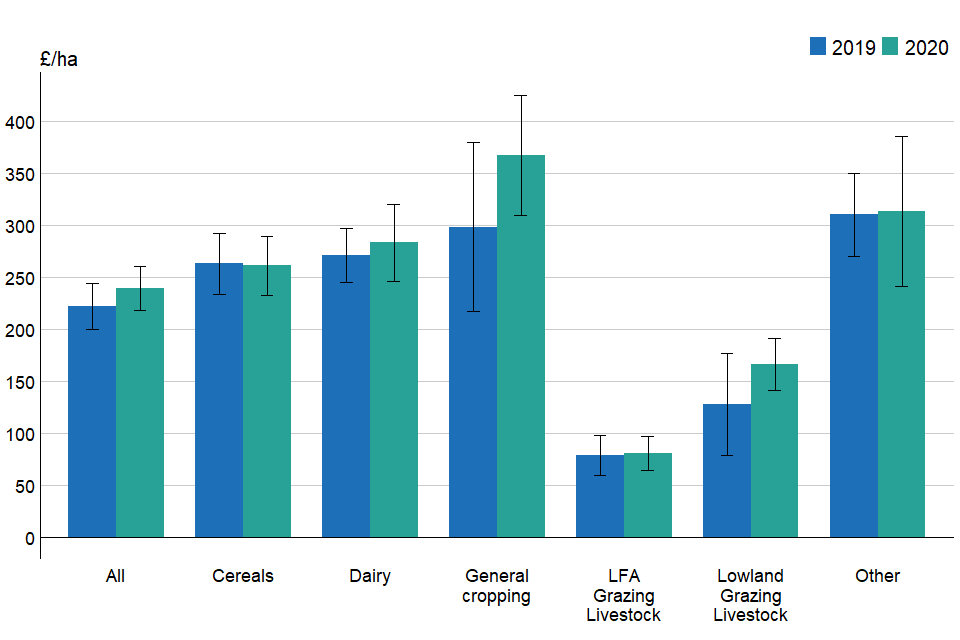
General cropping farms pay the highest rent for FBTs, at £367 per hectare, and for informal agreements at £379 per hectare. Cereal farms have the highest FAT rent, £225 per hectare, and dairy the highest seasonal rent at £241 per hectare (Figure 1.7).
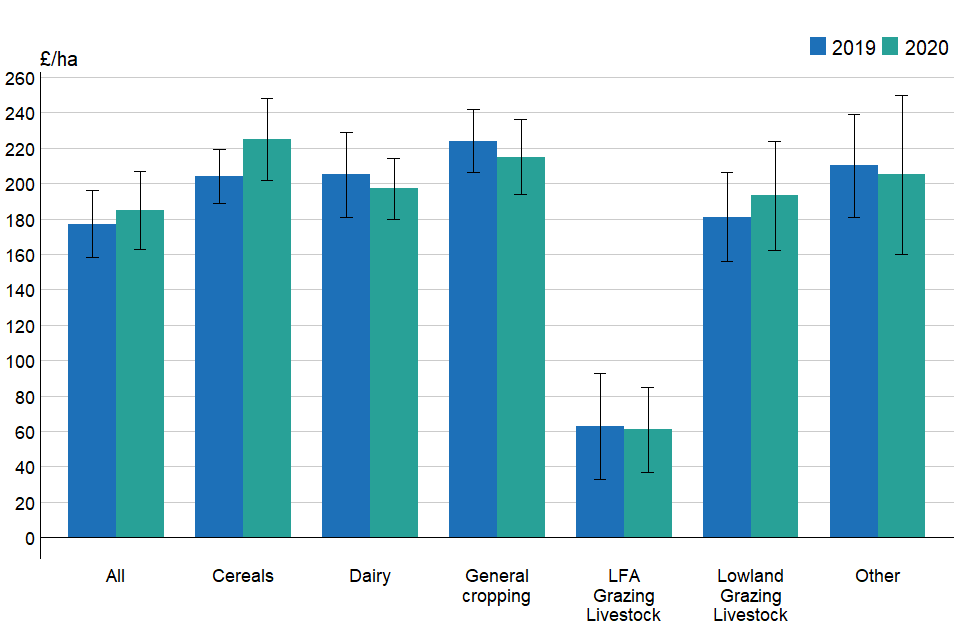
Figure 1.7 Average annual rents by farm type with 95% confidence intervals 2020 (£/ha)
2 Full Agricultural Tenancies
Agricultural tenancies agreed before 1 September 1995 are known as Full Agricultural Tenancies (FATs). These tenancies usually have lifetime security of tenure and those granted before 12 July 1984 also carry statutory succession rights, on death or retirement. The total area of land under these agreements fell by 1% between 2019 and 2020 (Table 2.1) to 1.29 million hectares.
Table 2.1 Total area of rented land under FAT agreements in England by farm type (thousand ha)(a)(b)(c)
| Type | 2018 | 2019 | 2020 | % change 2019 to 2020 |
|---|---|---|---|---|
| Cereals | 443 | 419 | 410 | -2 |
| General Cropping | 186 | 189 | 186 | -2 |
| Dairy | 116 | 111 | 110 | -1 |
| Grazing Livestock (LFA) | 261 | 248 | 246 | -1 |
| Grazing Livestock (lowland) | 160 | 158 | 158 | 0 |
| All farms | 1354 | 1305 | 1288 | -1 |
Source: June Survey of Agriculture
(a) Figures relate to commercial holdings only. Commercial holdings are those with significant levels of farming activities. For further details please see section 3.3 of the June Survey methodology.
(b) LFA = Less Favoured Area.
(c) Figures for ‘All farms’ include values for other farm types (pigs, poultry, horticulture and mixed farms).
Figure 2.1 Average annual rents for FATs (England) (£/ha)(a)
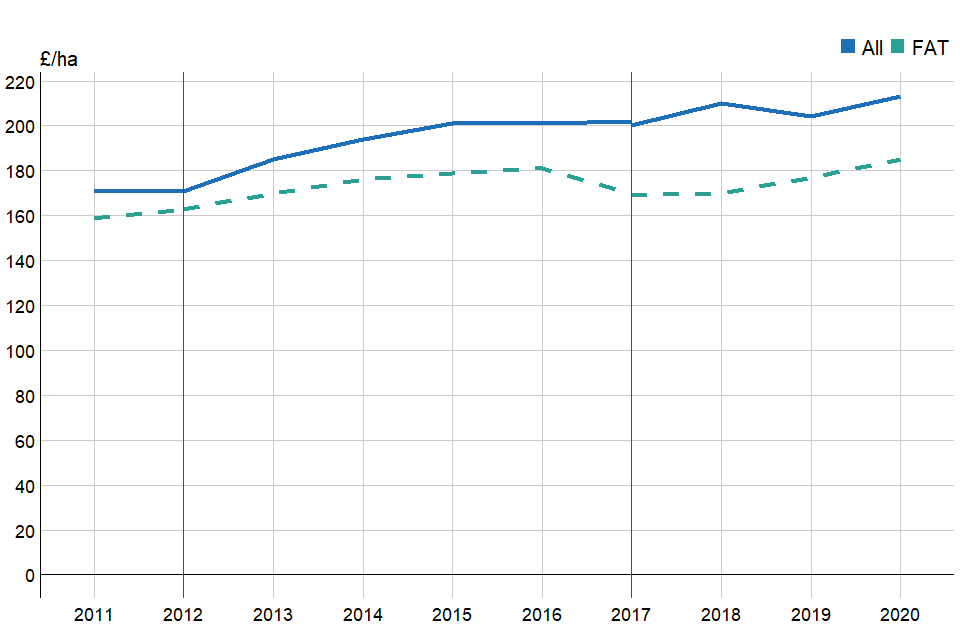
(a) The breaks in the series shown in 2012 and 2017 represent changes in the method used to assign farms to a specific farm type. Where breaks occur, average income has been calculated using both methods for comparability.
The average rent per hectare for land under FAT agreements increased from £177 in 2019 to £185 per hectare in 2020. FAT agreements in the sample have fallen from 516 in 2017 to 490 in 2018, 476 in 2019 and 459 in 2020. This has increased the variability in the dataset and increased the associated confidence intervals.
At farm type level, cereals had the largest increase in average rent per hectare, 10% to £225 (Figure 2.2). Lowland grazing livestock was the only other farm type to see an increase, 7% to £193. All other farm types saw a decrease in rent with the largest change being LFA grazing livestock, with a fall of 4% to £61 per hectare.
Figure 2.2 Average annual rents for FATs (England) 2019 and 2020 by farm type (£/ha)
Averages for “All farms” include other farm types which are not presented here (pigs, poultry, horticulture and mixed farms).
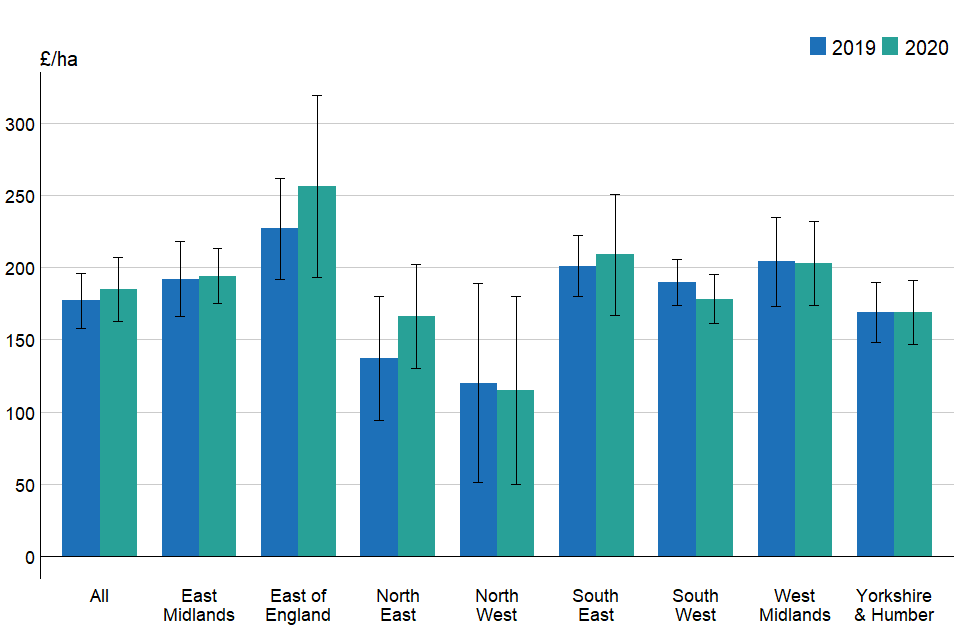
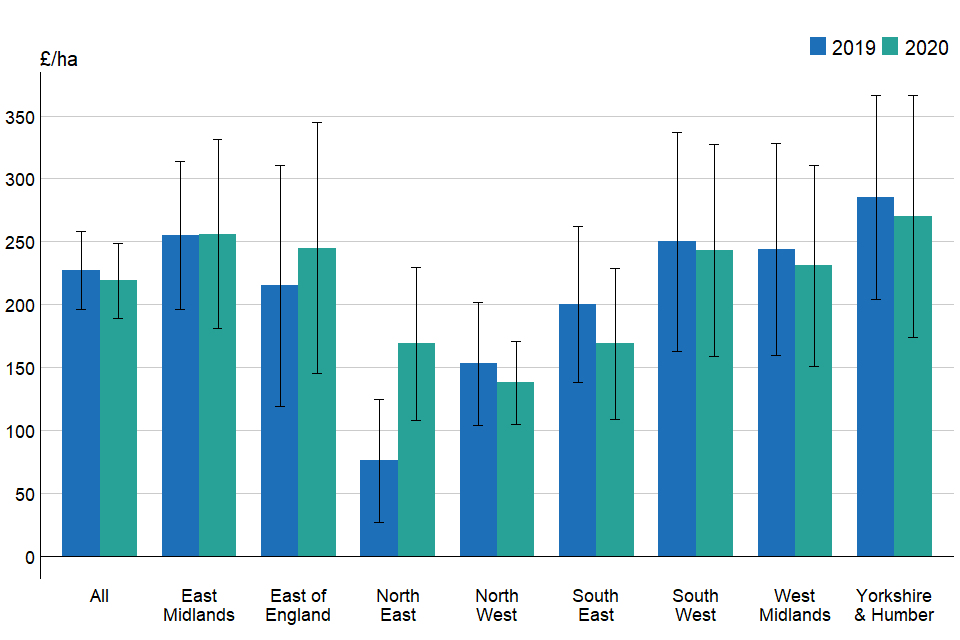
The North East saw the largest increase of rent, 21% to £166 followed by the East of England where the average FAT rent rose by 13% to £256. The South West saw the largest decrease, 6% to £178, with the North West following with 4% fall to £155.
Figure 2.3 Average annual rents for FATs (England) 2019 and 2020 by region (£/ha)(a)
For those agreements with a recorded rent review, the average rent per hectare increased by 6% from £215 to £227 per hectare in 2020 (Table 2.2). Changes to terms and conditions saw the average rent per hectare increase by 10% from £196 to £215 per hectare.
Table 2.2 Average annual rents for FATs with rent reviews and changes to terms and conditions (£/ha)
| Type | 2018 | 2019 | 2020 | % change 2019 to 2020 | 95% Confidence interval 2020 (+/-) |
|---|---|---|---|---|---|
| Agreements with a recorded rent review | 216 | 215 | 227 | 6 | 39 |
| Agreements with recorded change to terms and conditions | 202 | 196 | 215 | 10 | 52 |
| All | 170 | 177 | 185 | 5 | 22 |
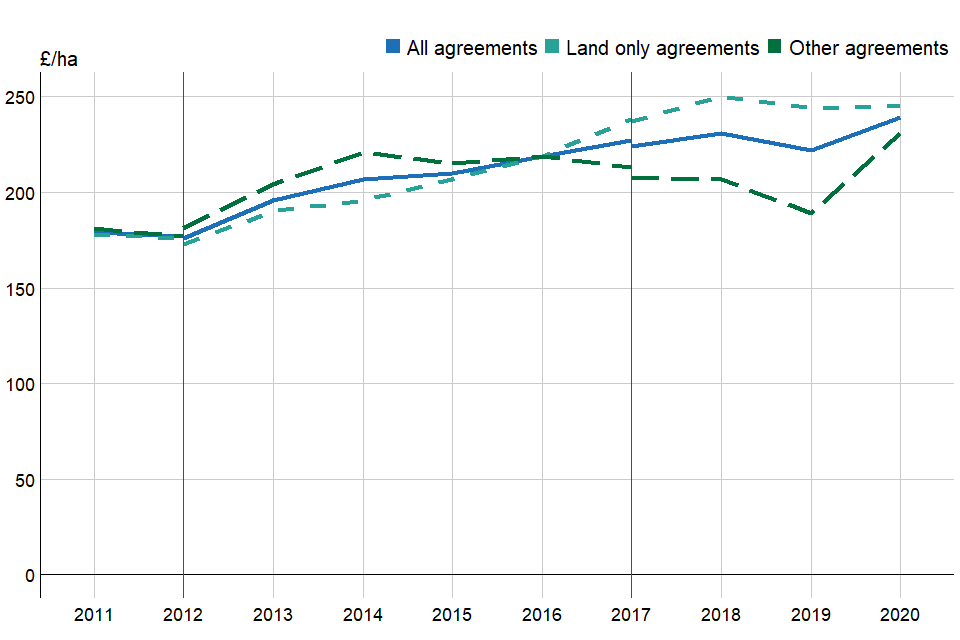
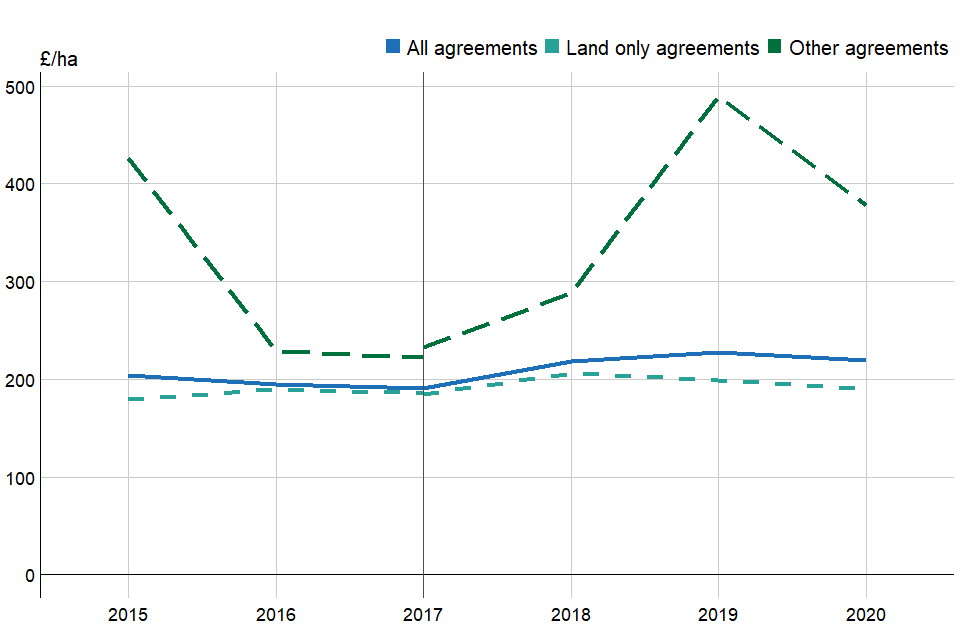
Tenancy agreements may relate to land only or may include any combination of dwellings, buildings and other assets. In 2020, the average rent for FAT agreements relating only to land was £188 per hectare (Table 2.3 and Figure 2.3), a 6% decrease on 2019. The average rent for all other FAT agreements increased by 6% to £184 per hectare.
Table 2.3 Average annual rents for land only and other FAT agreements in England (£/ha)
| Type | 2018 | 2019 | 2020 | % change 2019 to 2020 | 95% Confidence interval 2020 (+/-) |
|---|---|---|---|---|---|
| Land only agreements | 207 | 201 | 188 | -6 | 38 |
| Other agreements(a) | 163 | 173 | 184 | 6 | 24 |
| All | 170 | 177 | 185 | 5 | 22 |
(a) All other FAT agreements here include those agreements covering land and/or any combination of dwellings, buildings and other assets.
Figure 2.4 Average annual rents for land only and other FAT agreements (£/ha)(a)(b)
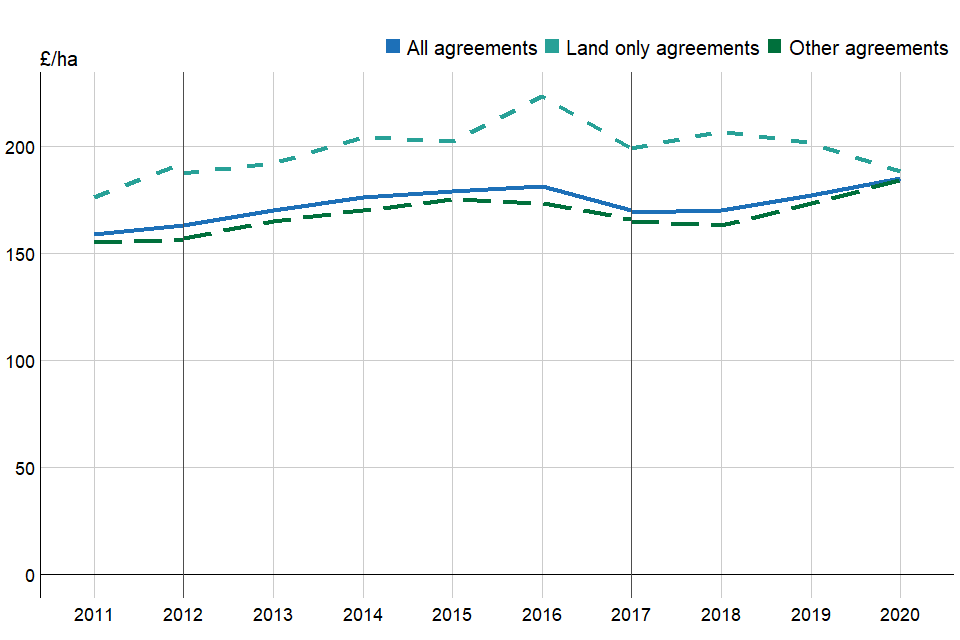
(a) The breaks in the series shown in 2012 and 2017 represent changes in the method used to assign farms to a specific farm type. Where breaks occur, average income has been calculated using both methods for comparability.
(b) Other agreements here include those agreements covering land and/or any combination of dwellings, buildings and other assets.
Tenancy agreements may include Basic Payment Scheme (BPS) entitlements (or Single Payment Scheme (SPS) prior to 2015). There were very few agreements that did not include entitlements within the 2020 sample so these figures should be treated with caution as reflected by the large confidence interval.
Table 2.4 Average annual rents for FAT agreements in England by Basic Payment Scheme entitlement (£/ha)(a)
| Type | 2018 | 2019 | 2020 | % change 2019 to 2020 | 95% Confidence interval 2020 (+/-) |
|---|---|---|---|---|---|
| Agreements excluding BPS entitlements(a) | 477 | 453 | 2119 | 368 | 3815 |
| Agreements including BPS entitlements | 175 | 176 | 182 | 3 | 21 |
| All | 170 | 177 | 185 | 5 | 22 |
(a) 2018, 2019 and 2020 calculation based on small sample.
3 Farm Business Tenancies
Agricultural tenancies agreed since 1st September 1995 under the Agricultural Tenancies Act 1995, are known as Farm Business Tenancies (FBTs).
Until 2014, the Farm Business Survey included similar informal agreements within the definition of FBT agreements. Informal agreements in this context were those based on the same principles as an FBT but without the accompanying legal documentation. In 2015, the classification of agreements was changed to improve the collection and reporting of data. The FBT agreements now reported here for 2015 to 2019 are defined as being written or unwritten for any period subject to the provisions of the Act. This will include formal FBTs that have rolled on informally, but in law are still regarded as FBTs. Informal agreements where there is no formal tenancy agreement but the land is part of the Utilised Agricultural Area (i.e. not seasonally let) are now being separately recorded and reported.
The results presented in this section exclude these informal agreements. Whilst this change has resulted in some reclassification of agreements, it has had a minimal impact on the average FBT results. Including those FBTs now classified as “informal” does not change the average rent per ha in 2015.
The total area of land under these agreements fell by 3% between 2019 and 2020 (Table 3.1) to 1.2 million hectares.
Table 3.1 Total area of rented land under FBT agreements in England by farm type (thousand ha)(a)(b)(c)
| Type | 2018 | 2019 | 2020 | % change 2019 to 2020 |
|---|---|---|---|---|
| Cereals | 379 | 375 | 364 | -3 |
| General Cropping | 175 | 179 | 180 | 1 |
| Dairy | 133 | 133 | 133 | 0 |
| Grazing Livestock (LFA) | 219 | 216 | 202 | -6 |
| Grazing Livestock (lowland) | 187 | 188 | 181 | -4 |
| All farms | 1263 | 1267 | 1233 | -3 |
Source: June Survey of Agriculture
(a) Figures relate to commercial holdings only. Commercial holdings are those with significant levels of farming activities. For further details please see section 3.3 of the June Survey methodology.
(b) LFA = Less Favoured Area.
(c) Figures for ‘All farms’ include values for other farm types (pigs, poultry, horticulture and mixed farms).
The total area of land under these agreements fell by 3% between 2019 and 2020 (Table 3.1) to 1.2M hectares.
Figure 3.1 Average annual rents for FBTs (England) (£/ha)(a)(b)
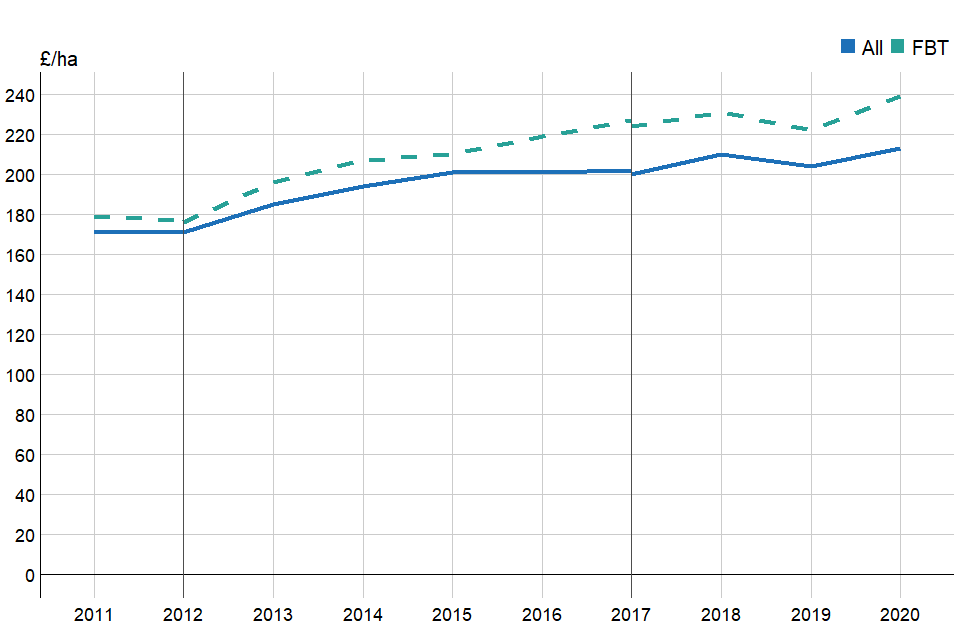
(a) The breaks in the series shown in 2012 and 2017 represent changes in the method used to assign farms to a specific farm type. Where breaks occur, average income has been calculated using both methods for comparability.
(b) Until 2014, FBT included Farm Business Tenancies and similar informal agreements. Informal agreements in this context were those that are based on the same principles as an FBT but without the accompanying legal documentation.
The average annual rent per hectare for FBT agreements increased from £222 in 2019 to £239 per hectare in 2020. Where recorded, the average length of term for FBT agreements was 4 years 11 months (± 10 months).
The only farm type to see a decrease in rent was cereals, which fell by 1% to £261. All other farm types saw an increase in rent with lowland grazing livestock increasing by 30% to £166 and general cropping by 23% to £367. FBT rents for the remaining farm types all rose by less than 10% (Figure 3.2).
Figure 3.2 Average annual rents for FBTs (England) 2019 and 2020 by farm type (£/ha)
Averages for “All farms” include other farm types which are not presented here (pigs, poultry, horticulture and mixed farms).
The North East saw the largest decrease of 13% to £203. Yorkshire & Humber was the only other region to see a decrease in rent, 2% to £163 (Figure 3.3). The largest rise was seen in the North West, where average FBT rent went up by 17% to £149.
Figure 3.3 Average annual rents for FBTs (England) 2019 and 2020 by region (£/ha)
Agreements with a recorded rent review in 2020 saw little change compared to 2019 (Table 3.2). For those agreements with a recorded change to terms and conditions, the average rent per hectare increased by 9% from £214 to £234 per hectare.
Table 3.2 Average annual rents for FBTs with rent reviews and changes to terms and conditions (£/ha)
| Type | 2018 | 2019 | 2020 | % change 2019 to 2020 | 95% Confidence interval 2020 (+-) |
|---|---|---|---|---|---|
| Agreements with a recorded rent review | 243 | 246 | 249 | 1 | 39 |
| Agreements with recorded change to terms and conditions | 202 | 214 | 234 | 9 | 52 |
| All | 231 | 222 | 239 | 8 | 22 |
Tenancy agreements may relate only to land or include any combination of dwellings, buildings and other assets. FBT agreements relating only to land saw no change in rent (Table 3.3 and Figure 3.3). The average rent for all other FBT agreements increased by 22% to £231 per hectare.
Table 3.3 Average annual rents for land only and other FBT agreements in England (£/ha)(a)
| Type | 2018 | 2019 | 2020 | % change 2019 to 2020 | 95% Confidence interval 2020 (+/-) |
|---|---|---|---|---|---|
| Land only agreements | 250 | 244 | 245 | 0 | 38 |
| Other agreements(a) | 207 | 189 | 231 | 22 | 24 |
| All | 231 | 222 | 239 | 8 | 22 |
(a) All other FBT agreements here include those agreements covering land and/or any combination of dwellings, buildings and other assets.
Figure 3.4 Average annual rents for land only and other FBT agreements (£/ha)(a)(b)
(a) The breaks in the series shown in 2012 and 2017 represent changes in the method used to assign farms to a specific farm type. Where breaks occur, average income has been calculated using both methods for comparability.
(b) Other agreements here include those agreements covering land and/or any combination of dwellings, buildings and other assets.
Tenancy agreements may include Basic Payment Scheme (BPS) entitlements, or Single Payment Scheme (SPS) prior to 2015. The average rent for FBT agreements including SPS/BPS entitlements increased by 10% in 2020 to £238 per hectare (Table 3.4). The rent for agreements excluding SPS/BPS entitlements decreased by 7% to £249 per hectare. However, it should be noted that there is considerable variability in this data and the confidence intervals for this result are relatively wide (± £43 per hectare in 2020).
Table 3.4 Average annual rents for FBT agreements in England by Basic Payment Scheme entitlement (£/ha)
| Type | 2018 | 2019 | 2020 | % change 2019 to 2020 | 95% Confidence interval 2020 (+/-) |
|---|---|---|---|---|---|
| Agreements excluding BPS entitlements | 279 | 267 | 249 | -7 | 43 |
| Agreements including BPS entitlements | 230 | 217 | 238 | 10 | 23 |
| All | 231 | 222 | 239 | 8 | 21 |
4 Seasonal Agreements
Seasonal agreements may be for any length of term less than 12 months. These include licenses for grazing and/or mowing only and may include BPS entitlements (or SPS until 2014). As noted in the previous section, there were changes to the way in which agreement types were classified within the Farm Business Survey in 2015.
This resulted in some seasonal agreements being reclassified as “informal agreements”. Results for 2015 have previously been calculated based on both the 2014 and 2015 agreement classifications to provide comparable results. In practice, the averages calculated in this way are similar and well within the annual confidence intervals.
In 2020, seasonal average annual rent increased by only 1% to £150. The average length of term for seasonal agreements was 9 months (± 1 month) (Figure 4.1).
Figure 4.1 Average annual rents for seasonal agreements (England) (£/ha)(a)
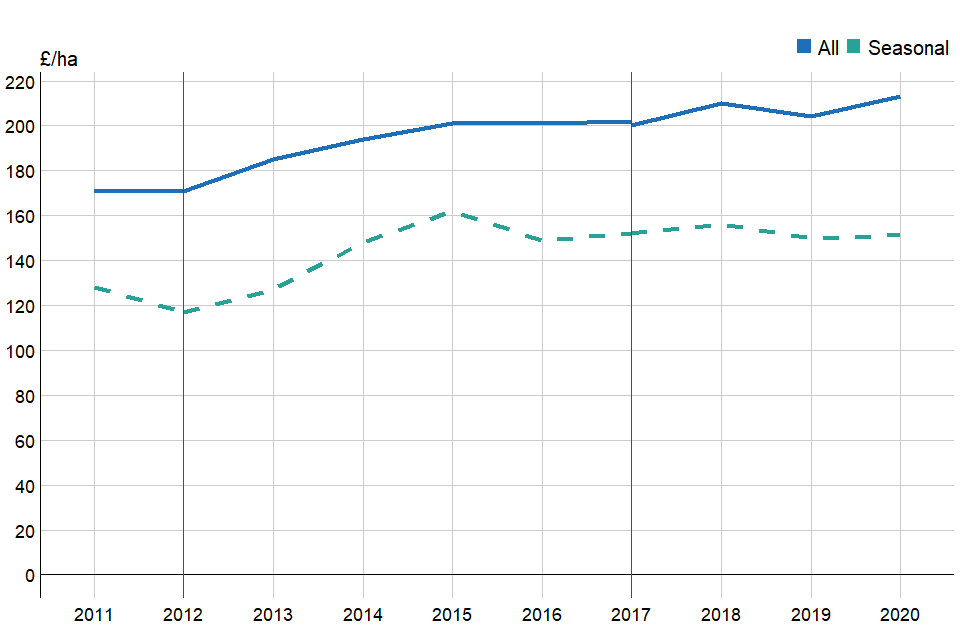
(a) The breaks in the series shown in 2012 and 2017 represent changes in the method used to assign farms to a specific farm type. Where breaks occur, average income has been calculated using both methods for comparability.
The only farm type to see a decrease in rent was lowland grazing livestock, 3% to £117 (Figure 4.2). Cereals increased by 23% to £157 while all other farm types saw an increase of less than 10%.
Figure 4.2 Average annual rents for seasonal agreements by farm type (England) 2019 and 2020 (£/ha)(a)
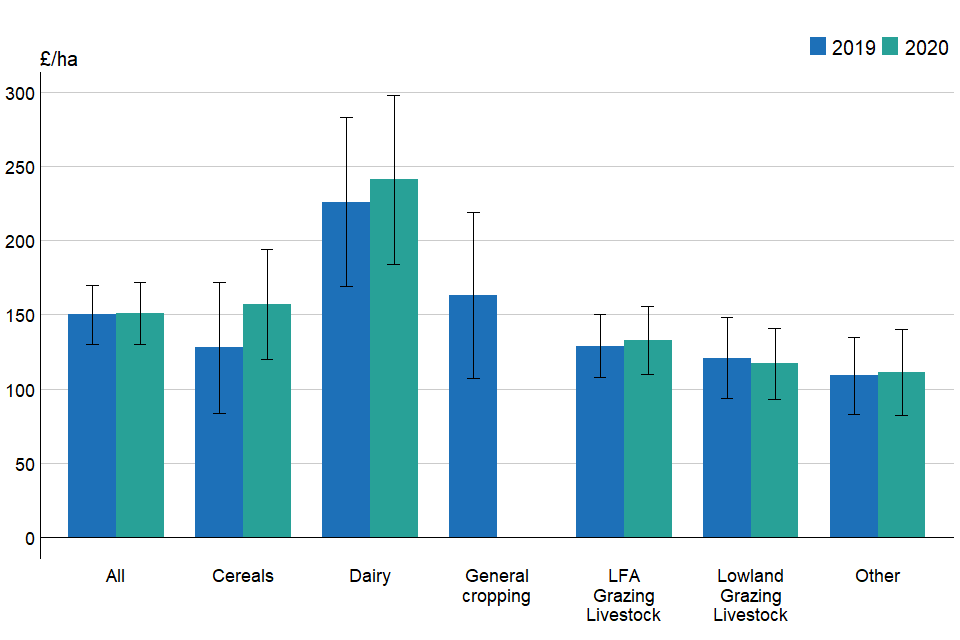
(a) In 2019 general cropping was calculated from a small sample, and in 2020 there were too few farms in the sample to calculate an estimate.
Averages for “All farms” include other farm types which are not presented here (pigs, poultry, horticulture and mixed farms).
The only regions to see an increase to this type of rent were the South West, which experienced a 6% rise to £185, and the North East where rents rose by 4% to £142. The West Midlands saw the largest decrease of 17% to £175, all other regions saw a fall of less than 10% (Figure 4.3).
Figure 4.3 Average annual rents for seasonal agreements (England) 2019 and 2020 by region (£/ha)(a)
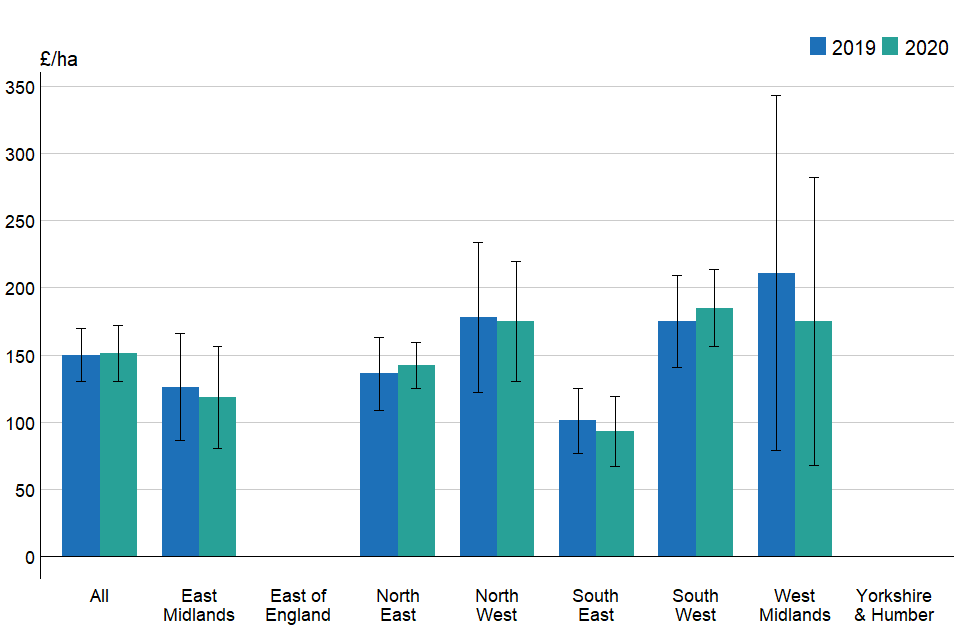
(a) East of England and Yorkshire & Humber unable to calculate due to too few samples.
The average rent for those seasonal agreements including SPS/BPS entitlements decreased by 20% to £135 per hectare (Table 4.1) while the rent for agreements excluding SPS/BPS entitlements increased by 4% to £153 per hectare.
Table 4.1 Average annual rents for seasonal agreements in England by Basic Payment Scheme entitlement (£/ha)
| Type | 2018 | 2019 | 2020 | % change 2019 to 2020 | 95% Confidence interval 2020 (+/-) |
|---|---|---|---|---|---|
| Agreements excluding BPS entitlements | 156 | 147 | 153 | 4 | 22 |
| Agreements including BPS entitlements | 140 | 169 | 135 | -20 | 68 |
| All | 156 | 150 | 151 | 1 | 21 |
5 Informal Agreements
In 2015, there was an improvement to the way in which tenancy agreements were classified in the Farm Business Survey. A new category of “informal agreements” was introduced. These informal agreements are those where there is no formal tenancy agreement but the land is part of the Utilised Agricultural Area (i.e. not seasonally let). This resulted in the reclassification of a number of agreements.
In 2020, the average rent per hectare for informal agreements was £219 per hectare, 4% lower than in 2019 (Figure 5.1). The average length of term for informal agreements was 1 year and 2 months (±2 months).
Figure 5.1 Average annual rents for informal agreements (England) (£/ha)(a)
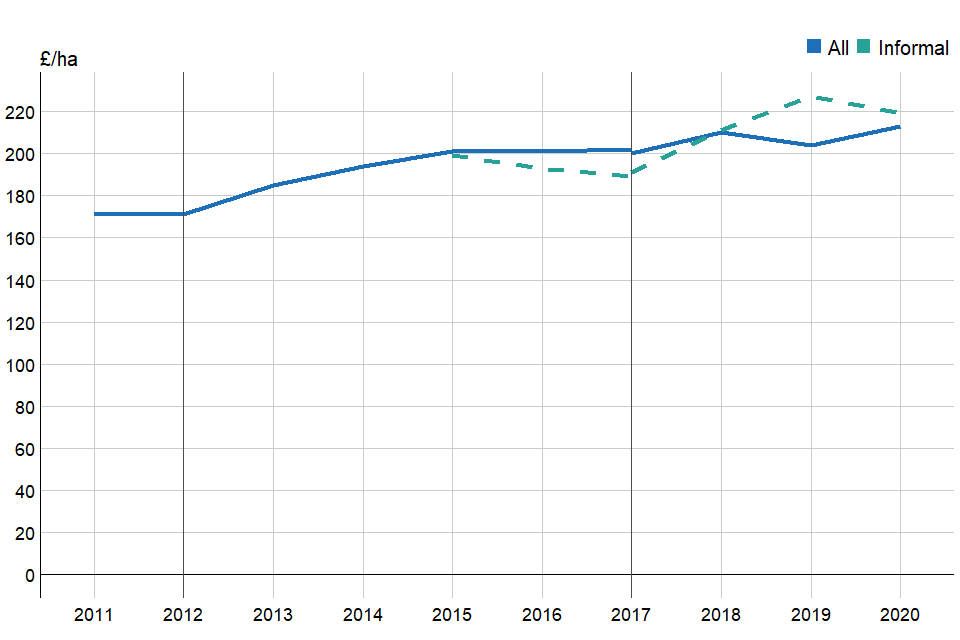
(a) The breaks in the series shown in 2012 and 2017 represent changes in the method used to assign farms to a specific farm type. Where breaks occur, average income has been calculated using both methods for comparability.
Across all farm types rent for informal agreements reduced by 4%. The horticulture, mixed, pigs and poultry farm types (Other on Figure 5.2), saw a decrease of 14% to £269 while lowland grazing livestock rose by 16% to £134
Figure 5.2 Average annual rents for informal agreements by farm type (England) 2019 and 2020 (£/ha)
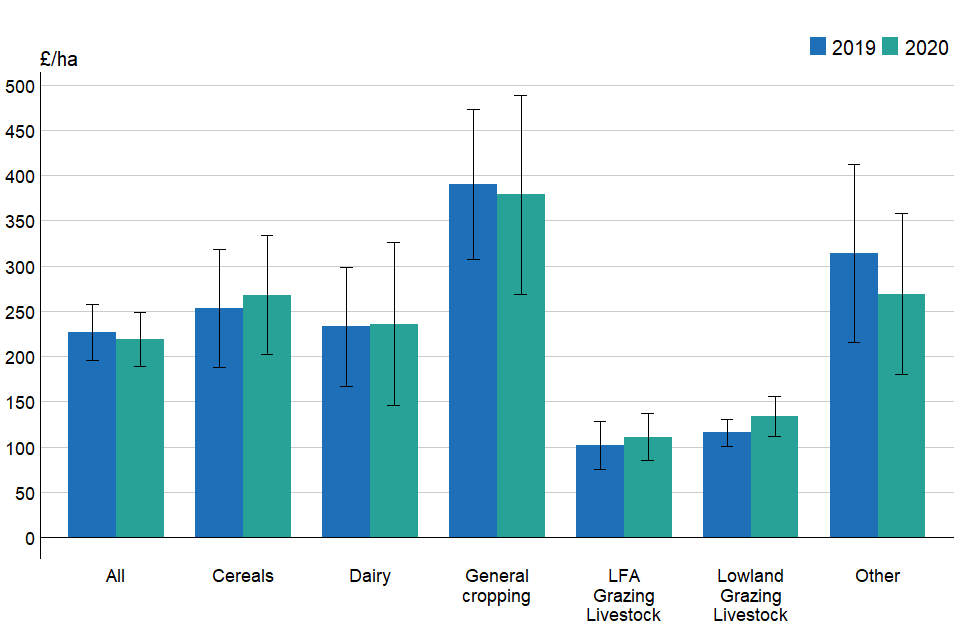
Averages for “All farms” include other farm types which are not presented here (pigs, poultry, horticulture and mixed farms).
The regional results show the largest increase taking place in the North East which saw rent for informal agreements more than double, 122% to £169. The South East saw the largest decrease of 16% to £169, all other regions also saw a decrease except East Midlands which was virtually unchanged on 2019.
Figure 5.3 Average annual rents for informal agreements (England) 2019 and 2020 by region (£/ha)
The average rent for those informal agreements relating only to land decreased by 5% to £190 per hectare (Table 5.1 and Figure 5.4). The average rent for all other informal agreements decreased by 23% to £378 per hectare.
Table 5.1 Average annual rents for land only and other informal agreements in England (£/ha)(a)
| Type | 2018 | 2019 | 2020 | % change 2019 to 2020 | 95% Confidence interval 2020 (+/-) |
|---|---|---|---|---|---|
| Land only agreements | 206 | 199 | 190 | -5 | 26 |
| Other agreements(a) | 288 | 489 | 378 | -23 | 129 |
| All | 218 | 227 | 219 | -4 | 30 |
(a) All other informal agreements here include those agreements covering land and/or any combination of dwellings, buildings and other assets.
Figure 5.4 Average annual rents for land only and other informal agreements (£/ha)(a)(b)
(a) The break at 2017 represents changes in the method used to assign farms to a specific farm type. Where breaks occur, average income has been calculated using both methods for comparability.
(b) Other agreements here include those agreements covering land and/or any combination of dwellings, buildings and other assets.
The average rent for informal agreements including SPS/BPS entitlements decreased by 4% to £188 per hectare while for those excluding SPS/BPS entitlements it decreased by 37% to £153 per hectare.
Table 5.2 Average annual rents for informal agreements in England by Basic Payment Scheme entitlement (£/ha)
| Type | 2018 | 2019 | 2020 | % change 2019 to 2020 | 95% Confidence interval 2020 (+/-) |
|---|---|---|---|---|---|
| Agreements excluding BPS entitlements | 253 | 244 | 237 | -3 | 42 |
| Agreements including BPS entitlements | 169 | 196 | 188 | -4 | 32 |
| All | 218 | 227 | 219 | -4 | 30 |
6 What you need to know about this release
6.1 Contact details
Responsible statistician: Mark Kirby Email: fbs.queries@defra.gov.uk
6.2 National Statistics Status
National Statistics status means that our statistics meet the highest standards of trustworthiness, quality and public value, and it is our responsibility to maintain compliance with these standards.
These statistics last underwent a full assessment [Assessment Report 271 Statistics on Agriculture] against the Code of Practice for Statistics in 2014. Since the last review by the Office for Statistics Regulation, we have continued to comply with the Code of Practice for Statistics across the FBS. For general enquiries about National Statistics, contact the National Statistics Public Enquiry Service:
Tel: 0845 601 3034 Email: info@statistics.gov.uk Find out about call charges
You can find National Statistics on the internet on the Gov.uk website.
6.3 Key words
Full Agricultural Tenancy: Agricultural tenancies agreed before 1 September 1995 are known as Full Agricultural Tenancies (FATs). These tenancies usually have lifetime security of tenure and those granted before 12 July 1984 also carry statutory succession rights, on death or retirement.
Farm Business Tenancy: A tenancy is a Farm Business Tenancy if at least part of the tenanted land is farmed throughout the life of the tenancy. The tenancy must also meet one of these 2 conditions:
- if the tenancy is primarily agricultural to start with, the landlord and tenant can exchange notices before the tenancy begins confirming they intend it to remain a Farm Business Tenancy throughout. This lets tenants diversify away from agriculture where the terms of the tenancy agreement allow this
- if the landlord and tenant don’t exchange notices before the tenancy begins, the tenancy business must be primarily agricultural to be considered a Farm Business Tenancy
Seasonal agreements: Agreements of less than 12 months.
Informal agreements: Are those where there is no formal tenancy agreement but the land is part of the Utilised Agricultural Area (i.e. not seasonally let)
7 Technical note
7.1 Survey coverage and weighting
Results show the average amount of rent paid per hectare per year. They cover a wide range of rental agreements including those that are land only and those that include dwellings, farm buildings and other assets. To give an indication of the difference in rents, results have also been produced to show average values for land only agreements (see Tables 4 and 8).
The Farm Business Survey (FBS) is an annual survey providing information on the financial position and physical and economic performance of commercial farm businesses in England. It covers all types of farming in all regions of the country and includes owner-occupied, tenanted and mixed tenure farms. The FBS only includes farm businesses with a Standard Output of at least €25,000, based on activity recorded in the previous June Survey of Agriculture and Horticulture.
In 2020, this accounted for approximately 56,048 farm businesses. In 2016 the sample was reduced from 1800 to 1750 farm businesses. In 2019 and 2020 the samples were slightly smaller as a result of Covid-19 restrictions on data collection. Data are collected by face to face interviews with farmers, conducted by highly trained researchers.
Each record is given a weight to make the sample representative of the population. Initial weights are applied to the FBS records based on the inverse sampling fraction. These weights are then adjusted by calibrating certain totals to match published totals from other surveys so that they can be used to produce unbiased estimators of a number of different target variables. More detailed information about the Farm Business Survey and the data collected can be found at: https://www.gov.uk/farm-business-survey-technical-notes-and-guidance
7.2 Accuracy and reliability of the results
As a guide to the accuracy of the results, we have included the 95% confidence intervals for all the latest rents shown in the tables. For example, the survey results show that the average annual rent for all land under Full Agricultural Tenancies is £177 per hectare for 2019 with a 95% confidence interval of ± £32 per hectare. This means that we can be 95% confident that the range £145 - £209 per hectare contains the actual population average rent for all land under FATs.
Confidence limits are based on the standard errors multiplied by 1.96 to give the 95% confidence interval. The standard errors only give an indication of the sampling error. They do not reflect any other sources of survey errors, such as non-response bias and interviewer errors.
It should be noted that the confidence intervals are higher for the regional estimates compared to those for the published farm types. This is because the regional estimates include all farm types including pig, poultry and horticultural farms for which rents tend to be more variable.
Percentage changes shown within this release are based on unrounded figures. Totals may not necessarily agree with the sum of their components due to rounding.