Exploration of an alternative approach to calculating stop and search rates in the Metropolitan Police Force Area – Experimental Statistics
Updated 18 November 2021
Applies to England and Wales

© Crown copyright 2021
This publication is licensed under the terms of the Open Government Licence v3.0 except where otherwise stated. To view this licence, visit nationalarchives.gov.uk/doc/open-government-licence/version/3 or write to the Information Policy Team, The National Archives, Kew, London TW9 4DU, or email: psi@nationalarchives.gov.uk.
Where we have identified any third party copyright information you will need to obtain permission from the copyright holders concerned.
This publication is available at https://www.gov.uk/government/statistics/exploration-of-an-alternative-approach-to-calculating-stop-and-search-rates-in-the-metropolitan-police-force-area-experimental-statistics/exploration-of-an-alternative-approach-to-calculating-stop-and-search-rates-in-the-metropolitan-police-force-area-experimental-statistics
1. Background
In the financial year ending March 2021, the statistical return from forces to the Home Office was based for the first time on incident-level stop and search data, meaning the Home Office received one row of data per stop and search. Previously, only aggregate-level (tabulated) information had been collected, which limited the type of analysis that was possible. Now for the first time, the Home Office has information about each stop and search that has been conducted, including new information on the age and gender of a person searched, details on whether a weapon was found, date and time information and the precise geographic location (using X-Y coordinates) of where the stop was recorded. Previously, Home Office stop and search data did not include geographic location below Police Force Area (PFA) level[footnote 1]. The additional data enable more in-depth analyses of stop and search and have allowed us to explore alternative approaches to calculating area-based stop and search rates, including differences in rates for sub-groups of the population. Each stop and search record also includes the outcome of a search and whether the outcome was linked to the search, previously these data were collected separately in aggregate form under what was known as Best Use of Stop and Search (BUSS).
The analysis in this report has been designated as Experimental Statistics. Experimental Statistics are Official Statistics undergoing development. Work is underway to improve the police-recorded ethnicity data used in this analysis and the methodology used to calculate stop and search rates and as part of this we invite users to provide feedback on the analysis presented in this report to aid the development work. Users can contact Home Office statisticians at crimeandpolicestats@homeoffice.gov.uk. More information about Experimental Statistics can be found on the UK Statistics Authority website.
In line with the Code of Practice for Statistics, the analysis in this report has been quality assured by Home Office analysts and peer reviewed by independent academics and stakeholders.
Each stop and search encounter must have a basis in law. The officer carrying out the stop and search must only do so using one of the powers provided for in legislation and it must be the right power in the particular circumstances. The most widely used powers, such as section 1 of the Police and Criminal Evidence (PACE) Act 1984 and associated legislation[footnote 2] require the officer to have reasonable grounds for suspicion.
Section 60 of the Criminal Justice and Public Order Act (CJPOA) 1994 enables officers to conduct ‘no suspicion’ stop and searches for dangerous instruments or offensive weapons for a limited time within a specified area, in anticipation of violence occurring in that area. This will often follow a major incident or from intelligence gathered by the police.
2. Summary
Traditional methods used in the ‘Police power and procedures’ statistical release for calculating rates of stop and search are based on ONS 2011 Census population estimates and are at PFA level only. As discussed in the main bulletin published alongside this report, there are limitations in considering rates of searches in this way, particularly due to the often localised nature of stop and search and the difference in the demographics of the population both across England and Wales and within individual PFAs (such as more ethnically diverse populations in metropolitan districts[footnote 3] and younger age groups).
The analysis in this report examines stop and search rates in the Metropolitan Police Service (MPS) for the year ending March 2021 and presents this in the following new ways:
- stop and search rates using more up-to-date resident population denominators (i.e. using 2020 Greater London Authority projected estimates rather than 2011 Census estimates)
- stop and search rates using an alternative denominator to the traditional resident based estimates – namely suspects of police-recorded violent crime (referred to as Suspect-Adjusted Disparity)
- borough level analysis (which has not previously been possible as Home Office stop and search data was not available below Police Force Area level) - this has been done for both approaches outlined above
It is important to note that this was an atypical year for both crime and stop and search because of the COVID-19 pandemic. Several police-recorded crime types, such as theft and robbery saw falls in the year ending March 2021 (down 32% and 34% respectively from the year ending March 2020)[footnote 4]. Possession of drug offences on the other hand increased compared with the previous year (up 12%).
All stop and search increased by 22% in the same year; section 1 searches increased, (up 24% from 559,201 to 695,009), while section 60 searches decreased (down 49% from 18,043 to 9,230)[footnote 5]. Some forces reported that a reduction in demand for other calls to service, such as response to crime[footnote 6], in parts of the year ending March 2021 in which there were restrictions imposed due to the COVID-19 pandemic, gave increased capacity for proactive policing. The majority of forces (39 out of 43) reported rises in stop and search under section 1 PACE with the MPS accounting for 32% of the overall increase in section 1 stop and searches. The MPS’ stop and search dashboard[footnote 7] shows that there was a particularly large increase in stop and search in May 2020, at the beginning of the first national lockdown.
Stop and search rates at National and even Police Force Area level mask variation at lower geographies. This is because stop and search takes place in localised areas and also because resident populations vary at lower geographies. For example, White people make up the biggest proportion of the population in Richmond upon Thames (84%), this is in comparison to areas such as Newham where White people account for 26% of the total resident population.
Using resident population estimates has previously drawn criticism because these differences in resident population can result in large disparities despite low volumes of stop and search in the same areas. Furthermore, the 2011 Census statistics likely no longer reflect the current population and the resident population does not take into account the moving population when it is known that those stopped and searched do not necessarily live in the area that they are stopped. To account for these factors, an alternative method of producing stop and search rates is to use suspects of (selected) police-recorded violent crimes. The rationale for this builds upon the Risk-Adjusted Disparity Index[footnote 8] which has been developed by Cambridge University which posits that the likelihood of someone being stopped and searched should be proportionate to their likelihood of them being a victim of serious violent crime. The analysis presented in this paper instead uses suspects of violent, as using victims of violent crime assumes that perpetrators and victims share the same ethnicity.
2.1 Key findings
Rates:
Stop and search rates[footnote 9] varied considerably between boroughs: Westminster had the highest stop and search rate at 67.8 stops per 1,000 people and Barnet had the lowest at 11.9 stops per 1,000 people. These differ significantly from the average stop and search rate for the MPS which was 33.7 stops per 1,000 people.
Disparity ratios:
Overall, disparity ratios (i.e. the likelihood of being stop and searched compared to the White group) using resident population estimates were slightly lower when using 2020 GLA estimates compared with 2011 Census estimates, although the difference was more significant at borough level. For the MPS: Black people were 3.7 times more likely to be stopped and searched compared with White people (compared with 4.0 using 2011 Census estimates) and for Asian people it was 1.3 times as likely (compared with 1.6 using 2011 Census estimates).
Disparity ratios using the Suspect-Adjusted Disparity method reduced disparity for Black people compared with the traditional method, falling from 3.7 to 1.2. This pattern was seen across all boroughs. For the Asian group, disparity increased slightly using this method, from 1.3 to 1.7 although the picture was mixed at borough level, with some boroughs seeing decreases. Whilst disparities narrowed using this method for Black people, they still remain, the implications of which will still likely impact confidence in policing.
3. Introduction
While the ‘Police Powers and Procedures’ statistical bulletin[footnote 10] continues to present analysis of stop and search rates by ethnicity using 2011 Census-based resident population counts, the analysis in this report presents an alternative method for calculating these rates based on the profile of suspects of (selected) violent crimes recorded by the police in a particular locality. This new analysis is part of the ongoing development and improvement of stop and search statistics, in line with the Value of the Code of Practice (CoP) for Statistics. While other approaches have not been explored as part of this analysis, potential future analysis could explore using different denominators (e.g. different crime types, using a daytime population) and investigate confounding factors such as deprivation, crime and police resources. We discuss these in the context of improvements for future analysis in the Conclusion of this report.
The analysis presented in this report focusses on data provided by the Metropolitan Police Service (MPS) as they provided good quality geo-coded data and account for a large proportion of all stop and searches taking place in England and Wales in the year ending March 2021 (44%).
Whole London boroughs (i.e. single local authority areas) have been used as the geographical unit of interest. One reason for this was to help the user more easily interpret differences. Lower-level geographies were considered, however, given that stop and searches are concentrated in very local areas, for the vast majority of areas at lower geographies numbers of stop and searches were too small to give meaningful insight. The ambition is to carry out future analysis focussing on these lower geographies when data for multiple years can be combined. Around 11% of stop and search records for the MPS did not have x and y co-ordinates assigned to them, which meant that the borough in which the searches took place could not be determined. These have been included in the calculations for total stop and search rates. The level of missing coordinates was similar for each ethnic group. The findings from the analysis in this report should therefore be interpreted with caution as it is not known how this would have affected the distributions at borough level.
Lastly, comparisons have only been made between the Black and Asian groups and White groups. This is because suspects of violent crime numbers were too small for the Other group to make meaningful comparisons. This limits the ability to make comparisons with other methods of calculating stop and search rates (see Limitations and Strengths).
This report presents the following new information:
-
Stop and search rates using resident populations estimates at borough level for the Metropolitan Police Service (MPS) - previously Home Office stop and search data were only available at Police Force Area – calculated using 2020 Greater London Authority projection estimates
-
Stop and search rates using suspects of police-recorded violent crime as the denominator at borough level for the MPS
The report outlines the strengths and limitations of the two approaches as well as discussing alternative options and makes suggestions for improving data quality.
3.1 Current method used for calculating stop and search rates
The new incident-level data collection (where data are received for every stop and search incident), as well as the additional information received on the age and gender of those searched, has allowed analysts to consider new methods for calculating disparity rates between stop and searches of those from a Black, Asian or other minority ethnic background compared with White people. The ‘Police Powers and Procedures’ statistical bulletin for the year ending March 2021 therefore presents the following disparity rates:
Raw disparity: the traditional method based on self-defined ethnicity of people stopped and searched and the number of people within that ethnic group in the overall population (based on the 2011 Census - see Nomis website). Rates based on this measure are available for the year ending March 2011 through to the year ending March 2021.
Raw disparity+: the same as above, but the officer-defined ethnicity of the person stopped and searched is used if their self-defined ethnicity was not stated. This approach is designed to reduce uncertainty in estimates based solely on self-defined ethnicity, due to missing data. Rates based on this measure are available for the latest year only as they rely on record-level data which were collected for the first time in the year-ending March 2021. Stop and search rates using resident population denominators presented in this report are based on this method, unless specified otherwise. It is acknowledged that whilst combining self-defined and officer-defined ethnicity helps to reduce missing data, some detail is lost related to the Mixed ethnic group which is included as a category in the self-defined classification but is not available using the officer-defined classification. In the MPS, people belonging to the Mixed ethnicity group account for 4.5% of all stop and searches (excluding vehicle searches and searches where the ethnicity was not known).
Age and gender adjusted disparity: An expanded version of raw disparity+, in which the stop and search and population data is split by age and gender, as well as ethnicity. Rates based on this measure are available for the latest year only.
For comparability with previous years, the main measure used in the ‘Police Powers and Procedures’ bulletin continues to be the ‘raw disparity’, where rates are calculated based on the self-defined ethnicity of those searched and the Census 2011 population estimates.
There are several known limitations to using this approach to assess the use of stop and search on different sub-groups of the population:
-
Stop and search is not applied at random (officers must have reasonable grounds for suspicion) and therefore it is not evenly spread across the population. It is typically used in areas of higher deprivation or crime. The Race Disparity Unit (RDU) refer to this in their research on the effects of geographical differences on stop and search ratios[footnote 11].
-
The Census statistics are based on residents in an area (the static population), whereas powers of stop and search can be used on anyone in public spaces in that area irrespective of where they reside (i.e. the moving population). This can particularly be an issue for those areas that experience high in-flows of non-residents (e.g. commuters, tourists and visitors associated with the night-time economy). Analysis published by the NPCC which examined disproportionality in the issuing of COVID fixed penalty notices (FPNs), showed that taking into account the area that someone lives compared to where they were fined, generally reduced disproportionality[footnote 12].
-
There will have been changes to the population size and composition since the 2011 Census which will have had greater impacts on some areas than others and therefore the distribution across ethnicities may no longer be accurately reflected in these statistics.
-
Additionally, prior to this year, stop and search rates have generally been presented at a national level which masks variation at lower geographies. For example, (using 2011 Census estimates) stop and search disparity ratios for the year ending March 2021 showed that Black people were 8.7 times more likely to be stopped and searched than White people in England and Wales, however this was lower for just the MPS (4.0).
-
New analysis in the ‘Police Powers and Procedures’ bulletin shows that Stop and search is concentrated on a relatively narrow age range, predominantly men aged 15-34 (who accounted for 70% of all searches in England Wales in the year to March 2021); population age structures differ by ethnicity (for example, in the MPS young White men aged 15-34 are in the minority[footnote 13]) and disproportionality differs by gender.
One of the key headline statistics presented in the annual ‘Police Powers and Procedures’ bulletin relates to relative differences in stop and search rates by ethnic group. Currently, a stop and search rate per 1,000 population is calculated for one ethnic group by dividing the number of searches of people within that ethnic group by the resident population of that ethnic group, using the formula below:
(No. of stop and searches in group X ÷Total population in group X) * 1,000 = rate per 1,000 people
This is repeated to calculate a similar rate for a comparator ethnic group (usually the White group). One rate is divided by the other to calculate a ratio and assess the likelihood for a stop in one group compared with another group.
In summary, the steps are:
-
Calculate S&S rate per 1,000 population for Group X = A e.g. total volume of stop and searches of Black people in the MPS for the year ending March 2021 was 106,996. The 2011 Census estimate for the Black population in the MPS was 1,088,447. Dividing one by the other gives 0.098 (3dp) and multiplied by 1,000 gives a rate of 98.3 searches per 1,000 Black people
-
Calculate S&S rate per 1,000 population for comparison Group Y = B e.g. total volume of stop and searches of White people in the MPS for the year ending March 2021 was 119,870. The 2011 Census estimate for the White population in the MPS was 4,881,636. Dividing one by the other gives 0.025 (3dp) and multiplied by 1,000 gives a rate of 24.6 searches per 1,000 White people
-
Divide A by B to calculate the Ratio = A/B = C e.g. divide 98.3 by 24.6 gives a disparity ratio of 4.0, i.e. Black people are stopped and searched 4 times as much as White people in the Metropolitan Police Service area.
3.2 An alternative approach: Using suspects of police-recorded (selected) violent crime as the denominator
Using the resident-based population estimates as the denominator when calculating stop and search rates gives one measure of how these powers are used, but is subject to some limitations, as described above. Other denominators can address some of these limitations and provide additional information on how stop and search is used.
One approach is the Risk-Adjusted Disparity (RAD) Index[footnote 14], which uses victims of serious violent crime as the base population. The authors suggest that as police action (i.e. stop and search) is carried out to prevent serious violent crime, stop and search volumes for of a group should be proportionate to the risk of harm of individuals who share the same characteristics, i.e. the number of victims of homicide. This approach therefore assumes firstly that stop and search is primarily carried out to prevent serious violence, which is not its only purpose, and that victims of homicide share the same characteristics of perpetrators of serious violence crime. While there is research which shows that offenders of violent crime are more likely to be victims of violent crime, the associations between these two groups are likely to be influenced by several factors other than ethnicity[footnote 15]. Furthermore, homicide usually occurs in private settings, e.g. those related to domestic violence or child abuse homicides.
As such, the analysis presented here explores the use of the MPS’ police-recorded suspects of selected violent crime types (e.g. the offences selected exclude offence types judged less relevant to stop and search such as domestic-abuse flagged offences, child-abuse related offences, stalking and harassment and historic violent crime offences) as the denominator to calculate stop and search rates[footnote 16]. As mentioned earlier, stop and search is not used randomly or evenly across the population - officers must have a reasonable grounds for suspicion. As such it is instructive to consider whether use of stop and search is in line with those who are suspects of relevant crimes. The data presented in this analysis includes suspects who have been arrested or charged, or received some other kind of formal outcome such as a caution or penalty notice disorder as well as those who are never officially named as a suspect by the police (around 7% of the violent crime offences included suspects that had received a formal outcome from the police). One reason for using suspects of crime as opposed to victims, is that victims of crime may not necessarily belong to the same group of people who are carrying out a crime, whereas the likelihood of being stopped and searched in relation to certain crimes should be related to the likelihood of committing those crimes. A potential limitation of this is that the same biases that may be found in police action such as use of stop and search might also be the same biases in someone being identified as a suspect – one factor that guards against this is that usually the suspect will have been identified[footnote 17] by the victim or some other kind of evidence (e.g. CCTV, DNA, fingerprints etc.).
A further issue is that a suspect has not been proven to have committed a crime. We explored using Ministry of Justice offender data as the base population, however comparable record level data below PFA level were not available for offenders[footnote 18]. Another alternative considered was suspects with a charge of violent crime, and whilst the ethnicity fields for these records were well-completed for the MPS, the volume of suspect records were very small, (around 3,300 crimes) compared with just over 88,000 records when including all crime outcomes for suspects of violent crime. A comparison of the ethnic profiles for these two denominators showed they were very similar (see Data Quality and Methodology section for a breakdown by ethnicity for suspects of violent crime).
Another reason for using suspects of violent crime as the denominator rather than victims of violent crime was the higher levels of available ethnicity data for suspects compared with victims (around 60% of officer-defined ethnicity fields were completed for suspects compared with 17% of self-defined ethnicity fields for victims). Suspect-ethnicity data is not currently a mandatory field for police recorded crime which in part explains the low levels of completion. One reason why ethnicity is not mandatory is because, for the purpose of investigating a crime, obtaining the victim’s self-defined ethnicity may not always be considered relevant or it may be seen as an inappropriate request when recording a crime. Suspect data is often integral to a police investigation however and therefore is more likely to be recorded by the police. However suspect data is often reliant on the memory of the victim or eyewitnesses which have been shown to be at times unreliable[footnote 19]. Suspect ethnicity data for violent crime was found to be better completed compared with all crime (60% vs. around 44%), which is likely due to the nature of violent crime which more often involves close contact between the victim and a suspect than other crimes. Comparing the profile of stop and search in the MPS with suspects of violent crime in the MPS show broadly similar ethnic profiles, however, people from the White and Other groups account for a smaller proportion of stop and searches compared with suspects of violent crime (see Data Quality and Methodology section for more detail).
When exploring the use of suspects of different crime types as the denominator in stop and search rates, the crime types considered were drug offences and violent crime as these crimes are most closely related with stop and search. Although the majority of stop and searches are for drugs (69% of all section 1[footnote 20] searches for both the MPS and England and Wales), police-recorded drug offences are driven by stop and search, therefore rates produced using suspects of drug offences may be less insightful in terms of understanding whether a sub-group of the population is over-represented. Suspects ethnic profiles for these two crime types were found to be broadly similar for the MPS. Violent crime is known to have some links with drugs, e.g. there is a police focus to combat the violence associated with drugs and county lines gangs (as discussed in the Serious Violence Strategy), and stop and search powers are one of the tools used in tackling serious violent crime. Spatial analysis referenced in Annex A of the ‘Police Powers and Procedures’ bulletin also showed a moderately positive correlation between stop and search hotspots and serious violent crime at Lower Super Output Area[footnote 21] (LSOA) level in the Metropolitan Police Service (r = 0.54)[footnote 22].
In considering suspects of violent crime as the denominator, one option considered was to restrict the stop and search records to Section 60[footnote 23] searches, given they are specifically conducted in anticipation of violent crime. However, they account for a very small proportion of all stop and searches (1.3% in England and Wales and 1.7% for the MPS) and for this reason we have combined both section 1 and section 60 searches to allow a large enough number of records to be analysed.
3.3 Suspect-Adjusted Disparity method
Rather than the traditional method for calculating rates and ratios, where the entire resident population is used, instead the rate is based on the characteristics of suspects of violent crime of the same ethnicity in each area (borough in this example). It is important to note that the borough is based on where the crime took place as opposed to where the suspect resides, which may not always be the same. This counteracts some of the issues with traditional methods using resident population denominators not accounting for transient populations.
The method for calculating the Suspect-Adjusted Disparity is:
-
Calculate S&S rate per suspect of violent crime for Group X = A e.g. there were 19,304 Black suspects of violent crime in the MPS and the total volume of stop and searches of Black people in the MPS for the year ending March 2021 was 106,996. Dividing one by the other gives a rate of 5.5 stops per suspect of crime.
-
Calculate S&S rate per suspect of violent crime for comparison Group Y = B e.g. there were 25,289 White suspects of violent crime in the MPS and the total volume of stop and searches of White people in the MPS for the year ending March 2021 was 119,870. Dividing one by the other gives a rate of 4.7 stops per suspect of crime.
-
Divide A by B to calculate the Suspect-Adjusted Disparity = A/B = C e.g. divide 5.5 by 4.7 gives a disparity ratio of 1.2, i.e. Black people are stopped and searched 1.2 times as much as White people.
A ratio of more than 1 means the comparison group has a higher likelihood of being stopped and searched, e.g. if the ratio is 2 for Black people compared with White people it means they are twice as likely to be stopped and searched. A ratio of less than 1 indicates that the comparison group has a lower likelihood of being stopped and searched.
4. Strengths and limitations
As with any statistical methodology, each approach has some strengths as well as some limitations, outlined below. These are useful to bear in mind when interpreting the results from the analysis.
Denominator: Resident population estimates (Traditional 2011 Census)
Strengths:
- helpful in understanding likelihood of stop and search for all residents
- robust statistics used in all HO publications, with a consistent time series
Limitations
- people who are stopped and searched do not necessarily reside in the area in which they were stopped
- does not account for how both stop and searches, and ethnic minority populations are clustered in localised areas, particularly London[footnote 24]
- the 2011 Census statistics are now out of date and likely no longer accurately reflect the current resident population
- rates for police force areas masked differences below this geography which arise from differences in the ethnic profile of small areas and the hotspot nature of stop and search
Denominator: Suspects of selected police-recorded violent crime
Strengths:
- stop and search is used in the investigation and prevention of crime (although not just violent crime); Stop and search is not applied at random or evenly across the population – an officer must have reasonable grounds for suspicion before conducting a search; as such it is instructive to consider whether use of stop and search is in line with those who are suspects of relevant crimes
- police-recorded crime data are based on where an offence takes place which may address some of the issues associated with a transient stop and search population
Limitations:
- most stop and searches are for drugs rather than for offensive weapons or in anticipation of violence
- suspects of violent crime may include individuals who have not received a conviction; therefore, the people included as a suspect may be subject to the same biases as those subject to stop and search
- police-recorded crime data are offence based and therefore do not allow the impact of repeat offending to be understood, for example the same suspect may appear multiple times in the data but it is not possible to determine this from the data; similarly, stop and search data received by the Home Office data are a measure of the number of stops rather than the number of people being stopped
- data quality is fair – as discussed, only 60% of violent crime offences had information on a suspect’s ethnicity; as discussed earlier, as part of the quality checks, the ethnic profile of all suspects was compared to only suspects with a charge and these were found to be very similar
- small volumes of suspects in the Other category limits our understanding of the experience of all people from a minority ethnic background
Given the exploratory nature of this analysis, we have provided the information separately to the main Police Powers and Procedures bulletin, to acknowledge that further development is currently taking place. Building on previous work together, the Home Office will work with the Race Disparity Unit and Office for National Statistics on developing measures and methods for analysing and reporting on the use of stop and search. Home Office analysts also plan to work with forces to understand how they can close the ethnicity data gaps in police recorded crime in order to improve data quality (see Data Quality and Methodology section for more information on data quality). Additionally, as this is the first year incident-level data has been collected, the analysis is confined to one year’s worth of data. In future years it will be possible to combine data for several years and therefore analyse data at lower geographies and possibly explore how rates and ratios differ in other Police Force Areas.
Lastly, we invite users to provide feedback on the analysis presented in this report to aid the development work. Users can contact Home Office statisticians at crimeandpolicestats@homeoffice.gov.uk.
5. Stop and search in the MPS compared with England and Wales
In the year to March 2021 there were 704,239 stop and searches in England and Wales, an increase of 22% compared with the previous year. As in previous years, the vast majority (99% or 695,009) of these were carried out under section 1 PACE and the remaining 1% (9,230) carried out under section 60 CJPOA. Stop and searches under section 1 PACE increased compared with the previous year (up 24% from 559,201 to 695,009) whereas searches under section 60 CJPOA decreased (down 49% from 18,043 to 9,230).
As noted in the ‘Police Powers and Procedures’ bulletin, several police forces reported that a reduction in demand for other calls to service, such as response to crime , in parts of the year ending March 2021 in which there were restrictions imposed due to the COVID-19 pandemic, gave increased capacity for proactive policing. Some police forces, including the Metropolitan Police, stated that proactive policing involved targeting drug dealers and County Lines operations, which may be part of the reason for the increase in drug searches across the latest year (up 36% from 350,904 in the year ending March 2020 to 478,576 in the year ending March 2021 in England and Wales, with a similar increase in the MPS, up 31% to 212,936). Furthermore, other forces cited that the increase in officer numbers as part of the Police Uplift Programme, and officers cancelling annual leave, may have also been factors in the proactivity increase. However, this may have been partially counteracted by officer sickness or isolation.
The MPS accounted for 44% of all stop and searches (section 1 and section 60 combined) in the year to March 2021, or 316,747 stop and searches, equating to 38.8 searches per 1,000 population (using 2011 Census statistics, and excluding vehicle searches and searches where ethnicity was not stated). Table 1 below, taken from the ‘Police Powers and Procedures’ bulletin, shows the distribution of stop and searches across the ethnic groups for those stopped and search by the MPS and police in the rest of England and Wales. Of the searches that took place in the MPS area, around two-fifths were carried out on White people (39%), and around a third were carried out on Black people (34%). This is different to the rest of England and Wales where three-quarters (75%) were carried out on White people and less than 1 in 10 on Black people.
Table 1: Proportion of all stop and searches, by ethnicity, year to March 2021
| All searches | White | Black (or Black British) | Asian (or Asian British) | Other Ethnic Group | Not stated | Total |
|---|---|---|---|---|---|---|
| E&W excl. MPS | 75 | 8 | 10 | 4 | 2 | 100 |
| MPS | 39 | 34 | 18 | 8 | 0 | 100 |
| England & Wales | 59 | 20 | 14 | 6 | 2 | 100 |
Notes:
- Ethnicity primarily based on self-defined ethnicity, however where not stated officer-defined is used.
- Due to rounding, percentages may not sum to 100.
Table 2 shows that the MPS has a much more diverse population compared with the rest of England and Wales, with 60% of the population belonging to the White group compared with 90% in the rest of England and Wales.
Table 2: Proportions of ethnicity (%) in the MPS and England and Wales, 2011 Census statistics
| 2011 Census | White | Black | Asian | Other (including Mixed) |
|---|---|---|---|---|
| MPS | 60 | 13 | 18 | 8 |
| E&W excl. MPS | 90 | 2 | 6 | 2 |
| England & Wales | 86 | 3 | 8 | 3 |
Notes:
- Due to rounding, percentages may not sum to 100.
Table 3 shows the rate per 1,000 population for each ethnic group, based on the 2011 ONS Census, and the disparity ratio for each group compared to the White group, for the MPS and the rest of England and Wales. These figures show that for the MPS, Black people were 4.0 times more likely to be stopped and searched than White people, which was much higher than the other ethnic groups - Asian people were 1.6 times as likely than White people to be stopped and searched and those who identified as belonging to a Mixed or Other ethnicity were 1.5 times as likely. Ratios are lower in the MPS and in all other PFAs combined compared with all of England and Wales. This is an example of Simpson’s paradox, i.e. a different trend or pattern is observed for a sub-population than compared with the average for the entire population. As mentioned earlier, the MPS has much more ethnically diverse population compared with the rest of England and Wales, for example 60% of Black people live in London and the majority of stop and searches on Black people are carried out by the MPS. Therefore, if there is an increase in stop and searches on Black people in the MPS, this will greatly affect the national average, even if disparity within the MPS remains the same. Conversely, most other areas in England and Wales have much higher proportions of White people and low volumes of stop and search on White people therefore any changes to volumes of White people in these areas will greatly affect the national average. This demonstrates why it is insightful to look at lower levels of geography when calculating stop and search rates. Furthermore as shown in Annex A of the ‘Police Powers and Procedures’ bulletin, which presents stop and search volumes at LSOA level, searches tend to take place in very localised areas, so even calculating a rate based on a whole Police Force Area will mask variation in rates at lower geographies.
Table 3: Stop and search rates per 1,000 population (2011 Census) and ratios compared with White group, by ethnicity, year to March 2021
| Rate per 1,000 population | Rate per 1,000 population | Rate per 1,000 population | Rate per 1,000 population | Disparity ratio | Disparity ratio | Disparity ratio | ||
|---|---|---|---|---|---|---|---|---|
| Police Force Area(s) | White | Black (or Black British) | Asian (or Asian British) | Other Ethnic Group or Mixed | Black (or Black British) | Asian (or Asian British) | Other Ethnic Group or Mixed | |
| MPS | 24.6 | 98.3 | 38.1 | 37.3 | 4.0 | 1.6 | 1.5 | |
| E&W excl. MPS | 6.7 | 40.6 | 14.5 | 15.0 | 6.1 | 2.2 | 2.2 | |
| All E&W | 8.5 | 74.3 | 22.9 | 23.5 | 8.7 | 2.7 | 2.8 |
Notes:
- Ethnicity primarily based on self-defined ethnicity, however where not stated officer-defined is used.
As mentioned in the Introduction of this report, one of the criticisms of the current way in which stop and search rates are calculated is related to the fact that Census estimates are now ten years old and no longer likely to reflect the resident population. Table 4 below compares the ethnic profile of London boroughs using the 2011 Census estimates with the Greater London Authority (GLA) ethnic group projections[footnote 25] for 2020 (for a full breakdown see Table A1 in Annex A of this report). The proportion of White people in each borough varies considerably; for example, some areas in South West London (such as Richmond and Kingston) a high proportion of the resident population belongs to the White ethnic group. Conversely, areas such as Brent and Newham have a majority of residents from other ethnic groups. London has seen an overall population increase of around 13% since 2011 and an increase in in the diversity of its resident population, including a decrease in the proportion of White residents, falling from 60% in 2011 to 56% in 2020. Most of the population increase in London is due to an increase in the Asian population, contributing to 38% of the increase, followed by the White population (26% of the increase), the Other (including Mixed) population (21% of the increase) and the Black population (15% of the increase). Based on the 2020 estimates, some boroughs have seen significant changes since 2011 in their ethnic profile, for example Barking and Dagenham, Hillingdon and Croydon have all seen large decreases in the proportion of their populations who are White (down 12, 11 and 8 percentage points respectively). In light of this, the analysis in the remainder of this report uses 2020 population estimates.
Table 4: Proportion of White people, MPS by borough, ONS 2011 Census estimates compared with 2020 GLA Projections
| London borough | 2011 | % of population | 2020 | % of population |
|---|---|---|---|---|
| Barking and Dagenham | 108,386 | 58% | 102,020 | 46% |
| Barnet | 228,553 | 64% | 242,656 | 60% |
| Bexley | 189,962 | 82% | 193,150 | 76% |
| Brent | 112,880 | 36% | 117,027 | 34% |
| Bromley | 260,870 | 84% | 269,385 | 79% |
| Camden | 146,055 | 66% | 167,937 | 65% |
| Croydon | 200,195 | 55% | 186,521 | 47% |
| Ealing | 165,818 | 49% | 163,530 | 46% |
| Enfield | 190,640 | 61% | 193,878 | 56% |
| Greenwich | 159,002 | 62% | 169,946 | 58% |
| Hackney | 134,617 | 55% | 163,290 | 57% |
| Hammersmith and Fulham | 124,222 | 68% | 121,487 | 65% |
| Haringey | 154,343 | 61% | 181,342 | 62% |
| Harrow | 100,991 | 42% | 93,739 | 36% |
| Havering | 207,949 | 88% | 216,905 | 82% |
| Hillingdon | 166,031 | 61% | 159,602 | 50% |
| Hounslow | 130,505 | 51% | 134,066 | 47% |
| Islington | 140,515 | 68% | 163,112 | 67% |
| Kensington and Chelsea | 112,017 | 71% | 111,352 | 69% |
| Kingston upon Thames | 119,219 | 74% | 123,243 | 67% |
| Lambeth | 173,025 | 57% | 199,771 | 59% |
| Lewisham | 147,686 | 54% | 162,877 | 51% |
| Merton | 129,606 | 65% | 135,402 | 63% |
| Newham | 89,216 | 29% | 92,713 | 26% |
| Redbridge | 118,646 | 43% | 107,613 | 34% |
| Richmond upon Thames | 160,725 | 86% | 170,868 | 84% |
| Southwark | 156,349 | 54% | 178,718 | 54% |
| Sutton | 149,449 | 79% | 154,079 | 73% |
| Tower Hamlets | 114,819 | 45% | 148,896 | 46% |
| Waltham Forest | 134,799 | 52% | 143,437 | 49% |
| Wandsworth | 219,216 | 71% | 229,631 | 70% |
| Westminster | 135,330 | 62% | 154,137 | 60% |
| Total | 4,881,636 | 60% | 5,152,330 | 56% |
5.1 Stop and search rates at borough level
Figure 1 below shows stop and search rates per 1,000 population in the MPS at borough level. Previously, Home Office data did not allow analysis of stop and search rates at this level of geography. Being able to do so shows that there is some variation in stop and search rates below Police Force area level, which is related to the differences in population at borough level (as shown in Table 4) and also volumes of stop and search. For example, stop and search rates are highest in Westminster (67.8 per 1,000 people indicated by the darker purple), this is compared with the overall rate of 33.7 for the whole of the MPS. The lowest rate was in Barnet at around 11.9 stops per 1,000 people.
Figure 1: Stop and search rates per 1,000 people (using 2020 GLA estimates), Metropolitan Police Force Area by borough, year to March 2021
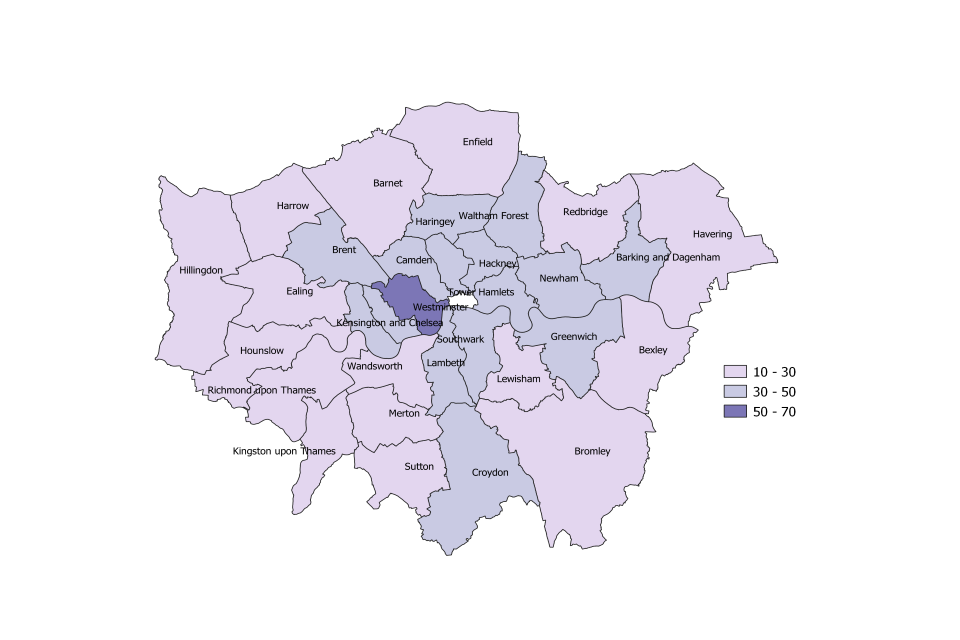
Notes:
- Excludes vehicle searches and searches where a person’s ethnicity was not stated.
6. Comparison of methods - calculating variations in stop and search rates by ethnicity
6.1 Comparing stop and search disparity ratios for Black and White groups
Resident population denominators (2020 GLA projected estimates)
Across the whole of the MPS, White people were stopped (under section 1 PACE and section 60 CJPOA) at a rate of around 23.3 stops per 1,000 people. This was compared with around 86.4 stops per 1,000 Black people, meaning Black people were 3.7 times more likely to be stopped than White people.
The new geographical data allows us to explore these rates at borough level. Doing so reveals the wide variation at borough level; rates for White people ranged from 8.1 to 61.2 per 1,000 people and for Black people it ranged from 24.8 to 268.0 stops per 1,000 people (see Table A3 of Annex A of this report).
Table 5 shows a comparison of disparity ratios for Black people relative to White people at borough level for the MPS using the two approaches described above, i.e. using 2020 GLA projected estimates (resident population) and suspects of violent crime.
Using the resident population as the denominator shows that disparity ratios were lowest in Newham and Barking and Dagenham (both 1.3) and the highest ratio was in Richmond upon Thames (13.5). Despite this high ratio, Richmond accounts for the smallest proportion of searches on Black people in the MPS (less than 1% or 529 searches). Richmond’s high disparity ratio therefore arises from the largely White resident population (84%). The ethnic profile of this area means small changes in search volumes of Black people can make a significant difference to ratios. At a national level, similar patterns have been shown in Police Force Areas such as Cumbria, Dorset and North Yorkshire, all areas with a high proportion of White people. Exploring how small numbers might affect areas such as Richmond, sensitivity analysis shows that if stop and searches of Black people in Richmond were to increase by 100 (an increase of 19%), the disparity ratio would increase to 16.1. A reduction of 100 searches however, would narrow the ratio to 11.0 Conversely, although Newham accounts for the third highest volume of stop and searches on Black people, the ratio for Newham is low (1.3) using this method as it has a very diverse population with 74% of the population belonging to a Black, Asian or other minority ethnic background.
Suspect-adjusted disparity ratios
Using suspect-derived denominators reduced disparity ratios for Black people from 3.7 to 1.2 for the MPS overall, although the impact varied across boroughs, with ratios ranging from 0.7 to 1.7, with some boroughs seeing much larger changes. Most boroughs therefore still showed some disparity using this approach, albeit these were smaller compared with the traditional resident population method. Richmond-upon-Thames saw the biggest reduction, down from 13.5 to 1.3. Other notable decreases were in Kensington and Chelsea (down from 9.9 to 1.3) and in Wandsworth (8.2 to 1.4).
There are several factors that may explain why disparity ratios reduce for Black people using suspect derived denominators compared with resident-based denominators. First, stop and search is skewed towards young men – data presented in the ‘Police Powers and Procedures’ bulletin shows that 70% of stop and searches are carried out on males aged 15-34 despite this age group comprising 13% of the population[footnote 26]. Second, young males are more ethnically diverse than the population as a whole, which is generally older and has a larger proportion of White people. Finally, not all people who are stopped and searched reside in the area in which they were searched. Together, these factors contribute to larger disparity ratios when using resident population denominators. Conversely, the suspect data for the MPS shows that Black people are much more highly represented in violent crimes compared with the MPS population, accounting for 36% of suspect records used in the analysis compared with 13% of the resident population (see Data Quality and Methodology section for the full breakdown of suspect ethnicity data). Furthermore, Ministry of Justice convictions data[footnote 27] for the year ending March 2020 show that Black offenders are disproportionately represented in the Criminal Justice System (accounting for around 11% of offenders with a conviction for all crime and 7% for violent crime, compared with around 3.3% of the population in England and Wales).
Table 5: Stop and search disparity ratios, Black people compared with White people, MPS boroughs, year to March 2021
| London borough | Resident population- based disparity ratio | Suspect-adjusted disparity ratio | Difference |
|---|---|---|---|
| Barking and Dagenham | 1.3 | 1.2 | -0.1 |
| Barnet | 5.5 | 1.6 | -3.8 |
| Bexley | 1.7 | 0.8 | -0.9 |
| Brent | 3.7 | 1.6 | -2.0 |
| Bromley | 3.0 | 0.8 | -2.2 |
| Camden | 7.2 | 1.3 | -5.8 |
| Croydon | 2.1 | 0.8 | -1.3 |
| Ealing | 5.9 | 1.7 | -4.2 |
| Enfield | 1.9 | 0.9 | -0.9 |
| Greenwich | 2.0 | 1.0 | -1.0 |
| Hackney | 4.7 | 1.2 | -3.5 |
| Hammersmith and Fulham | 6.6 | 1.4 | -5.2 |
| Haringey | 4.4 | 1.3 | -3.1 |
| Harrow | 4.4 | 1.6 | -2.8 |
| Havering | 3.1 | 0.8 | -2.3 |
| Hillingdon | 3.9 | 1.6 | -2.3 |
| Hounslow | 3.8 | 1.2 | -2.5 |
| Islington | 5.2 | 1.2 | -4.0 |
| Kensington and Chelsea | 9.9 | 1.3 | -8.6 |
| Kingston upon Thames | 6.6 | 1.1 | -5.5 |
| Lambeth | 6.0 | 1.4 | -4.6 |
| Lewisham | 2.7 | 1.1 | -1.6 |
| Merton | 4.2 | 1.0 | -3.2 |
| Newham | 1.3 | 1.0 | -0.3 |
| Redbridge | 2.6 | 0.8 | -1.8 |
| Richmond upon Thames | 13.5 | 1.3 | -12.3 |
| Southwark | 3.3 | 1.2 | -2.1 |
| Sutton | 3.2 | 0.7 | -2.4 |
| Tower Hamlets | 5.3 | 1.2 | -4.1 |
| Waltham Forest | 2.6 | 1.1 | -1.5 |
| Wandsworth | 8.2 | 1.4 | -6.8 |
| Westminster | 6.2 | 1.2 | -5.0 |
| Total | 3.7 | 1.2 | -2.5 |
Notes:
- Total includes records where no detailed location was provided.
6.2 Comparing stop and search disparity ratios for Asian and White groups
The same analysis as above was repeated for Asian people compared with White people (see Table 6 below). A different pattern was shown with the Asian group than the Black group, with disparity ratios overall increasing for Asian people using suspect-based denominators compared with resident population estimates, from 1.3 to 1.7 for the whole of the MPS, although some boroughs showed decreases using this approach. Using the suspect based denominators made the most difference to Barking and Dagenham which showed an increase from 1.0 to 2.1. Tower Hamlets had the highest disparity ratio using both approaches (3.4 using resident population estimates and 3.2 for the suspect-adjusted ratio).
Table 6: Stop and search disparity ratios, Asian people compared with White people, MPS boroughs, year to March 2021
| London borough | Resident population- based disparity ratio | Suspect-adjusted disparity ratio | Difference |
|---|---|---|---|
| Barking and Dagenham | 1.0 | 2.1 | 1.1 |
| Barnet | 1.2 | 2.0 | 0.8 |
| Bexley | 0.6 | 0.9 | 0.3 |
| Brent | 0.8 | 1.8 | 1.0 |
| Bromley | 0.8 | 0.7 | -0.1 |
| Camden | 1.3 | 1.7 | 0.4 |
| Croydon | 0.9 | 1.4 | 0.5 |
| Ealing | 1.6 | 1.6 | 0.0 |
| Enfield | 0.7 | 1.0 | 0.4 |
| Greenwich | 0.8 | 1.5 | 0.7 |
| Hackney | 2.8 | 2.2 | -0.5 |
| Hammersmith and Fulham | 1.6 | 1.7 | 0.1 |
| Haringey | 1.1 | 1.4 | 0.2 |
| Harrow | 0.7 | 1.8 | 1.1 |
| Havering | 1.6 | 1.1 | -0.5 |
| Hillingdon | 1.0 | 1.4 | 0.4 |
| Hounslow | 0.8 | 1.3 | 0.5 |
| Islington | 1.9 | 1.9 | -0.1 |
| Kensington and Chelsea | 1.9 | 1.5 | -0.3 |
| Kingston upon Thames | 0.8 | 1.2 | 0.4 |
| Lambeth | 2.0 | 1.4 | -0.6 |
| Lewisham | 0.8 | 1.3 | 0.6 |
| Merton | 1.3 | 1.7 | 0.4 |
| Newham | 0.5 | 1.5 | 1.0 |
| Redbridge | 0.8 | 1.6 | 0.8 |
| Richmond upon Thames | 2.1 | 1.7 | -0.4 |
| Southwark | 1.0 | 1.5 | 0.5 |
| Sutton | 0.7 | 1.0 | 0.4 |
| Tower Hamlets | 3.4 | 3.2 | -0.2 |
| Waltham Forest | 1.6 | 2.1 | 0.5 |
| Wandsworth | 2.2 | 1.5 | -0.7 |
| Westminster | 1.6 | 1.8 | 0.2 |
| Total | 1.3 | 1.7 | 0.4 |
Notes:
- Total includes records where no detailed location was provided.
7. Conclusions
Stop and search is a sensitive power and therefore the application of its use rightly receives a lot of scrutiny. It is a complex issue and the use of stop and search is affected by a variety of factors, some of which cannot be addressed in this analysis; it is not possible for example to know from the data where police resources were located and in what numbers, what operational decisions have been made in the lead up to any particular stop and search, nor the local context or intelligence received prior to searches, all of which have an influence on searches carried out.
With the available data that the Home Office has received for all Police Force Areas, the analysis in this report has presented two possible approaches to calculate stop and search ratios, applied at borough level for the MPS:
-
Resident population-based estimates and
-
Suspects of violent crime.
The analysis has shown that calculating stop and search rates using the traditional method of resident population estimate denominators at borough level gives a wide range of disparity ratios with big differences between boroughs. This is heavily influenced by the resident ethnic profile and the search volumes in these areas. Using data on the ethnicity of suspects of (selected) police recorded violent crimes as the denominator resulted in smaller disparity ratios for the Black group overall, from 3.7 to 1.2, although a ratio of above 1 still indicates a higher likelihood of being stopped and searched. This approach showed reductions in disparity ratios across all boroughs, with some very large reductions in some boroughs. For several boroughs the ratio was below 1. Conversely, for the Asian group compared with the White group the overall ratio increased from 1.3 to 1.7 using the suspect-adjusted disparity approach. The ratio increased in most boroughs, but reduced in some boroughs.
7.1 Future developments
Together, the two approaches described above provide new insight into the use of stop and search. We want to continue to improve our statistics on and understanding of the use of stop and search, and the following section set out areas we will focus on ahead of the next release.
Ethnicity data
Improving the levels of missing (self-defined) ethnicity in both the stop and search and police-recorded crime data (for both victims and suspects) is key to any future assessments of disparity in stop and search practices. Home Office analysts continue to work with police forces to ensure this is happening and to understand the challenges in recording these data. Whilst effort is taken to ensure data returned to the Home Office from police forces are consistent, each force uses their own system and will have different recording practices inevitable in any administrative system. As has been done for the stop and search data, one area of improvement for the ethnicity data used in the crime denominator could be to combine self-defined ethnicity with officer-defined as well.
Person-level data
The figures in this report relate to the number of stop and search incidents, rather than number of unique individuals stopped and searched i.e. multiple searches on the same people are counted as separate incidents. We would like to understand the distribution of stop and searches, and how frequently individuals are stopped and searched, however this requires good quality unique identifier data and at present, the data collected from forces show this field is poorly and inconsistently completed. Home Office statisticians will work with forces to develop the quality of these data.
Age and gender
Other improvements that could be made to our understanding of how some sub-populations are over-represented in the stop and search data include looking at age and gender disparities at lower geographies. Analysis included in the ‘Police Powers and Procedures’ bulletin shows that young men are disproportionately stopped and searched. A comparison of the age and gender profiles between people who are stopped and searched and suspects of (selected) police recorded violent crimes would add further insights. Further development of police-recorded suspect data is needed in order to achieve this.
Numerators
The analysis presented in this report includes searches for all reasons including:
-
section 1 PACE searches: Stolen property; Drugs; Firearms; Offensive weapons; Going equipped; Criminal damage; Other
-
section 60 searches (in anticipation of serious violence)
Limiting the stop and searches to only those where the reason for the search was for an offensive weapon, firearms or violence would help to further refine the analysis.
Denominators
Reference has been made in this report to other approaches which could further complement our understanding of the police use of stop and search, for example using denominators such as daytime population figures (which are currently not available although there have been some research papers on this topic), or offender statistics (which are not currently comparable to the Home Office stop and search data however this could be explored further to understand other options).
The analysis presented above used suspects of (selected) police recorded violent crime. There are associations between violent crime and stop and search (as explained in Annex A of the ‘Police Powers and Procedures’ bulletin which showed a moderately positive relationship (r=0.54) in relation to where they occur in London, however these could be explored more fully in order to understand the relationship between the two. In particular, future analysis could explore the variation in volumes of violent crime between boroughs and the reasons why some areas are prone to high volumes of violent crime, i.e. are these linked to the night-time economy, transport hubs etc, and what the relationship is with stop and search. The MPS’ Crime Data Dashboard for example shows that in the year to March 2021, the borough of Westminster had the highest rate of violence against the person offences (32 per 1,000 population). This is in comparison to the borough of Richmond which had a rate of 15 per 1,000. There are notable differences between these areas in terms of the number of tourists, visitors and commuters who go into the boroughs.
Other crime denominators could be explored to understand how these impact disparity rates, for example, how would combining suspects of drug offences and violent crime affect ratios.
Geography
In future years once enough data is available, it may be possible to combine several years’ worth of data to carry out analysis at LSOA level. This would be preferable as stop and search tends to take place in concentrated areas, as shown in Figure 2 below (which can be found in the ‘Police Powers and Procedures’ bulletin for the year ending March 2021). Analysis of stop and search conducted by the MPS in the year ending March 2021 at Lower Super Output Area (LSOA ) level shows that there are certain small areas of London, such as parts of Westminster and Croydon, with high levels of stop and search activity, and large areas (predominantly, but not limited to, the outskirts of the Police Force Area) with comparatively low levels. Approximately 25% of stop and search within London takes place in just 3% of LSOAs within London.
Figure 2: Stop and search activity at LSOA level within London, year ending March 2021
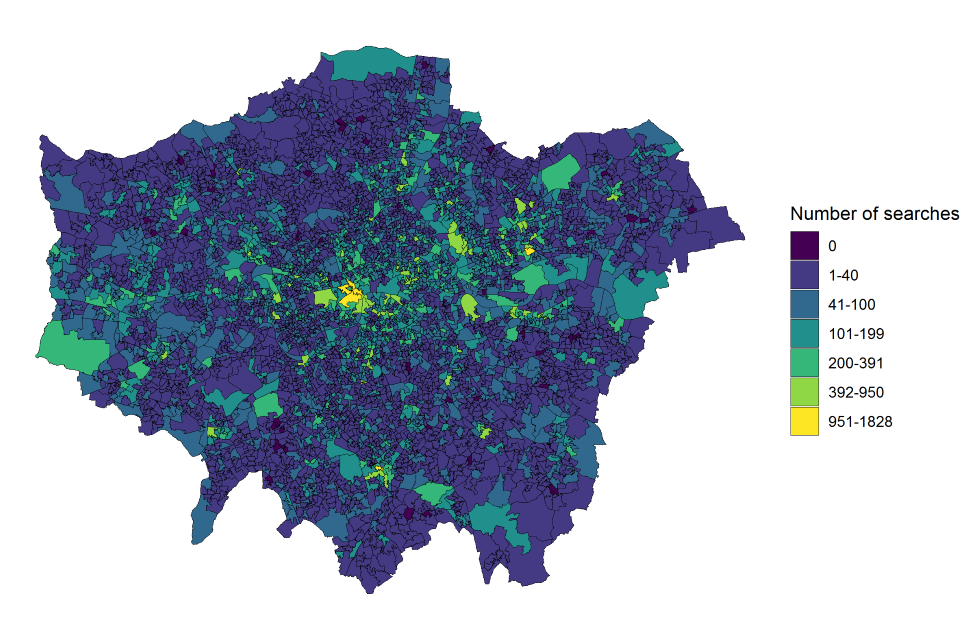
Notes:
- Includes searches carried out within the City of London by Metropolitan Police officers. Excludes searches undertaken outside London.
- Approximately 89% of stop and search records submitted to the Home Office by the Metropolitan Police in the year ending March 2021 had a valid LSOA.
Contextual information
Lastly, there are other confounding factors that could be explored in a future paper. For example, the interaction between stop and search and ethnicity with reference to levels of deprivation and police resource allocation decisions.
The resultant arrest rate from stop and searches and whether outcomes are linked to the searches could also be useful in aiding understanding of how the police are using stop and search powers.
We welcome the opportunity to engage users in the development of these Experimental Statistics and invite them to contact Home Office statisticians at crimeandpolicestats@homeoffice.gov.uk.
8. Data quality and Methodology
Population data
The 2020 population estimates used in the resident calculations use the Greater London Authority ‘2016-based Central Trend Ethnic Group Population Projections’. These are available here: Population Statistics and Analysis at the Greater London Authority.
Estimates have been rounded to the nearest person, therefore some of the figures used do not sum to the total and should be treated with caution.
It is unlikely that the 2021 Census population estimates will be available for some time, see the ONS website for release plans: Release plans - Office for National Statistics (ons.gov.uk). Once these are available, future analysis will use these estimates.
Stop and search data
The stop and search data included in the analysis of this report is based on data provided by the MPS for the year to March 2021 and includes section 1 and section 60 data combined.
The figures in this report relate to the number of stop and search incidents, rather than number of unique individuals stopped and searched i.e. multiple searches on the same people are counted as separate incidents. Therefore, the rates or proportions presented do not strictly refer to the proportion of the population (or sub-populations) that experienced stop and search in the latest year.
The ethnicity used for the analysis is based on self-defined ethnicity (i.e. the ONS 2011 Census 18 +1 categories). However, where ethnicity was not stated, officer-defined ethnicity has been used (where provided). This is the first time the Home Office have collected stop and search data on both the “officer-defined” ethnicity and the self-defined ethnicity of the person searched, for individual records. This means that if the self-defined ethnicity of the person searched was not stated, officer-defined ethnicity can be used as a proxy, for analytical purposes.
This approach is an attempt to reduce uncertainty in disparity rates based solely on self-defined ethnicity, caused by the growing proportion of records in which this information is not stated (19% in the year ending March 2021 for England and Wales, compared with 17% in the previous year and 15% in the year ending March 2019).
Almost a quarter (23%) of stop and search records (excluding vehicle only searches) in the MPS did not provide a self-defined ethnicity, for the year ending March 2021 (see Table 7a below). The level of missing ethnicity data reduced to less than 1% once the data were combined with officer-defined ethnicity (Table 7b). However, in using officer-defined categories, detail is lost on the Mixed category (which is one of the five broad ethnicity categories using self-defined ethnicity).
For each ethnic category, around 11% of stop and search records did not have x and y co-ordinates assigned to them, which meant that the LSOA and borough in which the searches took place could not be determined.
Table 7a: Stop and search by ethnicity, self-defined ethnicity, MPS, year to March 2021
| Proportions (%) | White | Black | Asian | Mixed | Other Ethnicity | Not Known |
|---|---|---|---|---|---|---|
| Including unknowns | 32.0 | 24.3 | 14.3 | 3.4 | 2.7 | 23.2 |
| Excluding unknowns | 41.7 | 31.7 | 18.6 | 4.5 | 3.6 | N/A |
Table 7b: Stop and search by ethnicity, self-defined and officer-defined, MPS, year to March 2021
| Proportions (%) | White | Black | Asian | Other Ethnicity | Not Known |
|---|---|---|---|---|---|
| Including unknowns | 38.5 | 34.4 | 18.5 | 8.2 | 0.4 |
| Excluding unknowns | 38.7 | 34.5 | 18.6 | 8.2 | N/A |
Police-recorded violent crime suspect data
Under the Annual Data Requirement[footnote 28] (ADR), police forces in England and Wales must send their police recorded crime returns to the Home Office. These data are ingested into the Home Office Data Hub which is a live database. These data are published quarterly by the ONS as part of the ‘Crime in England and Wales’ statistical bulletin.
Police recorded violent crime suspect data for the MPS at LSOA level were extracted from the Home Office Data Hub and cover the period April 2020 to March 2021 inclusive. The data were extracted from the live database as at 28 July 2021 and therefore may have changed slightly since. Violent crimes with a domestic abuse flag were excluded from the analysis as were several other offences that were not deemed related to the type of violent crime that would be associated with stop and search (e.g. stalking and harassment and child neglect). Historical crimes (i.e. those recorded over a year after the crime took place) were also excluded to give a better picture of the current state of these offences. Table 8 below gives the full detail of offences included.
Table 8: Police recorded violent crime offence codes included in the suspect based denominators
| Offence Code | Offence Description |
|---|---|
| 1 | Murder |
| 4.1 | Manslaughter |
| 2 | Attempted murder |
| 5 | More serious wounding or other act endangering life |
| 5A | Wounding |
| 5B | Use of substance or object to endanger life |
| 5C | Possession of items to endanger life |
| 5D | Assault with intent to cause serious harm |
| 8F | Inflicting grevious bodily harm |
| 8H | Racially or religiously aggravated inflicting GBH without intent |
| 8A | Other wounding |
| 8J | Racially or religiously aggravated ABH or other injury |
| 8N | Assault with injury |
| 8P | Racially or religiously aggravated assault with injury |
| 3 | Threat or conspiracy to murder |
| 3A | Conspiracy to murder |
| 3B | Threats to kill |
| 105A | Assault without injury |
| 105B | Racially or religiously aggravated assault without injury |
As explained in the Introduction, it is not mandatory for forces to record the ethnicity of a suspect or victim, therefore these fields are generally poorly completed. The MPS self-defined ethnicity completeness rate for suspects of violent crime was around 21%. For officer-defined ethnicity (or officer-completed), the completion rate was around 60%, therefore officer-defined ethnicity was used for this analysis. One possible reason for the higher levels of complete data for officer-defined ethnicity rather than self-defined is because a suspect has been identified either by a victim, eyewitness or CCTV therefore the information on ethnicity is reliant on another person other than the suspect themselves. Home Office analysts will work with forces to improve the completion rates of ethnicity data.
Table 9 below shows the proportion of each ethnic group for police recorded violent crime, based on suspect ethnicity as defined by an officer. Excluding the unknown ethnicity records, just under half of suspects (47%) were defined as White, with over a third (36%) defined as Black, 13% Asian and a small proportion (3%) were defined as being of an Other ethnicity. Table 10 shows the ethnic distribution for suspects of all police recorded crime types. Excluding the unknowns, the proportions are quite similar to violent crime.
Table 9: Police recorded (selected) violent crime, suspect ethnicity (officer-defined), MPS, year to March 2021
| Proportions (%) | White | Black | Asian | Other Ethnicity | Not Known |
|---|---|---|---|---|---|
| Including unknowns | 29% | 22% | 8% | 2% | 40% |
| Excluding unknowns | 47% | 36% | 13% | 3% | n/a |
Notes:
- Due to rounding figures may not add to 100%
- Including unknowns (c.88,000 records), excluding unknowns (c.53,000 records)
Table 10: Police recorded crime (all crime), suspect ethnicity (officer-defined), MPS, year to March 2021
| Proportions (%) | White | Black | Asian | Other Ethnicity | Not Known |
|---|---|---|---|---|---|
| Including unknowns | 22% | 16% | 6% | 1% | 55% |
| Excluding unknowns | 49% | 35% | 13% | 3% | N/A |
Notes:
- Due to rounding figures may not add to 100%.
- These data were extracted at a slightly later date to the violent crime data.
- Including unknowns (c.649,000 records), excluding unknowns (c.362,000 records).
It should also be noted that an offence can have multiple suspects therefore the ethnicity count for the violent crime data is likely to be higher than the actual number of violent crimes. In addition, some offences do not always have a suspect attached to the record and therefore the data presented in this analysis will be an undercount of the total number of police-recorded violent crimes (around 1m total violent crimes in the year to March 2021 using comparable crimes[footnote 29]).
Combining the data
A data frame for the Metropolitan Police force area at LSOA was created. Information about population, stop and search by ethnicity and also suspects of crime by ethnicity was completed for each LSOA. The LSOA areas were then aggregated up to borough level and several calculations were performed for each borough, including a rate for each ethnic group based on resident population estimates and also suspect of violent crimes as well as disparity ratios for each approach for both Black and Asian people compared with White people.
9. Annex A
Table A1: 2011 Census population estimates compared with 2020 GLA projections, by London borough
| 2011 Census | 2011 Census | 2011 Census | 2011 Census | 2011 Census | 2020 GLA projections | 2020 GLA projections | 2020 GLA projections | 2020 GLA projections | 2020 GLA projections | Percentage Difference, 2020 compared with 2011 | Percentage Difference, 2020 compared with 2011 | Percentage Difference, 2020 compared with 2011 | Percentage Difference, 2020 compared with 2011 | Percentage Difference, 2020 compared with 2011 | |
|---|---|---|---|---|---|---|---|---|---|---|---|---|---|---|---|
| London borough | White | Black | Asian | Other | Total | White | Black | Asian | Other | Total | White | Black | Asian | Other | Total |
| Barking and Dagenham | 108,386 | 37,140 | 29,594 | 10,791 | 185,911 | 102,020 | 52,118 | 50,888 | 16,065 | 221,091 | -6% | 40% | 72% | 49% | 19% |
| Barnet | 228,553 | 27,431 | 65,918 | 34,484 | 356,386 | 242,656 | 33,780 | 83,738 | 46,464 | 406,637 | 6% | 23% | 27% | 35% | 14% |
| Bexley | 189,962 | 19,624 | 15,243 | 7,168 | 231,997 | 193,150 | 28,951 | 21,578 | 10,270 | 253,949 | 2% | 48% | 42% | 43% | 9% |
| Brent | 112,880 | 58,632 | 105,986 | 33,717 | 311,215 | 117,027 | 61,396 | 120,303 | 44,290 | 343,016 | 4% | 5% | 14% | 31% | 10% |
| Bromley | 260,870 | 18,686 | 16,067 | 13,769 | 309,392 | 269,385 | 30,932 | 20,968 | 20,088 | 341,373 | 3% | 66% | 31% | 46% | 10% |
| Camden | 146,055 | 18,060 | 35,446 | 20,777 | 220,338 | 167,937 | 18,867 | 45,196 | 25,949 | 257,949 | 15% | 4% | 28% | 25% | 17% |
| Croydon | 200,195 | 73,256 | 59,627 | 30,300 | 363,378 | 186,521 | 94,329 | 77,446 | 40,011 | 398,307 | -7% | 29% | 30% | 32% | 10% |
| Ealing | 165,818 | 36,860 | 100,439 | 35,332 | 338,449 | 163,530 | 38,255 | 113,511 | 41,707 | 357,002 | -1% | 4% | 13% | 18% | 5% |
| Enfield | 190,640 | 53,687 | 34,893 | 33,246 | 312,466 | 193,878 | 66,050 | 41,580 | 46,371 | 347,877 | 2% | 23% | 19% | 39% | 11% |
| Greenwich | 159,002 | 48,655 | 29,894 | 17,006 | 254,557 | 169,946 | 60,373 | 38,892 | 22,535 | 291,746 | 7% | 24% | 30% | 33% | 15% |
| Hackney | 134,617 | 56,858 | 25,867 | 28,928 | 246,270 | 163,290 | 58,127 | 28,225 | 38,076 | 287,717 | 21% | 2% | 9% | 32% | 17% |
| Hammersmith and Fulham | 124,222 | 21,505 | 16,635 | 20,131 | 182,493 | 121,487 | 22,571 | 18,760 | 23,657 | 186,476 | -2% | 5% | 13% | 18% | 2% |
| Haringey | 154,343 | 47,830 | 24,150 | 28,603 | 254,926 | 181,342 | 48,060 | 27,205 | 34,504 | 291,109 | 17% | 0% | 13% | 21% | 14% |
| Harrow | 100,991 | 19,708 | 101,808 | 16,549 | 239,056 | 93,739 | 22,441 | 122,243 | 21,673 | 260,095 | -7% | 14% | 20% | 31% | 9% |
| Havering | 207,949 | 11,481 | 11,545 | 6,257 | 237,232 | 216,905 | 17,900 | 19,885 | 10,806 | 265,496 | 4% | 56% | 72% | 73% | 12% |
| Hillingdon | 166,031 | 20,082 | 69,253 | 18,570 | 273,936 | 159,602 | 28,708 | 100,496 | 29,481 | 318,287 | -4% | 43% | 45% | 59% | 16% |
| Hounslow | 130,505 | 16,813 | 87,257 | 19,382 | 253,957 | 134,066 | 19,176 | 108,499 | 22,897 | 284,637 | 3% | 14% | 24% | 18% | 12% |
| Islington | 140,515 | 26,294 | 19,034 | 20,282 | 206,125 | 163,112 | 29,395 | 24,125 | 25,474 | 242,107 | 16% | 12% | 27% | 26% | 17% |
| Kensington and Chelsea | 112,017 | 10,333 | 15,861 | 20,438 | 158,649 | 111,352 | 9,923 | 17,562 | 21,401 | 160,235 | -1% | -4% | 11% | 5% | 1% |
| Kingston upon Thames | 119,219 | 4,021 | 26,152 | 10,668 | 160,060 | 123,243 | 6,063 | 39,370 | 16,249 | 184,924 | 3% | 51% | 51% | 52% | 16% |
| Lambeth | 173,025 | 78,542 | 20,938 | 30,581 | 303,086 | 199,771 | 80,345 | 21,893 | 37,553 | 339,565 | 15% | 2% | 5% | 23% | 12% |
| Lewisham | 147,686 | 74,942 | 25,534 | 27,723 | 275,885 | 162,877 | 83,626 | 33,330 | 37,903 | 317,737 | 10% | 12% | 31% | 37% | 15% |
| Merton | 129,606 | 20,811 | 36,143 | 13,133 | 199,693 | 135,402 | 20,015 | 44,067 | 15,710 | 215,193 | 4% | -4% | 22% | 20% | 8% |
| Newham | 89,216 | 60,256 | 133,895 | 24,617 | 307,984 | 92,713 | 63,833 | 171,714 | 33,142 | 361,401 | 4% | 6% | 28% | 35% | 17% |
| Redbridge | 118,646 | 24,845 | 116,503 | 18,976 | 278,970 | 107,613 | 25,803 | 159,574 | 24,072 | 317,061 | -9% | 4% | 37% | 27% | 14% |
| Richmond upon Thames | 160,725 | 2,816 | 13,607 | 9,842 | 186,990 | 170,868 | 3,451 | 17,540 | 12,036 | 203,896 | 6% | 23% | 29% | 22% | 9% |
| Southwark | 156,349 | 77,511 | 27,192 | 27,231 | 288,283 | 178,718 | 78,560 | 34,489 | 36,595 | 328,363 | 14% | 1% | 27% | 34% | 14% |
| Sutton | 149,449 | 9,120 | 22,035 | 9,542 | 190,146 | 154,079 | 11,177 | 32,567 | 14,121 | 211,944 | 3% | 23% | 48% | 48% | 11% |
| Tower Hamlets | 114,819 | 18,629 | 104,501 | 16,147 | 254,096 | 148,896 | 22,705 | 129,826 | 24,582 | 326,009 | 30% | 22% | 24% | 52% | 28% |
| Waltham Forest | 134,799 | 44,791 | 54,389 | 24,270 | 258,249 | 143,437 | 48,847 | 65,548 | 32,482 | 290,313 | 6% | 9% | 21% | 34% | 12% |
| Wandsworth | 219,216 | 32,756 | 33,338 | 21,685 | 306,995 | 229,631 | 35,392 | 33,868 | 29,078 | 327,969 | 5% | 8% | 2% | 34% | 7% |
| Westminster | 135,330 | 16,472 | 31,862 | 35,732 | 219,396 | 154,137 | 16,958 | 36,369 | 48,931 | 256,396 | 14% | 3% | 14% | 37% | 17% |
| Total | 4,881,636 | 1,088,447 | 1,510,606 | 685,877 | 8,166,566 | 5,152,330 | 1,238,127 | 1,901,255 | 904,173 | 9,195,877 | 6% | 14% | 26% | 32% | 13% |
Notes:
- Due to rounding of the 2020 GLA estimates, the sum of ethnicities does not add to the total population figure.
- Due to rounding figures may not add to 100%.
Table A2: Stop and searches by self-defined ethnicity (SDE) and officer-defined where SDE not stated, MPS, year to March 2021
| Borough | White | Black | Asian | Other | Total (excluding not stated and vehicle stops) |
|---|---|---|---|---|---|
| Barking and Dagenham | 2,951 | 1,918 | 1,467 | 316 | 6,652 |
| Barnet | 1,958 | 1,486 | 797 | 618 | 4,859 |
| Bexley | 2,790 | 717 | 187 | 153 | 3,847 |
| Brent | 2,570 | 4,974 | 2,110 | 1,128 | 10,782 |
| Bromley | 5,300 | 1,814 | 337 | 313 | 7,764 |
| Camden | 4,292 | 3,455 | 1,513 | 796 | 10,056 |
| Croydon | 4,662 | 4,995 | 1,648 | 1,216 | 12,521 |
| Ealing | 2,711 | 3,730 | 3,030 | 776 | 10,247 |
| Enfield | 3,510 | 2,214 | 490 | 677 | 6,891 |
| Greenwich | 5,511 | 3,971 | 1,040 | 729 | 11,251 |
| Hackney | 2,676 | 4,507 | 1,278 | 696 | 9,157 |
| Hammersmith and Fulham | 2,190 | 2,696 | 528 | 880 | 6,294 |
| Haringey | 3,469 | 4,085 | 595 | 882 | 9,031 |
| Harrow | 1,495 | 1,572 | 1,326 | 466 | 4,859 |
| Havering | 3,491 | 901 | 497 | 191 | 5,080 |
| Hillingdon | 3,072 | 2,150 | 2,004 | 423 | 7,649 |
| Hounslow | 3,340 | 1,803 | 2,059 | 524 | 7,726 |
| Islington | 3,240 | 3,054 | 927 | 594 | 7,815 |
| Kensington and Chelsea | 2,466 | 2,166 | 721 | 1,171 | 6,524 |
| Kingston upon Thames | 2,464 | 800 | 633 | 389 | 4,286 |
| Lambeth | 3,640 | 8,837 | 793 | 917 | 14,187 |
| Lewisham | 2,613 | 3,565 | 419 | 468 | 7,065 |
| Merton | 1,924 | 1,184 | 823 | 300 | 4,231 |
| Newham | 5,677 | 5,173 | 5,381 | 832 | 17,063 |
| Redbridge | 2,978 | 1,853 | 3,699 | 348 | 8,878 |
| Richmond upon Thames | 1,934 | 529 | 416 | 250 | 3,129 |
| Southwark | 5,098 | 7,452 | 988 | 1,117 | 14,655 |
| Sutton | 2,659 | 610 | 386 | 149 | 3,804 |
| Tower Hamlets | 3,156 | 2,566 | 9,425 | 590 | 15,737 |
| Waltham Forest | 3,718 | 3,284 | 2,634 | 635 | 10,271 |
| Wandsworth | 2,400 | 3,042 | 789 | 568 | 6,799 |
| Westminster | 6,679 | 4,544 | 2,505 | 3,651 | 17,379 |
| No detailed location provided | 13,236 | 11,349 | 6,123 | 2,791 | 33,499 |
| Total | 119,870 | 106,996 | 57,568 | 25,554 | 309,988 |
Table A3: Stop and search rates per 1,000 population (2020 GLA projections), MPS, year to March 2021
| Borough | White | Black | Asian | Other | Total (excluding not stated and vehicle stops) |
|---|---|---|---|---|---|
| Barking and Dagenham | 28.9 | 36.8 | 28.8 | 19.7 | 30.1 |
| Barnet | 8.1 | 44.0 | 9.5 | 13.3 | 11.9 |
| Bexley | 14.4 | 24.8 | 8.7 | 14.9 | 15.1 |
| Brent | 22.0 | 81.0 | 17.5 | 25.5 | 31.4 |
| Bromley | 19.7 | 58.6 | 16.1 | 15.6 | 22.7 |
| Camden | 25.6 | 183.1 | 33.5 | 30.7 | 39.0 |
| Croydon | 25.0 | 53.0 | 21.3 | 30.4 | 31.4 |
| Ealing | 16.6 | 97.5 | 26.7 | 18.6 | 28.7 |
| Enfield | 18.1 | 33.5 | 11.8 | 14.6 | 19.8 |
| Greenwich | 32.4 | 65.8 | 26.7 | 32.3 | 38.6 |
| Hackney | 16.4 | 77.5 | 45.3 | 18.3 | 31.8 |
| Hammersmith and Fulham | 18.0 | 119.4 | 28.1 | 37.2 | 33.8 |
| Haringey | 19.1 | 85.0 | 21.9 | 25.6 | 31.0 |
| Harrow | 15.9 | 70.1 | 10.8 | 21.5 | 18.7 |
| Havering | 16.1 | 50.3 | 25.0 | 17.7 | 19.1 |
| Hillingdon | 19.2 | 74.9 | 19.9 | 14.3 | 24.0 |
| Hounslow | 24.9 | 94.0 | 19.0 | 22.9 | 27.1 |
| Islington | 19.9 | 103.9 | 38.4 | 23.3 | 32.3 |
| Kensington and Chelsea | 22.1 | 218.3 | 41.1 | 54.7 | 40.7 |
| Kingston upon Thames | 20.0 | 131.9 | 16.1 | 23.9 | 23.2 |
| Lambeth | 18.2 | 110.0 | 36.2 | 24.4 | 41.8 |
| Lewisham | 16.0 | 42.6 | 12.6 | 12.3 | 22.2 |
| Merton | 14.2 | 59.2 | 18.7 | 19.1 | 19.7 |
| Newham | 61.2 | 81.0 | 31.3 | 25.1 | 47.2 |
| Redbridge | 27.7 | 71.8 | 23.2 | 14.5 | 28.0 |
| Richmond upon Thames | 11.3 | 153.3 | 23.7 | 20.8 | 15.3 |
| Southwark | 28.5 | 94.9 | 28.6 | 30.5 | 44.6 |
| Sutton | 17.3 | 54.6 | 11.9 | 10.6 | 17.9 |
| Tower Hamlets | 21.2 | 113.0 | 72.6 | 24.0 | 48.3 |
| Waltham Forest | 25.9 | 67.2 | 40.2 | 19.5 | 35.4 |
| Wandsworth | 10.5 | 86.0 | 23.3 | 19.5 | 20.7 |
| Westminster | 43.3 | 268.0 | 68.9 | 74.6 | 67.8 |
| Total | 23.3 | 86.4 | 30.3 | 28.3 | 33.7 |
Notes:
- Total includes records where no detailed location was provided.
Table A4: Suspects of (selected) police recorded violent crime, officer-defined ethnicity, MPS, by borough, year to March 2021
| Borough | White | Black | Asian | Other (including mixed) | Total (excludes not stated) |
|---|---|---|---|---|---|
| Barking and Dagenham | 775 | 436 | 184 | 8 | 1,403 |
| Barnet | 929 | 439 | 192 | 101 | 1,661 |
| Bexley | 812 | 264 | 62 | 6 | 1,144 |
| Brent | 891 | 1048 | 400 | 170 | 2,509 |
| Bromley | 940 | 428 | 82 | 7 | 1,457 |
| Camden | 883 | 531 | 180 | 47 | 1,641 |
| Croydon | 961 | 1240 | 249 | 50 | 2,500 |
| Ealing | 841 | 689 | 577 | 125 | 2,232 |
| Enfield | 967 | 648 | 131 | 23 | 1,769 |
| Greenwich | 1041 | 725 | 133 | 18 | 1,917 |
| Hackney | 782 | 1094 | 168 | 36 | 2,080 |
| Hammersmith and Fulham | 572 | 503 | 82 | 103 | 1,260 |
| Haringey | 929 | 843 | 118 | 33 | 1,923 |
| Harrow | 465 | 298 | 231 | 52 | 1,046 |
| Havering | 690 | 225 | 91 | 5 | 1,011 |
| Hillingdon | 902 | 391 | 406 | 30 | 1,729 |
| Hounslow | 910 | 394 | 430 | 63 | 1,797 |
| Islington | 711 | 567 | 108 | 23 | 1,409 |
| Kensington and Chelsea | 483 | 332 | 92 | 116 | 1,023 |
| Kingston upon Thames | 498 | 146 | 109 | 28 | 781 |
| Lambeth | 802 | 1358 | 123 | 37 | 2,320 |
| Lewisham | 851 | 1073 | 102 | 18 | 2,044 |
| Merton | 518 | 318 | 128 | 15 | 979 |
| Newham | 910 | 816 | 566 | 22 | 2,314 |
| Redbridge | 567 | 447 | 437 | 19 | 1,470 |
| Richmond upon Thames | 531 | 115 | 66 | 21 | 733 |
| Southwark | 942 | 1151 | 123 | 47 | 2,263 |
| Sutton | 568 | 181 | 79 | 5 | 833 |
| Tower Hamlets | 703 | 474 | 653 | 18 | 1,848 |
| Waltham Forest | 733 | 592 | 248 | 14 | 1,587 |
| Wandsworth | 796 | 712 | 173 | 31 | 1,712 |
| Westminster | 1175 | 668 | 243 | 369 | 2,455 |
| No detailed location provided | 211 | 158 | 90 | 13 | 472 |
| Total | 25,289 | 19,304 | 7,056 | 1,673 | 53,322 |
Notes:
- The data presented in these tables are based on Management Information and have not been reconciled with the MPS.
Table A5: Rates per suspect of (selected) police recorded violent crime, officer-defined ethnicity, MPS, by borough, year to March 2021
| Borough | White | Black | Asian | Other (including mixed | Total (excludes not stated) |
|---|---|---|---|---|---|
| Barking and Dagenham | 3.8 | 4.4 | 8.0 | * | 4.7 |
| Barnet | 2.1 | 3.4 | 4.2 | * | 2.9 |
| Bexley | 3.4 | 2.7 | 3.0 | * | 3.4 |
| Brent | 2.9 | 4.7 | 5.3 | * | 4.3 |
| Bromley | 5.6 | 4.2 | 4.1 | * | 5.3 |
| Camden | 4.9 | 6.5 | 8.4 | * | 6.1 |
| Croydon | 4.9 | 4.0 | 6.6 | * | 5.0 |
| Ealing | 3.2 | 5.4 | 5.3 | * | 4.6 |
| Enfield | 3.6 | 3.4 | 3.7 | * | 3.9 |
| Greenwich | 5.3 | 5.5 | 7.8 | * | 5.9 |
| Hackney | 3.4 | 4.1 | 7.6 | * | 4.4 |
| Hammersmith and Fulham | 3.8 | 5.4 | 6.4 | * | 5.0 |
| Haringey | 3.7 | 4.8 | 5.0 | * | 4.7 |
| Harrow | 3.2 | 5.3 | 5.7 | * | 4.6 |
| Havering | 5.1 | 4.0 | 5.5 | * | 5.0 |
| Hillingdon | 3.4 | 5.5 | 4.9 | * | 4.4 |
| Hounslow | 3.7 | 4.6 | 4.8 | * | 4.3 |
| Islington | 4.6 | 5.4 | 8.6 | * | 5.5 |
| Kensington and Chelsea | 5.1 | 6.5 | 7.8 | * | 6.4 |
| Kingston upon Thames | 4.9 | 5.5 | 5.8 | * | 5.5 |
| Lambeth | 4.5 | 6.5 | 6.4 | * | 6.1 |
| Lewisham | 3.1 | 3.3 | 4.1 | * | 3.5 |
| Merton | 3.7 | 3.7 | 6.4 | * | 4.3 |
| Newham | 6.2 | 6.3 | 9.5 | * | 7.4 |
| Redbridge | 5.3 | 4.1 | 8.5 | * | 6.0 |
| Richmond upon Thames | 3.6 | 4.6 | 6.3 | * | 4.3 |
| Southwark | 5.4 | 6.5 | 8.0 | * | 6.5 |
| Sutton | 4.7 | 3.4 | 4.9 | * | 4.6 |
| Tower Hamlets | 4.5 | 5.4 | 14.4 | * | 8.5 |
| Waltham Forest | 5.1 | 5.5 | 10.6 | * | 6.5 |
| Wandsworth | 3.0 | 4.3 | 4.6 | * | 4.0 |
| Westminster | 5.7 | 6.8 | 10.3 | * | 7.1 |
| Total | 4.7 | 5.5 | 8.2 | * | 5.8 |
Notes:
- The data presented in these tables are based on Management Information and have not been reconciled with the MPS.
-
PFA responsible for conducting the search, including searches that took place outside of the PFA. ↩
-
The associated legislation includes stop and search powers under section 47 of the Firearms Act 1968, section 23 of the Misuse of Drugs Act 1971, section 43 of the Terrorism Act 2000 as well as other legislation. ↩
-
Race Disparity Unit - Research and Analysis: Stop and search data and the effect of geographical differences - GOV.UK (www.gov.uk) ↩
-
See Table A4 of the Crime in England and Wales: Appendix tables - Office for National Statistics (ons.gov.uk) ↩
-
Greater Manchester Police (GMP) were only able to provide robust stop and search data for part of the year ending March 2020. Their stop and search data has been removed from all year-on-year comparisons, to provide a consistent time series. ↩
-
For more information on crime trends in the year ending March 2021, see Crime in England and Wales: year ending March 2021 ↩
-
Metropolitan Police stop and search dashboard: Stop and search dashboard - Metropolitan Police ↩
-
Risk-Adjusted Disparity Index: Equal Protection by Race with Stop and Frisk: a Risk-Adjusted Disparity (RAD) Index for Balanced Policing - SpringerLink ↩
-
Excludes vehicle searches and searches where a person’s ethnicity was not stated. Based on 2020 GLA estimates. ↩
-
Police powers and procedures statistics: Police powers and procedures England and Wales statistics - GOV.UK (www.gov.uk) ↩
-
Race Disparity Unit - Research and Analysis: Stop and search data and the effect of geographical differences - GOV.UK (www.gov.uk) ↩
-
For the full report, see Policing the Pandemic ↩
-
Population figures: Population denominators by broad ethnic group and for White British, local authorities in England and Wales: 2011 to 2019 - Office for National Statistics (ons.gov.uk) ↩
-
Risk-Adjusted Disparity Index: Equal Protection by Race with Stop and Frisk: a Risk-Adjusted Disparity (RAD) Index for Balanced Policing - SpringerLink. The RAD was developed by Professor Lawrence Sherman at the Cambridge Centre for Evidence-Based Policing. ↩
-
The nature of violent crime in England and Wales: Year ending March 2020: The nature of violent crime in England and Wales - Office for National Statistics (ons.gov.uk) ↩
-
Violent crime presented in this analysis includes offences such as murder, assault and threats to kill. See Data Quality and Methodology section for more detail. ↩
-
Where a person is suspected of committing an offence, Guidance 10A of Code C of the Codes of Practice to the Police and Criminal Evidence Act 1984 requires there to be some reasonable, objective grounds, based on known facts or information, which are relevant to the likelihood that the offence has been committed and the person to be questioned committed it. ↩
-
Geographical information for offenders is provided on the individual court which may not always be where the stop and search of crime took place. ↩
-
Office of Justice Programs: Face Value? Evaluating the Accuracy of Eyewitness Information - Office of Justice Programs (ojp.gov) ↩
-
Section 1 of the Police and Criminal Evidence (PACE) Act 1984 and associated legislation ↩
-
LSOAs have an average population of 1,500 people or 650 households. ↩
-
R represents the correlation coefficient and is always between -1 and 1. A value closer to 1, indicates that the two variables being observed are positively associated, e.g. in this example, violent crime hotspots tend to be found in similar areas to stop and search hotspots. ↩
-
Section 60 of the Criminal Justice and Public Order Act (CJPOA) 1994. ↩
-
Race Disparity Unit - Research and Analysis: Stop and search data and the effect of geographical differences - GOV.UK (www.gov.uk) ↩
-
Population figures: Ethnic group population projections - London Datastore. These figures have been calculated using the 2016-based central figures. ↩
-
Population figures: Population denominators by broad ethnic group and for White British, local authorities in England and Wales: 2011 to 2019 - Office for National Statistics (ons.gov.uk) ↩
-
Minsitry of Justice: Ministry Justice convictions data ↩
-
Home Office Annual Data Requirement: Annual data requirement from police forces in England and Wales - GOV.UK (www.gov.uk) ↩
-
See Table A4 of the Crime in England and Wales: Appendix tables - Office for National Statistics (ons.gov.uk) ↩