DCMS Sectors Skills Shortages and Skills Gaps Estimates: 2019 - Technical and quality assurance report
Published 20 January 2022

© Crown copyright 2022
This publication is licensed under the terms of the Open Government Licence v3.0 except where otherwise stated. To view this licence, visit nationalarchives.gov.uk/doc/open-government-licence/version/3 or write to the Information Policy Team, The National Archives, Kew, London TW9 4DU, or email: psi@nationalarchives.gov.uk.
Where we have identified any third party copyright information you will need to obtain permission from the copyright holders concerned.
This publication is available at https://www.gov.uk/government/statistics/dcms-sectors-skills-shortages-and-skills-gaps-2019/dcms-sectors-skills-shortages-and-skills-gaps-estimates-2019-technical-and-quality-assurance-report
This document covers the following topics:
- an overview of the content covered in the statistical release ‘DCMS Sectors Skills Shortages & Skills Gaps Estimates: 2019, UK (excl. Scotland)’
- an overview of DCMS Sectors, how they are defined, and limitations of these definitions
- the methodology underlying the statistical release, including data sources
- the processes used to check that the estimates have been produced correctly
- other sources of information for the DCMS sectors
- further information, including contact details for DCMS statisticians.
1. Overview of release
This is the technical and quality assurance report for the statistical release ‘DCMS Sectors Skills Shortages & Skills Gaps Estimates: 2019, UK (excl. Scotland)’.
This is the first release of its kind for the DCMS sectors. It calculates estimates on skill shortages and skills gaps for the DCMS sectors, using the Department for Education (DfE) Employer Skills Survey , which runs every two years (biennially) and whose most recently available year is 2019. These estimates were developed to aid the DCMS in measuring its Outcome Delivery Plan (ODP). The ODP was published in summer 2021, and included a commitment to develop an estimate for skills in the DCMS sectors
This release publishes estimates on five questions in the survey. These are published in statistical tables as Experimental Official Statistics . However, there is scope for these statistics, as Experimental, to evolve over time. The questions are:
- Percentage of businesses (a.k.a employers) with a vacancy that was proving hard to fill due to applicants not having the right skills, qualifications and experience (a.k.a skill-shortage vacancy)
- Percentage of businesses with a vacancy
- Percentage of businesses where at least one member of staff is judged to be not fully proficient in their role (a.k.a skills gap)
- Percentage of total vacancies that are proving hard to fill due to applicants not having the right skills, qualifications and/or experience (a.k.a skill-shortage vacancy)
- Percentage of total workforce that are judged to be not fully proficient in their role (a.k.a skills gap)
Estimates are published for DCMS sectors, sub-sectors and the Audio Visual sector. They are also broken down by region. However, this does not include Scotland, as in 2019 Employer Skills for Scotland was covered by the Scottish Employer Skills Survey published by the Scottish Government.
The methodology used to produce the estimates in this publication is consistent with national (UK) estimates, published by the Department for Education (DfE).
1.1 Code of Practice for Statistics
‘DCMS Sectors Skills Shortages & Skills Gaps Estimates: 2019, UK (excl. Scotland)’ is an experimental official statistic and has been produced to the standards set out in the Code of Practice for Statistics. They are classed as experimental as it is the first time DCMS has published estimates of the proportion of people employed in DCMS sectors.
1.2 Users
The users of these statistics fall into five broad categories:
- Ministers and other political figures
- Policy and other professionals in DCMS and other Government departments
- Industries and their representative bodies
- Charitable organisations
- Academics
The primary use of these statistics is to monitor the performance of the industries in the DCMS sectors, helping to understand how current and future policy interventions can be most effective.
2. Sector definitions
This chapter looks at the definition of DCMS sectors, sub-sectors and related areas. These definitions, used in the DCMS Sectors Skills Shortages and Skills Gaps statistical publication, are also used in the DCMS Sectors Economic Estimates series.
2.1 Overview of DCMS Sectors
Main sector definitions
The sectors for which DCMS has responsibility are:
- Civil Society
- Creative Industries
- Cultural Sector
- Digital Sector
- Gambling
- Sport
- Telecoms
- Tourism
In order to measure the economic impact of a sector it is important to be able to define it. DCMS uses a range of definitions based on International or UK agreed definitions. All definitions are based on the Standard Industrial Classification 2007 (SIC) codes. This means nationally consistent sources of data can be used and enables international comparisons.
Individual sector definitions were developed in isolation as the department’s remit expanded. This has led to overlap between DCMS sectors. For example, the Cultural Sector is defined using SIC codes that are nearly all within the Creative Industries, whilst the Telecoms Sector is completely within the Digital Sector.
Figure 1 (below) shows the overlap between DCMS Sectors in terms of SIC codes. Users should note that this does not give an indication of the magnitude of the overlap.
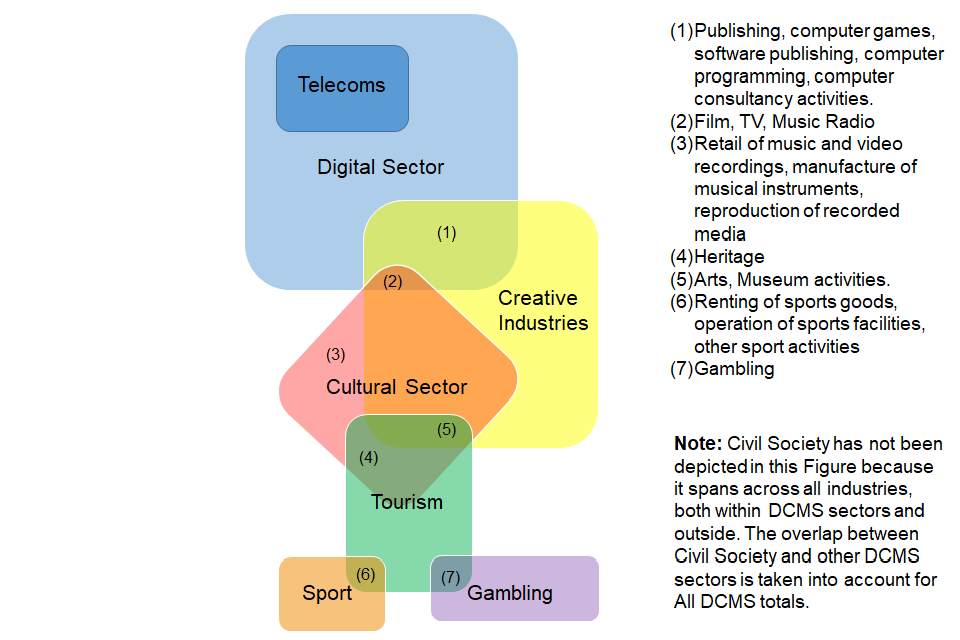
Figure 1: Overlap of SIC codes within DCMS Sectors
2.2 Details and limitations of sector definitions
This section looks at sector definitions in more detail, and provides an overview of limitations.
There are substantial limitations to the underlying classifications. As the balance and make-up of the economy changes, the SIC, finalised in 2007, is less able to provide the detail for important elements of the UK economy related to DCMS Sectors. The SIC codes used to produce these estimates are a ‘best fit’, subject to the limitations described in the following section.
Civil Society
In July 2016, DCMS took on responsibility for the Office for Civil Society (renamed Civil Society and Youth in January 2021), which covers charities, voluntary organisations or trusts, social enterprises, mutuals and community interest companies. The Civil Society sector is not like a traditional industry and therefore data are not always readily available in the usual data sources.
Estimates of skills shortages and skills gaps for the Civil Society sector were evaluated by focusing on businesses that defines its “Type of establishment” as “A charity or voluntary sector organisation or a social enterprise”. It therefore may not cover the full spectrum of Civil Society organisations (e.g. it may not cover mutual and community interest companies), and may classify as an underestimate for the sector.
Creative Industries
The Creative Industries were defined in the Government’s 2001 Creative Industries Mapping Document as “those industries which have their origin in individual creativity, skill and talent and which have a potential for wealth and job creation through the generation and exploitation of intellectual property”.
To allow the Creative Industries to be measured, DCMS worked with others to develop a statistical definition of the Creative Industries which reflects this definition. DCMS uses a “Creative Intensity” to determine which industries (at 4 digit SIC) are Creative. The Creative Intensity is the proportion of occupations in an industry that are creative and, if the intensity is above a set threshold, that industry is typically defined as Creative. More information can be found in this 2016 methodology document.
Cultural Sector
There are significant limitations to the DCMS measurement of the cultural sector arising from the lack of detailed disaggregation possible using the standard industrial classifications. There are many cases where culture forms a small part of an industry classification and therefore cannot be separately identified and assigned as culture using standard data sources. DCMS consulted on the definition of the Cultural sector and published a response in April 2017.
It is recognised that, due to the limitations associated with SIC codes, the SIC code used in past publications as a proxy for the Heritage sector (91.03 - Operation of historical sites and building and similar visitor attractions) is likely to be an underestimate of this sector’s value. We have changed the name of the Heritage sector to ‘Operation for historical sites and similar visitor attractions’ to reflect this.
Digital Sector
The definition of the Digital sector used by DCMS is based on the OECD definition of the ‘information society’. This is a combination of the OECD definition for the “ICT sector” as well as including the definition of the “content and media sector”. An overview of the SIC codes included in each of these sectors is available in the OECD Guide to Measuring the Information Society 2011 (see Box 7.A1.2 on page 159 and Box 7.A1.3 on page 164).
This definition used for the Digital Sector does not allow consideration of the value added of “digital” to the wider economy e.g. in health care or construction. DCMS policy responsibility is for digital across the economy and therefore this is a significant weakness in the current approach.
Gambling
The definition of gambling used in the DCMS Sectors Economic Estimates is consistent with the internationally agreed definition, SIC 92, Gambling and betting activities.
Sport
The main definition of sport used in the release is based on the EU agreed core/statistical Vilnius definition, which includes only SIC codes which are predominately sport.
2.3 Tourism
The Tourism figures in this skills release are based on a “Tourism industries” approach, which counts any establishment for which the principal activity is a tourism characteristic activity, i.e. it includes 100% of the businesses in a subset of the standard industrial classes. As such, the estimates for the Tourism industries in this release are larger than they might otherwise have been under a “Satellite Account” approach - where an estimate of business activity directly attributable to Tourism is applied.
A “Satellite Account” approach is used in some other economic estimates of DCMS sectors (e.g. gross value added and employment estimates). Therefore, the Tourism estimate will account for a greater proportion of the DCMS sector total in these statistics than in some of the other DCMS statistical publications that look at the sector.
3. Methodology
3.1 Method
The ‘DCMS Sectors Skills Shortages & Skills Gaps Estimates: 2019, UK (excl. Scotland)’ estimates are calculated using the Department for Education (DfE) Employer Skills Survey (ESS). The latest iteration, Employer Skills Survey 2019 (ESS 2019), gathered labour market intelligence (LMI) on employer skills needs and training activity among employers in England, Northern Ireland and Wales. It is the fifth in the biennial series of Employer Skills Surveys dating back to 2011 collecting LMI from multiple countries of the UK, although unlike the four earlier studies ESS 2019 does not include employers in Scotland.
As in previous years, the 2019 Employer Skills Survey had two main elements:
- The core survey: covering such topics as recruitment, skills gaps, training and workforce development, upskilling needs, vocational qualifications, apprenticeships and traineeships.
- The Investment in Training follow-up survey: covering the investment establishments make in training their staff.
For DCMS , we have used the core survey for this work. The questions we are publishing statistics for are:
- Percentage of businesses (a.k.a employers) with a vacancy that was proving hard to fill due to applicants not having the right skills, qualifications and experience (a.k.a skill-shortage vacancy)
- Percentage of businesses with a vacancy
- Percentage of businesses where at least one member of staff is judged to be not fully proficient in their role (a.k.a skills gap)
- Percentage of total vacancies that are proving hard to fill due to applicants not having the right skills, qualifications and/or experience (a.k.a skill-shortage vacancy)
- Percentage of total workforce that are judged to be not fully proficient in their role (a.k.a skills gap)
The 4-digit SIC industry is recorded for responding businesses – which are surveyed at the establishment level, not the organisation level – and we therefore sum vacancies, skill shortage vacancies and skill gaps across these SIC codes, and by region, to get the relevant sector (and sub-sector) estimates. To ensure estimates are representative of the business population, the first three questions above are weighted by business population; and the last two are weighted by business employment estimates. More information on the weighting is set out in the Employer Skills Survey 2019 Technical Report, published by DfE. The percentage values are then derived by, for example, dividing businesses with a skill shortage vacancy by all businesses; or by dividing skill shortage vacancies by all vacancies, broken down by sectors and regions as above.
As part of the aggregation process we also apply disclosure control measures to reduce the risk of identification of any respondents. Where the number of respondents for a cell is below a set threshold the value is suppressed. The threshold number is that at minimum 30 businesses must contribute to the answer.
3.2 Summary of data sources
In summary, the data presented in this release:
- are based on official statistics data sources
- are based on internationally-harmonised codes
- are based on survey data and, as with all data from surveys, there will be an associated error margin surrounding these estimates[footnote 1]
This means the estimates are:
- comparable at both a national and international level.
- comparable over time, allowing trends to be measured and monitored
However, this also means the estimates are subject to limitations of the underlying classifications of the make-up of the UK economy. For example, the standard industrial classification (SIC) codes were developed in 2007 and have not been revised since. Emerging sectors, such as Artificial Intelligence, are therefore hard to capture and may be excluded or mis-coded.
4. Quality assurance processes
This document summarises the quality assurance processes applied during the production of these statistics by our data providers, the Department for Education (DfE), as well as those applied by DCMS.
4.1 Quality assurance processes at DfE
Quality assurance at DfE takes place at a number of stages. The various stages and the processes in place to ensure quality for the data sources are outlined below. It is worth noting that information presented here on the data sources are taken from the Employer Skills Survey 2019 technical report and should be credited to the DfE and appropriate suppliers.
4.2 DfE Employer Skills Survey
The Employer Skills Survey 2019 (ESS 2019) gathered labour market intelligence (LMI) on employer skills needs and training activity among employers in England, Northern Ireland and Wales. It is the fifth in the biennial series of Employer Skills Surveys dating back to 2011 collecting LMI from multiple countries of the UK, although unlike the four earlier studies ESS 2019 does not include employers in Scotland, who are now covered by the Scottish Employer Skills Survey.
4.3 Sampling
Sampling Frame
The sampling unit was at an establishment level, rather than at an organisation level (establishment, employer and business are therefore used interchangeably in this statistical publication). This is in recognition of the influence that local labour markets have on skill issues and the fact that skills issues are felt most acutely at the site level. This mirrored the establishment-based approach adopted in previous UK Employer Skills Surveys and the UK Employer Perspectives Surveys, as well as the legacy skills surveys in each nation. The individual sought at each establishment was the person who had most responsibility for staff issues such as training, recruitment or resourcing. For smaller establishments this was most often the general manager or owner, and for larger establishments this was most often the HR manager.
Market Location was used as the principal sample source of ESS 2019, supplemented with ‘top up’ sample ordered direct from the ONS Inter-Departmental Business Register (IDBR). The IDBR was not used as the primary sample source for ESS 2019 (nor any of the previous iterations of the survey) as the majority of records in the IDBR do not come with a telephone number. To use the IDBR as the primary source of sample would not be desirable since the telematching exercise typically finds a telephone number for less than three in ten of the establishments on the IDBR.
Listed below are the 2-digit and 4-digit SIC codes included in the request for top up sample from the IDBR (* indicates that the SIC grouping was also included in the IDBR order for the 2017 survey):
- Agriculture (SIC 01 to 03)*
- Mining and Quarrying (SIC 05 to 09)*
- Electricity, Gas and Water (SIC 3 5 to 39)*
- Construction (SIC 41 to 43)*
- Public Administration and defence (SIC 84)*
- Telecommunications (SIC 61)*
- Information Service Activities (SIC 63)
- Gambling and betting activities (SIC 92)*
- Agents involved in the sale of textiles, clothing, fur, footwear and leather goods (SIC 4616)*
- Wholesale of perfume and cosmetics (SIC 4645)*
- Computer programming activities (SIC 6201)*
- Computer consultancy activities (SIC 6202)*
- Other monetary intermediation SIC (6419)
- Security and commodity contracts brokerage (SIC 6612)
- Activities of insurance agents and brokers (SIC 6622)
- Fund management activities (SIC 6630)
- Management of real estate on a fee or contract basis (SIC 6832)*
- Activities of head offices (SIC 7010)*
- Business and other management consultancy activities (SIC 7022)
- Specialised design activities (SIC 7410)
- Other professional, scientific and technical activities (SIC 7490)
- Private security activities (SIC 8010)*
- Combined facilities support activities (SIC 8110)*
- Residential nursing care activities (SIC 8710)*
- Residential care activities for learning difficulties, mental health and substance abuse (SIC 8720)*
- Residential care activities for the elderly and disabled (SIC 8730)
- Social work activities without accommodation for the elderly and disabled (SIC 8810) *
- Child day-care activities (SIC 8891)*.
Sample was ordered from Market Location at an average ratio of around 7:1 against target interviews required. Due to the availability of sample this varied between quota cells from 3:1 (Public Administration in the Northern Ireland) to 11:1 (Financial Services in the North West); the lower ratios reflecting the fact that for some quota cells the entirety of available sample was ordered. The 7:1 average ratio was chosen to balance maintaining high response rates with fieldwork efficiency, with calculations based also upon research into the efficiency of cells in the 2017 iteration of ESS.
A total of 610,000 records were ordered from Market Location for fieldwork. A total of 272,000 records were drawn from the IDBR, the entirety of sample available for the SIC codes selected for top-up. These records were checked against the Market Location sample for duplicate records using a combination of company name and postcode. This left 181,000 of the IDBR records eligible for inclusion. Since the IDBR records received did not include telephone numbers, these were sourced using a combination of automated and manual directory look-ups (47,000 records were successfully telematched). A second round of checks for duplicates against the Market Location sample was carried out, this time factoring telephone numbers into the duplication checks, which left 40,000 IDBR records. All sample records were postcode-validated to ensure that geographical regions had been correctly assigned. Checks were also undertaken in instances where duplicate telephone numbers existed within the sample.
In certain sectors, such as retail and finance, it is common for different establishments to appear under the same centralised telephone number. Such establishments were marked up on the sample ‒ with the address of the sampled establishment displayed on-screen ‒ so that interviewers would be aware that the telephone number they were calling was a centralised switchboard and thus they would need to request to be transferred to a particular site. 13 In total, 583,000 records were loaded for fieldwork, from the 651,000 that were drawn from Market Location and the IDBR.
4.4 Sample design
Quota targets were set by geography, size and sector using interlocked size and sector targets within Northern Ireland, Wales and each English region with one exception, the West Midlands, where a non-quota approach was adopted. The key difference explaining this was that in the West Midlands interviews were attempted to be completed with all sample that was loaded, whereas in other regions/nations once a quota target had been reached, remaining sample in that category could be removed and no longer called. This sample was not always removed; if it was proving difficult to meet other size by sector quota targets, then some of the initial size by sector targets were increased. Hence there was some, albeit limited, flexibility within quota targets.
Matching the previous iterations of the survey, ESS 2019 adopted a disproportionate stratified random sampling strategy such that the quota targets set intentionally oversampled some groups and undersampled others, rather than setting targets in direct proportion to the business population. In practice this means that some smaller subgroups of employers (such as large establishments) are oversampled to ensure that a sufficiently large number of interviews are achieved to allow for robust sub-group analyses. Some of the initial quota targets were adjusted towards the end of fieldwork due to the available sample being exhausted, but sample ‘substitutions’ (i.e. the introduction of new sample outside of the initial sample drawn) were not made.
For sample outside of the West Midlands, purposive geographic quota targets were set, followed by size targets within these regions that struck a balance between oversampling larger employers (relative to the population), whilst not skewing the size profile too far away from smaller establishments. Finally, after setting targets by employer size, targets were set by sector within each size band, in proportion to the establishment population within each size band.
Population statistics used to stratify the business population were established through the March 2018 Inter-Departmental Business Register (IDBR), which was the latest available at the time. The IDBR is administered by the Office for National Statistics (ONS), which holds records of all businesses registered for VAT and all businesses operating a pay as you earn (PAYE) income tax scheme. The IDBR is widely regarded as being the most accurate and comprehensive ‘official’ source of business population data available, and was used for sampling and weighting in all previous editions of the Employer Skills Surveys and in the nation-specific legacy skills surveys.
Data collection
Fieldwork A total of 81,013 interviews were conducted by telephone using computer-assisted telephone interviewing (CATI) systems. Fieldwork was conducted by three research agencies (IFF Research, BMG Research and Ipsos MORI). As lead contractor, a member of the IFF team was involved in checking the CATI script programming undertaken by each agency to ensure consistency across all three contractors.
| Region (International Territorial Level code) | Number of interviews |
| North East (TLC) | 5302 |
| North West (TLD) | 8140 |
| Yorkshire and The Humber (TLE) | 7173 |
| East Midlands (TLF) | 6759 |
| West Midlands (TLG) | 6521 |
| East (TLH) | 8111 |
| London (TLI) | 10111 |
| South East (TLJ) | 10070 |
| South West (TLK) | 8030 |
| Wales (TLM) | 6773 |
| Northern Ireland (TLN) | 4023 |
4.5 Validation and quality assurance
Data Edits
It was recognised at the outset that the ESS questionnaire involved the collection of some complex data that respondents would possibly struggle to answer. There was also, despite stringent quality control, the chance that interviewers may enter typing errors, for example accidentally entering extra zeros on the end of numerical variables.
Data checks were built into the CATI script to ensure, for example, that questions breaking down the workforce into by occupation equalled the number of people working at the site, and that the number of staff in each job role who were not proficient could not exceed the number of staff they had in each job role. However, some data validation needed to occur after fieldwork had finished to ensure no errors were present in the final data. Guidelines were issued to all fieldwork contractors on how to edit data to ensure consistency; these guidelines can be seen in Appendix H of the DfE Employer Skills Survey technical report.
Coding
Open ended responses to the survey were coded by each contractors’ coding teams. To ensure consistency the codeframes were developed in unison, with codeframes regularly compared and reviewed. As lead contractor IFF Research took the final decisions as to what codes to use after considering advice and outputs from the IFF, BMG and Ipsos MORI coding teams. Standard Industrial Classifications (SIC) were coded using 2007 standards (the most up to date at the time of the survey), and Standard Occupational Classifications were coded using 2010 standards (also the most up to date available - after the survey had concluded and much of the data prepared, the 2020 Standard Occupational Classification standards were published).
Quality
Accuracy is the degree of closeness between an estimate and the true population value. As the ESS is a sample survey, it provides estimates of business population characteristics rather than exact measures. In principle, many random samples could be drawn and each would give different results, due to the fact that each sample would be made up of different people, who would give different answers to the questions asked. The spread of these results is the sampling variability.
Confidence intervals are used to present the sampling variability. For example, with a 95% confidence interval, it is expected that in 95% of survey samples, the resulting confidence interval will contain the true value that would be obtained by surveying the whole business population. For the ESS, confidence intervals are calculated by treating the percentage estimates as a binomial distribution (either a vacancy is a skills shortage vacancy, or it isn’t) with approximate normal distribution qualities, in line with the Central Line Theorem (CLT). Where the confidence interval falls below zero, it is capped at the zero lower bound (as percentages cannot be less than zero by definition).
Comparability is the degree to which data can be compared over time and domain, coherence is the degree to which data are derived from different sources or methods but refer to the same topic and are similar. Some sources provide data that overlap with APS data on employment, unemployment and earnings.
The ESS is arguably the most robust piece of regular government research covering skills and has an advantage of SIC code breakdowns. This enables us to derive estimates across the breadth of DCMS Sectors using definitions that are consistent with other work on our sectors (in particular, the DCMS Sectors Economic Estimates), and this consistency is likely to remain over time. This includes an estimate for the Civil Society sector, as there is a question which asks if an establishment’s main activity is as “a charity or voluntary sector organisation or a social enterprise”. However, as mentioned earlier, it may be an underestimate for Civil Society as a whole, as it may not include mutuals or community interest companies.
4.6 Quality assurance processes at DCMS
The majority of quality assurance of the data underpinning the ‘DCMS Sectors Skills Shortages & Skills Gaps Estimates: 2019, UK (excl. Scotland)’ release takes place at DfE, through the processes described above. However, further quality assurance checks are carried out within DCMS at various stages.
Production of the report is typically carried out by one member of staff, whilst quality assurance is completed by at least one other, to ensure an independent evaluation of the work.
4.7 Data requirements
For the ESS data, DCMS discusses its data requirements with DfE and these are formalised in a Data Access Agreement (DAA). The DAA covers which data are required, the purpose of the data, and the conditions under which DfE provide the data. Discussions of requirements and purpose with DfE improve the understanding of the data at DCMS, helping us to ensure we receive the correct data and use it appropriately.
Checking of the data delivery
For the ESS data, DCMS checks that the data delivered by DfE match what is listed in the Data Access Agreement (DAA). For this particular release we check that:
- We have received all data, with particular focus on all data at the 4 digit SIC code level from the core survey, which is required for us to aggregate up to produce estimates for our sectors and sub-sectors. As we are publishing a new statistic for DCMS, it was necessary to work with data owners at DfE to scope out the work. This included:
- Checking how the calculation is done, with particular focus on disclosure control processes and confidence interval uses
Data analysis
At the analysis stage, data are aggregated up to produce information about DCMS sectors and sub-sectors. For these estimates, table production was carried out in the programming language R as part of the automation work being undertaken in DCMS. However, as it was a new set of statistics, the calculation was “dual run” in another software package, SPSS, combined with Excel. This was to see if the figures matched across the two.
Once tables were produced the statistics lead also completed the following checks:
- “Sense checks” of the data. E.g.:
- Do the UK totals match the ESS published figures?
- Looking at any large differences between the data and possible causes of these .
Quality assurance of data analysis
Once analysis is complete, DCMS document the checks needed for quality assurers to carry out. The checks cover:
- Ensuring the correct data are used for the analysis.
- Checking that the correct SIC codes have been aggregated together to form DCMS sector (and sub-sector) estimates. Are all SIC codes we require included? Are there any non-DCMS SIC codes that have been included by accident?
- Making sure it is not possible to derive disclosive data from the figures that will be published.
- Making sure the correct data has been pasted to the final tables for publication, are accessible, formatted correctly, and have appropriate documentation.
Dissemination
Finalised figures are disseminated within Excel tables published on GOV.UK, with summary text on the webpage. These are produced by the statistics lead who, beforehand, checks with DfE colleagues on details of how to interpret the statistics . Before publishing, a quality assurer checks the figures match between the tables and the Gov.Uk page summary. The quality assurer also makes sure any statements made about the figures (e.g. regarding trends) are correct according to the analysis and checks for spelling or grammar errors.
5. External data sources
It is recognised that there are always different ways to define sectors, but their relevance depends on what they are needed for. Government generally favours classification systems which are
- rigorously measured,
- internationally comparable,
- nationally consistent, and
- ideally applicable to specific policy interventions.
These are the main reasons for DCMS constructing sector classifications from Standard Industrial Classification (SIC) codes. However, DCMS accepts that there are limitations with this approach and alternative definitions can be useful where a policy-relevant grouping of businesses crosses existing Standard Industrial Classification (SIC) codes. DCMS is aware of other estimates relevant to DCMS Sectors. These estimates use various methods and data sources, and can be useful for serving several purposes, e.g. monitoring progress under specific policy themes such as community health or the environment, or measuring activities subsumed across a range of SICs.
For skills estimates more broadly, the latest estimates for Scotland are covered by the Scottish Employer Skills Survey, published by the Scottish Government in 2020. This covers much the same ground as the DfE Employer Skills Survey: skill shortages, skills gaps, training and workforce development. However, there are also differences; for example, being published in 2020, it also included a question on Covid-19.
For skills estimates pertaining to DCMS, the Cyber Security Skills in the UK Labour Market Survey is a thorough research project which has been running annually since 2017 and looks at cyber security skills shortages and skills gaps in the UK labour market. The most recent report was published in March 2021. It uses the same definition as the ESS and some of the survey methodology is similar. However, as no SIC or SOC codes currently adequately identify cyber security roles the survey has evolved in a more bespoke fashion than the ESS, using a range of data sources (including web scraping) which can change from year to year.
In May 2021 the DCMS Office for Artificial Intelligence also published a research report on skills and the labour market in the artificial intelligence (AI) sectors, the Understanding the UK AI labour market: 2020 report. In a similar vein to the Cyber Security Skills in the UK Labour Market Survey, it looked at technical (AI and data science) and non-technical skill shortages and skills gaps in the labour market. It also looked more widely at recruitment and vacancies in the sector.
One of the data sources used in the Cyber Security Skills in the UK Labour Market Survey, and in the Understanding the UK AI labour market: 2020 report, is the Burning Glass Skills Database. This is a rich database of vacancies, collected using data science techniques (web scraping), across the UK, including information on job descriptions, remuneration, location, type, skills required etc. This has been collected with the aim of analysing skills requirements and how they are evolving in a timely manner. This information is published in the Burning Glass Data Skills Taxonomy issued by the company on a periodic basis at a cost.
It is recognised that there will be other sources of evidence from industry bodies, for example, which have not been included above. We encourage statistics producers within DCMS sectors who have not been referenced to contact the economic estimates team at evidence@dcms.gov.uk.
6. Further information
For enquiries on this release, please email evidence@dcms.gov.uk.
For general enquiries contact:
Department for Digital, Culture, Media and Sport
100 Parliament Street London
SW1A 2BQ
Telephone: 020 7211 6000
DCMS statisticians can be followed on Twitter via @DCMSInsight.
This release is an Experimental Official Statistics publication and has been produced to the standards set out in the Code of Practice for Statistics.
-
Sampling error is the error caused by observing a sample (as in a survey) instead of the whole population (as in a census). While each sample is designed to produce the “best” estimate of the true population value, a number of equal-sized samples covering the population would generally produce varying population estimates. This means we cannot say an estimate of, for example, 20% is very accurate for the whole population. Our best estimates, from the survey sample, suggest that the figure is 20%, but due to the degree of error, the true population figure could perhaps be 18% or 22%. This is not an issue with the quality of the data or analysis; rather it is an inherent principle when using survey data to inform estimates. ↩