Annexe 3
Published 28 July 2020

© Crown copyright 2020
This publication is licensed under the terms of the Open Government Licence v3.0 except where otherwise stated. To view this licence, visit nationalarchives.gov.uk/doc/open-government-licence/version/3 or write to the Information Policy Team, The National Archives, Kew, London TW9 4DU, or email: psi@nationalarchives.gov.uk.
Where we have identified any third party copyright information you will need to obtain permission from the copyright holders concerned.
This publication is available at https://www.gov.uk/government/publications/valuation-of-risks-to-life-and-health-monetary-value-of-a-life-year-voly/annexe-3
RQIII
Can a Value of a Life Year be derived which is compatible with a Quality-Adjusted Life Year (QALY) framework?
1. Introduction
As highlighted in RQII, respondents in contingent valuation studies may place different values on gains in life expectancy that are spent in different states of health. Therefore, in the context of this review, it is important to consider how we measure and value (health-related) quality of life and quality adjusted life years (QALYs) so that we can identify where there is compatibility between the Value of Life Year (VOLY) and QALY framework.
The use of QALYs as a measure of benefit is most commonly found in the evaluation of health interventions. Cost effectiveness analysis (CEA) (also referred to as cost utility analysis[footnote 1]) is the most common form of economic evaluation used to aid decisions about health care resources. In CEA, costs are expressed in monetary units and the outcome in non-monetary units and the central measure used is a cost effectiveness ratio. The cost effectiveness ratio measures the incremental cost and incremental benefit of one programme or treatment compared to a suitable alternative. CEA using QALYs as the outcome measure has been recommended by the National Institute for Health and Care Excellence (NICE) in its reference case for submissions for health technology assessment and appraisal (NICE, 2013). This is in contrast to other areas of the public sector where cost benefit analysis (CBA) is the predominant form of economic evaluation and where the VOLY (or Value of a Prevented Fatality [VPF]) expressed as monetary values have been developed as the main measures of benefit. It is important to highlight in this introduction that these alternative approaches to economic evaluation have been developed for health interventions and that in attempting to link CEA and CBA back together there has been much discussion around the use of a Willingness-To-Pay for a Quality Adjusted Life-Year (WTP-QALY) value to do this. Therefore, in section 2 of this chapter this link between CEA and CBA using a WTP-QALY value is further developed through a theoretical exposition of the QALY and the underlying assumptions required for the equivalence of CEA and CBA.
Section 3 presents the key methodological developments in WTP-QALY based on selected literature identified in RQI and expands on how these have developed out of the methods to elicit the VPF and VOLY. It could be the case that context impacts WTP-QALY, so in section 4, we review the empirical literature to examine what factors or attributes influence the value the general public assign to a QALY. Using the theory and evidence presented in these first 4 sections, the final section considers whether a VOLY could be derived which is compatible with the QALY framework.
2. What are Quality Adjusted Life Years (QALYs)?
2.1. Calculating QALYs
Before considering the WTP-QALY literature, it is worth providing more detail on what QALYs are and how they are calculated. This is important, as it will highlight key differences with the way life years are valued in the VOLY literature. In this section we first outline the basic premise of QALYs and the methods used, within the QALY framework, to measure quality of life.
The QALY is a multidimensional measure of health gain, which combines life years with an assessment of the quality of those life years. On the face of it, the QALY calculation is relatively straightforward, requiring only 2 pieces of information; the time spent in a given health state and the “quality weight” or “utility” experienced during that time. But, of course, from the point of entering a study, an individual’s health- related quality of life will vary over time and we are also interested, for decision making, in how this profile differs as result of receiving one intervention over a comparator such as “usual care” or “doing nothing”. The QALY gain from an intervention, therefore, is calculated by multiplying time spent in a health state by the utility associated with that state, summed across time spent in different health states subsequent to the intervention and, over the course of a life or a defined study period, comparing that profile to what would have happened had the person (or group of people) not received the intervention of interest. Therefore, to calculate the number of QALYs that would arise from an intervention it is necessary to have data on the “utilities” attached to different health states. Different to the standard economic notion of utility, these health- state utility values are measured on a scale from 0 to 1, where 0 represents a state as bad as being dead and 1 represents perfect/full health (Brazier et al., 2017). It is also possible to have states worse than death, valued below 0. Using this weighting scale, one QALY is equal to one year in full health or, say, 2 years in a health state valued as 0.5. Thus, for any individual living Y years in less than full health this can be equated to X years in full/perfect health when X<Y (Loomes and McKenzie, 1989).
There are several methods that can be used to determine the utility of a given health state. The 3 most common measures, involving direct elicitation of preferences from individuals, are the visual analogue scale (VAS), time trade-off (TTO) and standard gamble (SG) (Torrance, 1986), further details on each of these approaches can be found in Appendix A.
Alternatively, generic questionnaires that allow for measurement of health-related quality of life have been developed and ‘pre-scored’, based on a survey of the general population, using the same preference elicitation methods mentioned previously. This makes it easier to collect the data on health-related quality of life (usually over time), apply the pre-determined utility scores to different health states and, thus, to calculate QALY profiles. The term ‘generic’ refers to multi-attribute health state classification systems which can be applied to any decision-making scenario involving the potential generation of health benefits, and thus QALY gains. The most common such system is the EuroQol EQ-5D. The EQ-5D descriptive system has 5 health domains (mobility, self-care, usual activities, pain or discomfort, anxiety or depression). A 3-level system was developed first, using the TTO to calculate the utility values for the pre-scored tariff. A 5-level system[footnote 2] was recently developed using TTO and discrete choice methods (Devlin et al., 2017). Health states can be described using the descriptive system, generally presented as the level on each domain; for example 11111 describes ‘no problems’ on the 5 domains. A utility value is then assigned to each health state described in this way using a pre-scored tariff estimated based on values from surveys of the general public (Devlin et al., 2017). Tariffs now exist for 12 countries including England (available from EuroQoL– Valuation: Standard value sets). In addition to the EQ-5D tariffs for health states, population norms exist for the UK. Respondents in the original UK valuation survey were asked to report their health status using the EQ-5D descriptive system and the resulting scores have been computed by age/gender and can be used as a reference point as a ‘typical’ health state utility score (Kind et al., 1999). These were elicited from 3395 members of the general public using the EQ-5D 3 Level version, again using TTO.
It is not a requirement to measure health state utilities using the EQ-5D, or use the associated population tariffs and, as described in the review of the existing WTP-QALY literature (RQI), only 4 of the 21 studies used the EQ-5D tariff values to elicit utility values. It was more common, however, to describe health states using the EQ-5D descriptive system but directly elicit individuals’ own utility values for those states using SG, TTO or the VAS.
2.2. Economic underpinnings of QALYs
In the sub-section above it was assumed that the QALY is an accurate representation of an individual’s utility function for health. However, this is not necessarily the case. This section presents the assumptions that are needed for QALYs to represent individual preferences for health.
First, consider the case of chronic health states, where an individual has to make a decision under risk. Using expected utility theory as the basis, there are 3 main assumptions which must hold so that an individual’s expected utility function can be written as their utility function over health quality, i.e:
Equation 1
U(q,t) = H(q)*t
Where U(q,t) is some utility function over a chronic health state where q is health status and t is years. H is a utility function over health status (Bleichrodt and Pinto-Prades, 2006).
Pliskin et al. (1980) set out 3 main assumptions which ensure that equation 1 holds. The first assumption is mutual utility independence. This can be further sub- divided into utility independence of health status over life expectancy and utility independence of life expectancy over health status. Taking the case where life expectancy is independent of health status, this means that if an individual in a given health state (call it h) is indifferent between 2 prospects, for example, between 2 years in that state for sure and a 50-50 chance between 1 year and 4 years in the given state, then the individual would also be indifferent between the 2 prospects if all the years were experienced in an alternative health state (call it h’). Utility independence of health status from life expectancy means that individuals’ preferences over the 2 prospects when life expectancy is kept fixed do not depend on the level at which it is kept fixed (Bleichrodt and Pinto-Prades, 2006). This condition implies that H(q) can be multiplied by t (Wakker, 1996).
The second assumption is constant proportional trade-offs. This assumption requires that the proportion of remaining life years that an individual would give up for an improvement in health quality does not depend on the absolute number of remaining life years involved (Pliskin et al., 1980). For example, if an individual is indifferent between living for T years in a health state h or living for t years in a different health state h’ where t<T, this indifference is not affected by changing the values of t and T proportionately (Brazier et al., 2007).
The third assumption imposed by Pliskin et al. (1980) was risk neutrality on life years. This states that for any fixed level of health status each prospect is equal to its expected value, i.e. a prospect giving 25 years in full health with a probability of 0.5 and 1 year with probability 0.5 is the same as a prospect which gives 13 years in full health for sure (Bleichrodt and Pinto-Prades, 2006).
The assumptions as set out by Pliskin et al. (1980) are based on the notion that the health states in question are chronic. If the health states are not chronic then it is the health profiles that are of interest. The health profile can be characterised as q = (q1, q2, qT) where qt is the health status in period t and T is the maximum number of periods. If the health status is allowed to vary over time the QALY model can be written as:
Equation 2
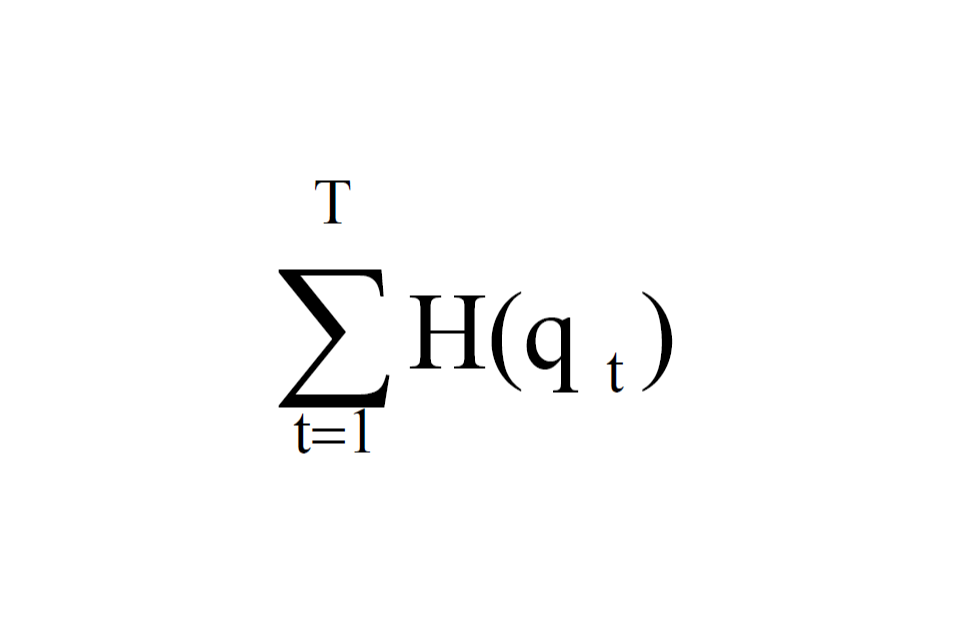
Sum the values of H(q t), where t=1 and T is the maximum number of periods.
where, q1, …qT are additively separable. This condition assumes that the utility of a health state is independent of the health state in the previous period or the one which follows afterwards (Brazier et al., 2007). The additive independence assumption means that the utility function can be written as:
Equation 3
UU(qq1, qq2, … . . qqqq) = ΣTTtt=1HH(qqqq)
The assumptions presented here are restrictive and have been subject to criticism following empirical testing. There have been a number of studies which have shown that individuals are risk averse with respect to life years rather than risk neutral (Cher et al., 1997, Oliver, 2005). Empirical evidence also rejects the assumption of constant proportional trade-offs. In a study by Sackett and Torrance (1978) it was found that the values people placed on a variety of health states depended on the duration of the states. Loomes and McKenzie (1989) note that no explicit allowance has been made for time preference in the QALY model presented above; thus, a given health state may be valued differently depending on when it occurs in time. They extend this analysis to incorporate the notion that the valuation of health states in future time periods may be associated with ‘thresholds’ in a person’s life cycle, where people place a different weight on good health depending on their life stage. When the model is extended for non-chronic health states, Spencer (2003) found that the assumption of additive independence was also violated.
2.3. Theoretical perspectives on WTP-QALY
As highlighted in the introduction to this chapter, QALYs are used as an outcome measure in CEA, which is in contrast to the VOLY which is used in CBA. However, if decisions about healthcare resource allocation are to be made on the basis of CEA then a value must be placed on the outcomes in the CEA in the form of a WTP-QALY, essentially making it equivalent to CBA (Phelps and Mushlin 1991). This equivalence depends on the existence of certain conditions. The first is that there is a constant WTP-QALY (Johannesson, 1995). However, at an individual level the marginal WTP- QALY is likely to be decreasing as the number of QALYs gained increases. At an aggregate level there is no reason to believe that WTP-QALY will be the same for all individuals, it is likely to differ between patient groups for example by age group or disease type. It would also differ depending on the size of the health improvement (Johannesson, 1995, Johannesson and O’Conor, 1997).
A second way to consider the equivalence of CEA and CBA is to derive the conditions under which CEA is consistent with life cycle preferences over health and consumption. CBA is always consistent with life cycle preferences for health and consumption, and, hence, if CEA (using QALYs as its outcome measure) can also be consistent with life cycle preferences for health and consumption the 2 will be equivalent. In the paper by Bleichrodt and Quiggin (1999), they propose that life cycle preferences over health and consumption are consistent with QALY maximisation if:
Equation 4
UU((cc1, h1), … . . (ccqq, hqq)) = ΣTTtt=1vv(cc)qq(hqq)
where c is consumption, h is health, v(c) is the utility function over consumption, q(h) is the utility of health status and t is the time period. This implies that utility of consumption is both constant over a life time and positive but creates ethical issues as it means for any given budget higher welfare gains can be made by allocating more resources to those with higher consumption levels.
Taking an axiomatic analysis of equation (4) which is more general as it allows consumption to vary over t, under expected utility theory the utility function has the form specified above if the preference relation satisfies the conditions of marginality, symmetry, standard gamble invariance and the zero condition. It is only if these conditions hold that we could suggest that QALY maximisation is consistent with life cycle preferences over health and consumption and therefore imply that CEA is equivalent to CBA (Bleichrodt and Quiggin, 1999). Dolan and Edlin (2002) critique this proposed equivalence based on constant consumption pointing out that this is a highly unrealistic situation because imperfections in credit markets prevent consumption smoothing and calculation of optimal consumption is impossible because of uncertainty over life expectancy. Without constant consumption the Bleichrodt and Quiggin model will not produce a constant WTP per QALY. Even if consumption smoothing is possible then constant consumption would also require lifetime income to be the same across all individuals. A further point is that Bleichrodt and Quiggin only use health and consumption in the model and for a true welfare economic approach all factors which may affect utility should enter into the utility function.
Dolan and Edlin (2002) then go on to demonstrate the impossibility of a link between CEA and CBA through the presentation of an impossibility theorem which shows that the present link is based on unrealistic assumptions. They use the utility function:
Equation 5
U (c1. . . cT, N1. . . . NT, h1. . . . hT)
where ct is consumption, Nt is a vector of other non-health factors and ht is health status at time t.
Assuming that c and N do not directly affect health, they take a link between CEA and CBA to be satisfied when individual WTP is a linear function of the number of individual QALYs gained and where the marginal WTP per QALY is the same for all. They show it is not possible for CEA and CBA to be linked if: the axioms of expected utility theory hold, where there is marginality and symmetry of preferences, and illness hinders the ability to enjoy consumption. The only possibility for a link between CEA and CBA is through relaxing the assumption that the axioms of expected utility theory hold. They therefore conclude that there is no meaningful link between CEA and CBA and thus there is no justifiable basis for CEA in welfare economics.
Donaldson (1998) draws attention to a more fundamental issue, that CBA and CEA are approaches used to address different types of research question: questions of allocative and technical efficiency respectively. Some of the debate in the health economics literature focusses on the measure of outcome in CBA and CEA (e.g. WTP versus QALYs) rather than the question addressed. Taking a wider view of the objective of economic evaluation means that debates about equivalence between CBA and CEA rest on a fallacy.
Alternatively, attempts have been made to couch QALYs in an alternative theory of extra-welfarism (Brouwer et al., 2008, Brouwer and Koopmanschap, 2000). Extra- welfarism, as defined by Brouwer et al. (2008), broadens the evaluative space by including outcomes beyond individual utility (e.g. health gain, capabilities or care-giver burden) and the valuation of these outcomes is not solely taken from the individuals affected and could include expert representatives, the wider general public or decision makers. This is despite Birch and Donaldson (2003) having argued that the basics of QALYs – eliciting and aggregating individual preferences – render them essentially welfarist.
In section 2 we have presented a theoretical exposition of the QALY and the underlying assumptions required for the equivalence of CEA and CBA. If we wish to provide a link between CEA and CBA using WTP-QALY then a strong set of assumptions must hold. We must assume a constant WTP-QALY or we need to identify conditions under which CEA is consistent with lifecycle preferences over health and consumption. Evidence to date does not indicate that these assumptions hold. However, although there still may not be a link between CEA and CBA that would allow CEA to have theoretical foundations within welfare economics, this does not mean that there is no longer a need for WTP-QALY. A WTP-QALY value is still needed as an aid to decision making where interventions are assessed in terms of a cost per QALY gained. In section 3 we turn to the empirical studies of WTP-QALY and consider the methodological developments in this literature.
3. Eliciting the monetary value of a QALY (WTP-QALY)
As can been seen from the WTP-QALY section of the review in RQI, from the mid- 2000s there was a rapid increase in the number of studies conducted to elicit WTP- QALY. This growth in studies mirrors the rise in national Health Technology Agencies, such as NICE in England, established in 1999. Such agencies assess new technologies and make recommendations on whether these should be adopted within publicly-funded health care systems, like the NHS. As outlined in the introduction, NICE use CEA in their appraisal process and for decision making purposes, it has become commonplace to compare the incremental cost per QALY of the new technology against a ‘threshold’ value, above which technologies are considered to be relatively poor value for money (i.e. too costly per QALYs gained).
In this section we focus only on the approaches to eliciting a monetary value of a QALY using individuals’ WTP for a QALY. There have been 2 main approaches to eliciting WTP for a QALY through what we might describe as ‘primary’ studies; that is, empirical studies designed specifically for this purpose and not studies which combine data from the VPF with (quality adjusted) life expectancy. In the literature review presented in RQI, we identified 3 different methods used to elicit WTP-QALY values; TTO for income, Discrete Choice Experiments, and Contingent Valuation. In this section we focus only on Contingent Valuation studies as these are most commonly used (17 of 22 studies) and are most similar to the VOLY elicitation process. The contingent valuation studies can be further divided into 2 approaches, ‘Chained’ and ‘Direct’. The first approach is a ‘chained’ method, which draws on the basic principle used to elicit the VPF (Carthy el al, 1999), combining a measure of the utility gained or lost through a change in health state with WTP for the same change in health state (utility). A key feature of the chained approach is that marginal changes in health status are valued and scaled up to a WTP value for a one QALY gain. The second approach is the ‘direct’ method, where larger health gains, typically of one QALY, are presented to participants and valued directly.
In the remainder of this section we first look at the chained studies followed by the direct studies. We will not discuss in detail all of the WTP-QALY studies identified in RQI but rather highlight key studies in this area focussing on methodological developments over time and where there would seem to be clearest connections to approaches to elicit a VOLY.
3.1. Chained studies
From the studies identified in RQI, 13 could be described as chained studies. In this section we highlight 4 studies (Gyrd-Hansen, 2003; Pinto-Prades et al., 2009; Baker et al., 2010; Robinson et al., 2013). These 3 studies span a decade of research into the methods to estimate WTP-QALY, and many of the other studies in this area use or adapt the methods developed in these 4 studies.
Gyrd Hansen (2003) is one of the earliest studies, eliciting WTP from a general population sample and combining WTP with utility values taken from EQ5D Danish population tariff values. Values were elicited by first selecting a pair of EQ5D health states at random (from a set of 42 possible options) for each respondent. Respondents were asked to imagine himself or herself in each state and to indicate which was worst. They were then asked to consider a medical treatment that could improve their health from the worst state to the better state. A monthly price (selected from a range of values) was attached to that medical treatment and respondents were asked to state whether they would be willing to pay for the medicine at that price. Danish population TTO based tariffs were used to estimate the utility change between each pair of EQ5D health states - implicitly assuming that the population tariffs were representative of the values of the respondent sample. Discrete choice modelling was used to estimate WTP-QALY for the respondent sample (individual WTP-QALY would not be possible using these methods). Gyrd-Hansen highlights a number of issues of methodological interest. Firstly, the WTP-QALY estimated in this study, DKK 88,000 (£5,072 in UK 2017 prices,) is lower than the literature up to that date suggested, based as it was on human capital, revealed preference and contingent valuation studies of WTP for small reductions in risk of death. The author notes that the WTP-QALY implied from the valuation of quality of life improvements might be lower than WTP-QALY based on risk reductions and life expectancy. It is further hypothesised that this might be attributable to the fact that risk reductions are ex ante valuations and might include option value, whereas health improvements presented as a certainty are ex post.
This study also finds that WTP is positively linked to income, as would be expected, and negatively associated with age - the older the respondent, the lower the WTP for health improvement, ceteris paribus. The size of the ‘health good’ was relatively small in this study (mean QALY increment of 0.141, maximum 0.32) and there was no evidence of respondents hitting budget constraints, (though it is noted that the maximum bid may have been too low, which would underestimate WTP).
The Social Value of a QALY (SVQ) Project included a study designed to explore the feasibility of eliciting a WTP based monetary value of a QALY[footnote 3] (Baker et al. 2010). The study was conducted in the UK from 2004-2007 and was the first large scale study designed to elicit WTP-QALY from a survey of the UK general public. The design of this study drew on the basic principle used to elicit the VPF (Carthy et al. 1999) using a chained approach designed to overcome the scope insensitivity problems of asking participants to value small changes in risk. In this case, the aim was to elicit individuals’ WTP to avoid the risk of an ill-health state and their utility value associated with the same health state to calculate the WTP to avoid the loss of one QALY.
This study was designed as a feasibility study to develop and test the methods and, although the sample size was 403 people, it was not intended to be representative of the UK population. The SVQ valuation study had 2 main sections; the first covering WTP questions and the second standard gamble (SG) questions. 2 health states (related to stomach and head conditions, with episodic symptoms designed to keep the overall health change marginal) were described in naturalistic language and, for each state, there was 3 different durations – 3 months and 12 months, after each of which the participant would return to full health, and a chronic state in which the participant would experience the symptoms for the rest of their life. Table 1 presents the results of the study but is also useful to explain the study design and highlighting the strengths and limitations of this approach. Looking at the WTP questions, participants were first asked for their maximum WTP for a treatment that would avoid the certainty of experiencing the health states for the 3-month and 12-month duration. In the second set of WTP questions the participants were informed they had either a 5% or 10% chance of the 3 months or 12 months of illness. As can be seen from the results in Table 1, the ratio of WTP values for 12 months to 3 months in both the certainty and risk based questions was not 4:1, although we would not necessarily expect it to be exact because of discounting, adaptation, and budget constraints. For the risk-based questions, WTP was not sensitive to the size of the risk change and WTP-QALY soars with the risk based WTP questions compared with WTP presented as a certain improvement.
The results of standard gamble exercises indicated sensitivity to duration; means suggest the 12-month illness was considered 5 times as bad as the 3 month illness and medians suggest the wellbeing loss is up to 14 times higher for the 12 month illness compared to the 3 month illness. These findings are similar to those found in Jones-Lee et al. (1995) that elicited the prevention of non-fatal road injuries using WTP and standard gamble questions and found the latter approach to be more sensitive to differences in risk.
Based on the SG and WTP data gathered, there are a number of ways to estimate of WTP-QALY, the most straightforward being a combination of the utility value from the SG for the certain chronic health state versus probabilities of experiencing full health and death and the WTP values for the certain 12-month scenario, which yielded WTP- QALY of roughly £18,000 and £23,000 for stomach and head scenarios respectively. As can be seen in Table 1, WTP-QALY varies substantially depending on the WTP values, with the risk-based questions generally of a substantially higher magnitude than those from the certainty questions[footnote 4].
There were a number of encouraging features of the study including high engagement from participants with a very low number of zero values and protest responses. However, the study highlighted that, when questions presented probabilities, participants appeared to be insensitive in the case of the WTP and cautious in the case of the SG.
Table 1: SVQ study results – utility loss for health states (based on SG certain chronic health states versus full health and death)
| mean WTP £ | SG head chronic 0.144 | SG stomach chronic 0.104 | ||
|---|---|---|---|---|
| WTP head 3m | £1,495 | 41,528 | ||
| WTP certainty | WTP head 12m | £3,250 | 22,569 | |
| fixed duration | WTP stomach 3m | £810 | 31,164 | |
| WTP stomach 12m | £1,870 | 17,981 | ||
| WTP risk reduction | WTP head 5% 3m | £477 | £265,188.89 | |
| WTP head 10% 3m | £403 | £112,044.44 | ||
| WTP stomach 5% 3m | £230 | £177,261.54 | ||
| WTP stomach 10% 3m | £376 | £144,550 | ||
| WTP head 5% 12m | £877 | £121,845.83 | ||
| WTP head 10% 12m | £624 | £43,324.31 | ||
| WTP stomach 5% 12m | £452 | £86,865.38 | ||
| WTP stomach 10% 12m | £914 | £87,926.92 |
The study by Pinto-Prades et al. (2009) was designed to test the assumptions of the linear QALY model and the impact that non-linearities would have on the estimation of WTP-QALY. Specifically, the study was designed to test how variations in the severity or duration of the health condition, or changing the reductions in the risk of chronic conditions, would impact on WTP-QALY estimates. To do this, 13 scenarios were designed based around 2 health states described as 21212 and 22223 using the EQ-5D (3L) with utility values elicited for each using SG. In each question, participants were presented with one of these health states and informed that with standard treatment they would remain in this health state for either 4 months, 2 months or 2 weeks depending on the question, followed by full health (11111) for the rest of their lives. They could pay for an alternative treatment that had a better outcome; either reduced time in the worse health state or better quality of life (Table 1 in Pinto Prades et al. (2009) sets out the scenarios). For 9 of the scenarios all outcomes were certain. For the remaining 4, there was a 1% risk of experiencing one of the impaired health states, which would continue with standard treatment, but participants could pay to either reduce the risk to 0.5% or eliminate the risk. The WTP question used a random payment card approach (see RQI for a description) similar to that used in the SVQ study.
The survey was conducted in Spain in 2 phases, the first with 560 participants and the second with 332 participants, both selected from the general public via random telephone dialling followed by a visit from an interviewer. The 13 scenarios were blocked into 3 groups to test different hypotheses and this paper produces (and reports) a large number of WTP-QALY estimates (37 in total, ranging from £3,907 to £246,687). Here we do not present all of these values but highlight the key messages from this study. It is clear from the large number of different values that were produced that this study did not identify a unique WTP-QALY and the linearity assumptions of the QALY model can be questioned. Violations of procedural invariance were observed in all 3 groups. Mean WTP was lower when the question order started with the lowest health gain. The monthly WTP was not sensitive to payment duration (either 1 year or 2 years). Potentially more important than these survey design issues, this study also did not find the results were sensitive to the size of the quality of life improvements or the duration of the health states.
The results of this study would call into question whether it is possible to elicit WTP- QALY values that would be useful for policy. However, it does indicate where further research is needed in survey design that may reduce the influence of design aspects, such as ordering or the size of the health gain, can have on the resulting values. The European Value of a QALY (EuroVaQ) project was a successor to the SVQ project and set out to further develop the methodology to elicit WTP-QALY (Donaldson et al. 2010; Robinson et al. 2013) This was a multi country study involving 10 European countries and remains the largest empirical study of WTP-QALY. The EuroVaQ study included 2 different surveys; the ‘chained’ approach, which was a modified version of the SVQ study, and the ‘direct’ approach, which will be described in more detail in section 3.2.
The design of the EuroVaQ study started from the premise that, if the size of the QALY gain presented to participants could be kept small, e.g. 0.05 and 0.10 QALY, the resulting WTP-QALY estimates would reflect values for ‘marginal’ health gains. By tailoring the WTP questions according to respondents’ utility values, the health gains could be presented as exactly 0.05 or 0.10 QALY for every participant. To do this, the health state utility was elicited first. Based on the utility value individuals ascribed to each health state, the same size of QALY gain could be presented in the WTP questions, tailored for each respondent by either adjusting the time in the health state or the chance of recovery (Donaldson et al., 2010). For example, suppose an individual assesses health state A to represent a quality of life loss of 0.2 from their current state of health. In order to present a 0.1 QALY gain in a WTP question, respondents could be presented with a ‘time variant’ question which would elicit WTP for a 0.2 quality of life (utility) improvement over 6 months, or a ‘risk-variant’ question which would elicit WTP for a 50% chance of a 0.2 quality of life improvement for a year. In both of these the expected QALY gain is 0.1. This approach represented a methodological advance, previous studies effectively fixed the duration or probability presented in WTP questions, the same for all respondents, although respondents would have different utility values for the same health state.
To tailor the questions, an online survey was designed which could be customised so that questions depended on answers the participants gave at previous stages. It also facilitated an interactive learning component to explain probability, since insensitivity to risk had been a particular problem in previous studies (Baker et al. 2010).
2 health states were depicted using the EQ-5D 3L descriptive system (22222 and 21121). For each participant, health state utilities were elicited using either a SG or a TTO, if the participant was not willing to take any risk of death in the SG or give up any time in the TTO, they were considered to be non-traders i.e. to value the health state as 1, or equivalently the loss of health equal to zero. This is important because, in the calculation of WTP-QALY, non-traders in the utility elicitation who express positive WTP result in infinite WTP-QALY and so are excluded from the analysis (Robinson et al. 2013).
WTP-QALY estimates for this study are reported in RQI and in this section we focus on the methodological challenges for eliciting WTP-QALY (and potentially the VOLY) using the chained approach. As has been observed elsewhere in the literature, the TTO and SG did not produce the same utility values for each health state with lower values observed from the SG. The TTO had a higher number of non-traders (7.1% for the 22222 health state and 10.6% for 21121) compared to the SG (2.9% and 5.2%). As noted above, non-traders are a problem for the WTP-QALY calculation but these results do not indicate that the risk framing was more problematic than the time framing which may have been hypothesised in advance.
Sensitivity to scope was not observed for either the risk or time variant of the WTP questions and resulting WTP-QALY estimates, with the time variant questions being less sensitive to the magnitude of the QALY gain (Robinson et al. 2013). Another finding that may indicate insensitivity to scope was that higher WTP-QALY estimates were observed for the more severe (22222) health state. Given the risk or time framing of the questions, to hold the QALY gain constant for health states with lower utility values, the risk or duration was necessarily smaller and there was the potential for insensitivity to the magnitude of these small risks or durations (Robinson et al. 2013).
Of particular concern for the chained approach was the treatment of the 2 scales (WTP and Utility) with results indicating that some respondents would make the trade on the utility scale but not using the monetary scale. Gyrd-Hansen (2012) finds the reverse, with larger number of respondents who would not trade in the TTO (27%) than would not trade in the WTP questions (4%). There may be rational reasons why an individual would be willing to pay for a small change in health status but not sacrifice life years for it. But there is less rationale for the reverse. In the EuroVaQ study the setup of the WTP question meant that only respondents who had indicated ‘Yes’ they would be willing to pay something for the scenario then completed a payment card exercise to elicit maximum WTP, which potentially resulted in people who would have given a very small but positive WTP giving a zero value. Further qualitative evidence would be helpful to explore the underlying reasons for non-trading.
A strong assumption of many of the chained approaches above is that the basic properties of the QALY model hold, permitting the values expressed for short durations of health gain, for example, to be multiplied up to 1 QALY. However, it is entirely possible, as noted by Robinson et al. (2013) that, “some of the apparent ‘insensitivity’ findings reported here do not necessarily represent problems with the WTP method and respondents’ cognitive abilities; rather, it could be that the strict QALY assumptions applied here simply do not hold. For example, it may well be the case that the true model is not linear in duration and that doubling the duration of a health state does not double the perceived loss of health. Thus, our results may - at least in part- indicate that the basic linear QALY model does not adequately reflect respondents’ underlying preference structures (Robinson et al. 2013; p 101).
3.2. Direct approaches
Of the studies identified in RQI, 4 could be described as direct studies. The idea for a direct approach came as a response to many of the methodological problems that have been identified in the studies reported in section 3.1 such as lack of understanding of risk and probabilities and the need to assume a linear QALY model to scale up WTP for the marginal changes in health gain to WTP for one QALY. The rationale was to present participants with a one QALY gain and seek their WTP for this in a less cognitively challenging way (Pennington et al. 2015). The EuroVaQ direct questionnaire is the largest of such studies, conducted across 10 countries. Following the completion of EuroVaQ, the direct study was repeated in Germany and extended to address methodological issues that had arisen in EuroVaQ (Ahlert et al. 2016). The basic survey design for both studies is described here first and followed by the extensions made in the German study.
To begin the survey, participants were asked to provide their current age, self-reported life expectancy and health status on a 0-100 visual analogue scale (the 0-100 health scale had been previously explained in the introduction to the survey). Using this information, a customised graph of remaining quality adjusted life expectancy was created and used in all remaining questions to graphically explain the QALY change for which WTP was then elicited.
The diagrammatic presentation of the QALY allowed for further exploration of ‘QALY types’ that was not possible in the chained approach. As QALYs are constructed from 2 elements, it is possible to vary one or both of these to produce a QALY gain. In the chained approach, it is typically only changes in quality of life that are presented, but with this visual presentation it is possible to vary quality of life and life expectancy. 13[footnote 5] scenarios were developed; 8 scenarios included a one QALY health gain with the remaining 5 presenting smaller gains of 0.05, 0.1 or 0.25 QALY gains to mirror the EuroVaQ chained questionnaire. Of the 8 scenarios presenting a one QALY gain, 5 were QALY gains achieved through improvements in quality of life only and 3 were life extending QALY gains. The full design of the survey can be found in the EuroVaQ report (Donaldson et al., 2010 pgs. 78 & 82). It is worth highlighting a few of the scenarios here, in particular the life extending scenarios, which may be more analogous with the VOLY. 3 different ways of gaining one QALY through increases in life expectancy were explored. The first was an extension of one QALY at the end of the participant’s stated life expectancy. These values are likely to be heavily discounted (as discussed in RQII in relation to the VOLY literature). However, it is difficult in situations of certainty to increase life expectancy by one QALY in the immediate future. Therefore, a more unusual question was developed to try and get around this. Participants were asked to imagine they would face the next period (equivalent to one QALY) in a coma from which they would awake and continue with the normal remaining life expectancy. The assumption with this scenario is that the period in the coma is the same as a shortening of life expectancy of one QALY. The third scenario focussed on end of life and terminal illness. Participants were asked to value a one QALY gain when they were facing immediate death (Pennington et al. 2015). This scenario was designed to give more information on the relative value of end of life with a terminal illness that continues to be an area of interest for policy in the UK with the NICE end-of-life policy (NICE 2009).
The quality of life scenarios presented participants with a loss in quality of life of 25 points on the 0-100 scale for 4 years or 10 points for 10 years with no changes in overall life expectancy. The life expectancy gains were of different durations, tailored to respondents’ own health status in order to generate a 1 QALY gain (for example, a respondent reporting current health status of 0.5 would be shown a 2-year life extension in that health state).
For all scenarios the same procedure was undertaken. First, the participant was presented with the diagram of the scenario in question with a written description. They were then asked to say if they would be willing to pay to avoid the health loss or achieve the health gain (scenario dependent). For those respondents who answered ‘Yes’ they would be presented with the card sort and asked a final open-ended WTP question. Those responding ‘No’ were asked to state a reason why by selecting from a list of reasons, including a free text option.
Although most of the scenarios were framed as certain, 3 scenarios included risk (either 5% or 10%) and for those questions, risk was illustrated using the same smiley face format from the chained questionnaire (Donaldson et al. 2010).
The results from the EuroVaQ direct questionnaire are given in Table 3 in RQI with values ranging from 7,636 - £20,721 for the certainty questions; so here we reflect on the differences across the scenarios. For the certainty scenarios, the highest mean value was for the life extending (terminal illness) scenario followed by the life extending (coma) scenario, then the quality of life scenarios, with the lowest value for the life- extending (at the end of life) scenario. This result adds to the literature, which has suggested that the type of QALY gain does matter to participants (see section 4 below for further detail on this). The scenarios that included risk all had substantially higher WTP values than their certainty equivalents. For example, the scenario with a 25 point quality of life loss for 4 years under certainty resulted in a mean WTP-QALY of $6907. But, when framed as a 10% risk, this increased to $52,916. This result would again suggest that participants are not sensitive to risk, despite attempts to represent probabilities visually, and do not change their WTP values to the magnitudes that would occur when the outcome could only be expected with a lower probability.
Given the possibility of non-marginal health gains raising issues of budget constraints, a staged payment approach was also tested for the 25 point/4 year scenario. With a 4 payment option compared to a one off upfront payment WTP-QALY increased from $6,907 in the one off payment up to $13,972 when summed over 4 payments.
A notable result of the EuroVaQ direct survey was the high proportion of zero valuations (approximately 20-45% depending on the scenario; see Table 1 in Pennington et al. (2015), for details per scenario). Of these, 6-8% were classified as ‘protest’ zeros in which the participant indicated that ‘The government should pay for health care’ when asked to indicate their reason for stating ‘No, they were not willing to pay anything’ for the scenario. A feature of both of the EuroVaQ surveys was that the WTP question was a 2-stage process with participants first asked to state if they would be willing to pay something for the scenario with a Yes or No response option.
Ahlert et al., (2016) hypothesised that the large number of zero responses in EuroVaQ could be due to the framing of the WTP questions. Adapting the direct questionnaire in a new study in Germany, the authors created 3 additional questionnaire versions to test framing effects (versions II, III and IV). The main modification highlighted here was in version IV in which the 2 stage payment approach was removed and participants were not asked if they were willing to pay first, but instead taken straight into the payment card exercise. Here they found that the overall share of zeros dropped significantly with 0.3-0.5% (depending on the scenario) now classed as protestors. As may be expected with fewer zero valuations and more positive WTP values, mean WTP-QALY across all scenarios also increased. The Ahlert et al. (2016) survey, demonstrated that the design of the WTP questions has an impact on both the number of positive WTP values and therefore the overall mean WTP-QALY. It is unlikely that these features are unique to the direct approach but more generally applicable to design of WTP questions.
The direct approach, whilst arguably easier for respondents to visualise health gains and compare them between scenarios, could be viewed as theoretically less valid than the chained approach as a means to elicit WTP-QALY. Health gains of one QALY are non-marginal and therefore it is more likely that participants will face budget constraints when responding to these types of questions so the WTP values may not reflect ‘true’ WTP[footnote 6].
In this section we have discussed a number of WTP-QALY studies first presented in RQI, focussing on the contingent valuation studies. The selection of studies here is to highlight the methodological developments both in the elicitation of WTP-QALY and also those that apply more generally to the elicitation of WTP and utility values, both of which are crucial in the elicitation of a VOLY.
It is challenging to draw firm methodological messages from these papers but the following brief bullet points highlight the issues that this body of work has raised, if not resolved:
- considering 2 main approaches to eliciting WTP QALY, chained elicitation procedures are arguably theoretically superior because they deal with marginal health gains
- chained approaches require respondents to trade 2 different numeraires, years of life (TTO) or risk of death (SG) and money for the same change in health state, some studies indicate different willingness to trade (Gyrd-Hansen et al. 2012)
- less theoretically appealing, direct approaches have the advantage that they are intuitive for respondents and can be used to examine the relative value placed on different types of health gain from ‘own health’ rather than from a societal perspective (see section 4)
- there is evidence that not all QALYs are valued equally
- WTP QALY estimates depend to some extent on the assumptions underlying the QALY model holding for individual preferences
- the methodological basis for WTP-QALY and VOLY are different, grounded in CEA and CBA respectively
4. Accounting for context
Accounting for the context in which QALYs are produced has led to debates about whether “a QALY is a QALY is a QALY”. If the assertion that all QALYs are equal holds then the value assigned to the same size health gain is not affected by the composition of the health gain, for example 50% quality of life gain over 2 years vs. 10% quality of life gain over 10 years, or the characteristics of the beneficiaries, for example young vs. old. Researchers have questioned this assertion and sought to explore whether this is reflective of the general public’s preferences. Consequently, a large number of studies have explored what factors or attributes influence the value the general public assign to a QALY. These studies have been summarised in a number of reviews (see Gu et al., 2015; Whitty et al., 2014; Shah et al., 2018; Shah et al., 2009; Nord and Johansen, 2014; Shah, 2017; Morrell et al., 2017). While this is an international literature it is generally set in the context of a publicly funded health care system. This section draws on and summarises this work.
4.1. A note on the reviews
The reviews drawn upon in this section either provide an overview of the factors identified from stated preference studies which could be used to weight health gains (Gu et al., 2015; Whitty et al., 2014b) or are focused on preferences in relation to a specific issue (Nord & Johansen, 2014; Shah, 2009; Shah, 2017; Shah et al., 2018). The focus of Gu et al. (2015) and Whitty et al. (2014b) is similar as they seek to identify factors that are important for resource allocation decisions. However, Gu et al. (2015) is the first review to explore distributional weights among studies that elicited preferences for characteristics of beneficiaries. Interestingly, only around a third of studies that elicited preferences went on to calculate distributional weights with the focus being on age and severity despite the popularity of methods such as Discrete Choice Experiments (DCEs) and Person Trade-off (PTO) (see the following subsection 4.2). While PTOs enable weights to be generated directly from the elicitation of preferences, it is thought that relatively few DCEs derived weights as no standard approach for this exists. Synthesising these weights also proved difficult as different definitions (as described in Severity 4.4.2) and question framings were used and indicative findings suggested large variation in the magnitude of the distributional weights, hypothesised as stemming from the range of methods, contexts, settings and sample sizes used in the studies. As described in the following sub-section (4.2) these weights generally stem from preferences elicited from a social perspective. The reviews of Gu et al. (2015) and Whitty et al. (2014b) build on and extend older reviews that reviewed preference elicitation studies concerned with identifying factors that could be used to weight QALYs (see Dolan et al. (2005) and Schwappach (2002)). Shah et al. (2009) and Nord and Johansen (2014) both focus on severity. The former review aims to establish how preferences for severity affect the objective of health maximisation, the latter extends the review of Shah et al. (2009) by examining the strength of severity concerns. The final reviews focus on preferences for health gains at the end of life (i.e for those with a terminal illness) (Shah et al., 2018) and preferences for cancer treatments (Morrell et al., 2017; Shah, 2017).
The reviews do not formally assess the quality of studies using a quality assessment tool that typically might be utilised for a systematic review (see Armijo Olivo et al. (2012) and Deeks et al. (2003) for a review of the different quality assessment tools that are used in practice) and we do not critique these studies. The purpose of this section is to present characteristics which might have an impact on the value of a QALY rather than to comment on the quality of the evidence.
4.2. Key methods and perspectives used to elicit preferences
In RQI, studies that elicited preferences for WTP-QALY were reviewed. The vast majority of studies were found to use a contingent valuation approach from an individual perspective. This approach aligns with welfare economic theory as respondents’ are trading-off their own individual consumption to improve their own health. Importantly, the aim of this section is to review studies that explore how context may result in deviation from the value of a ‘standard QALY’. This requires a different approach to preference elicitation than that required to elicit preferences for WTP- QALY. Specifically, relative values are required as this provides insight into individuals’ strength of preference and these values will generally be elicited from a social perspective as the focus is on priority setting for public resource allocation.
Relative values tend to be elicited using choice or matching techniques. Choice refers to respondents choosing between their most preferred option from a set of options and matching involves respondents providing a number(s) to signal the point at which they are indifferent between options (Carson & Louviere, 2011). It is also possible to infer relative values from self-focused (individual) WTP questions and ranking approaches which involve respondents’ ordering a set of options in order of preference; however, this latter approach is not able to give any indication of strength of preference.
The most commonly used methods to elicit preferences for factors that could affect the value of a QALY were DCE and PTO questions (Gu et al., 2015; Whitty et al., 2014b). DCEs are popular as they are an attribute-based approach meaning the relative importance of the different attributes of a good/service can be examined (Ryan et al., 2008). PTO questions typically involve, for example, respondents altering the number of patients to be treated between 2 options until a point of indifference is reached (Nord, 1995). Both DCEs and PTOs are used to elicit societal (or ‘citizens’) preferences with data aggregated across respondents.
The perspective taken to elicit preferences is a key consideration. Dolan et al. (2003) outlined a framework with 2 dimensions, the first being whom the respondent was asked to think about. This could include the respondent (‘personal’), other people not including the respondent (‘social’) or both the respondent and other people (‘socially inclusive personal’). The second dimension is concerned with the nature of the hypothetical health gain and whether it is presented as ex ante or ex post. This framework was extended by Tsuchiya and Watson (2017) to include 2 further types of preference – non-use and proxy – alongside personal, social and socially inclusive and 3 new ex ante perspectives alongside the original ex post and ex ante contexts. In this framework it is possible to have 23 different perspectives.
The vast majority of studies included in the reviews examined in this section took a ‘social’ perspective (as described by Dolan et al. (2003)) (Gu et al., 2015; Shah, 2009; Shah et al., 2018; Whitty et al., 2014b). For example, Whitty et al. (2014b) only included studies with a social perspective to ensure studies focused on the public good. However, it was noted that it was difficult to assess whether the perspective was ‘social’ or ‘socially inclusive personal’ as it could depend on how respondents interpreted the context of the question (Gu et al., 2015). In general, ex post perspectives were used; Gu et al. (2015) noted that ex post was used 58 times and ex ante only 7 times (as described by Dolan et al. (2003)).
4.3. Characteristics of health gain
Studies investigating what impacts the value of a QALY typically include health gains as one of the criteria examined. In all cases health gains are found to be highly valued (Gu et al., 2015). However, health gains, in the form of QALYs, can be described in different ways – quality of life improvements only; extensions to life only; and improvements in both quality of life and life expectancy. These definitions tend to differ across studies and studies typically only focus on one type of QALY gain, for example, life expectancy only (Norman et al., 2013); quality of life only (Gyrd-Hansen, 2004) or life expectancy and quality of life (Baker et al., 2010). Only 5 studies were identified as having elicited preferences for different types of health gain and of these 5 only one, Whitty et al. (2014a), fixed the size of the health gain (Gu et al., 2015). 3 studies (including Whitty et al. (2014a)) found that life extension is preferred to quality of life improvements. None of these studies included a scenario is which there were improvements in both quality of life and life expectancy. Importantly, there is evidence that the value attached to health gains may be different at the end of life with quality of life improvements being more favoured (Shah et al., 2018) (see End of Life treatments 4.4.3 for more detail).
In addition to the composition of the health gain, whether gains are preventative or a cure seems to matter as preventions are favoured in 4 of 5 studies (Gu et al., 2015). Relatedly, a study by Olsen and Donaldson (1998) indicates that lifesaving health gains are preferred to both quality of life improvements only and increases in life expectancy only. Research has also explored whether health gains from particular diseases or illnesses affect the value of health gains. For example, recent reviews have analysed whether society prefers health gains from cancer treatments (Morrell et al., 2017; Shah, 2017). Motivating this work are policies, such as the Cancer Drugs Fund (CDF) established in England in 2011, which was a ring-fenced pot of money solely for cancer treatments. This enabled cancer treatments that are not recommend by NICE because of their failure to meet cost-effectiveness thresholds, to be accessed. The CDF was introduced on the basis of claims around societal preferences that society values benefits from cancer more than benefits from other treatments that could be provided by the NHS (Department of Health, 2010). In 2016, NICE introduced a new faster appraisal procedure for cancer drugs and a new CDF is now integrated and managed by NICE (NHS England, 2016). Results from recent reviews suggest there is inconclusive evidence for the claim that individuals’ value health gains from cancer treatments more than other types of treatment and few studies directly examine health trade-offs (Morrell et al., 2017; Shah, 2017).
4.4. Characteristics of beneficiaries
In addition to the characteristics of the health gain most preference elicitation studies find that characteristics of the beneficiaries affect the value of a QALY. A notable exception is a DCE study by Lancsar et al. (2011) which found that health gain is the most important attribute with little support for weighing QALYs on other characteristics (i.e. age and severity of illness). In this section studies focusing on age, severity, end of life, lifestyle/culpability and a selection of other characteristics of beneficiaries will be summarised.
4.4.1. Age
A large number of studies have explored preferences for age. In general, there appears to be a preference for the young over the elderly (Gu et al., 2015; Whitty et al., 2014b). However, this finding is nuanced as there are noted differences between age groups and confounding effects could influence the results.
The reviews by Gu et al. (2015) and Whitty et al. (2014b) both reported on studies that explored preferences for age. Gu et al. (2015) report that the majority of studies eliciting age preferences found that the young tended to be favoured (14/25 studies); Whitty et al. (2014b) report similar findings. However, of these 25, 8 studies provided results suggesting that preferences for age follow an inverted U pattern implying that those of a working age are preferred more than the elderly and the young (Baker et al., 2010; Charny et al., 1989; Cropper et al., 1994; Diederich et al., 2012; Jelsma et al., 2002; Palanca-Tan, 2013; Petrou et al., 2013; Whitty et al., 2014a). The reason(s) for this are unspecified but could relate to working age adults having dependents (Murray & Lopez, 1994) or older people being deemed as having had their ‘fair innings’ (Williams, 1997). The final 3 studies found either preferences were not influenced strongly by age groups (Diederich et al., 2011; Linley & Hughes, 2013) or that the size of the health gain outweighed any concern for age (Lancsar et al., 2011). A key consideration when examining these results is whether preferences for age are confounded with preferences for a person’s capacity to benefit which is related to their remaining life expectancy. Of the 25 studies included in Gu et al. (2015), 15 controlled for this confounding effect: 8 found a preference for young over elderly; 5 found an inverted U pattern; and 2 found evidence not fitting this pattern. Those studies not controlling for this confounding effect may return stronger preferences for the young as they have a greater capacity to benefit than older people if the health gain is lifesaving or provides lifelong gains.
4.4.2. Severity
Severity can be defined in different ways. A person can be described as severely ill if their expected number of lifetime QALYs represents a major shortfall (in either absolute or proportional terms) from a ‘normal’ QALY expectancy (Towse & Barnsley, 2013; Williams, 1997). Alternatively, a person can be described as severely ill if their current level of health is poor (Nord, 1993). Thus studies of severity tend to describe health gains in terms of quality of life or life expectancy without treatment or in terms of lifetime QALY loss, prior to benefiting from that gain. Another form of severity is proximity to death and this is specifically discussed in the end of life sub-section (see 4. 4.3).
A review of the empirical evidence on severity-related preferences suggests that people are, on the whole, willing to sacrifice aggregate health in order to give priority to the severely ill. A review by Shah (2009) found that 17 of the 19 studies reviewed reported results broadly consistent with prioritising the severely ill over maximising aggregate health. Similar findings were also reported in more recent reviews (Gu et al., 2015; Nord & Johansen, 2014; Whitty et al., 2014b). The majority of studies reviewed by Shah (2009) focused on severity as measured by a patient’s current quality of life in absence of treatment, with several studies using adapted versions of a simple mobility scale used by Nord (1993). Few studies defined severity in terms of length of life (Hansson et al., 1994). In some cases, life expectancy was controlled for by asking respondents to assume that it did not differ across patients. In other cases, it was less clear how life expectancy (and duration more generally) was to be considered.
4.4.3. End of Life treatments
In 2009, NICE introduced supplementary guidance for the appraisal of life-extending, end of life (EoL-LE) treatments (NICE, 2009). If a set of criteria[footnote 7] are met EoL-LE treatments may be recommended even if they are not cost-effective according to the usual threshold (£30,000 per QALY). This policy is a special case in relation to contextual factors because it cuts across a number of characteristics. By definition those with a terminal illness have a non-curative condition which means they are in a severe health state defined here as proximity to death. The type of health gain is also specific both in terms of size and in favouring life extensions over quality of life improvements. Finally, the policy highlights that rarity is a concern as it is only for small patient populations. On this last point, recent developments indicate the small population size criterion will be dropped from the supplementary guidance (NICE, 2016).
This policy was introduced on the basis of societal values – “the public, generally, places special value on treatments that prolong life – even for a few months – at the end of life” (Rawlins et al., 2010, p348). However, at the time of the policy’s introduction research evidence was extremely limited. Since then a number of preference elicitation studies have investigated this claim and were reviewed in Shah et al. (2018).
Of 23 empirical studies identified, 8 studies reported results suggesting a positive premium for EoL, eleven studies find the reverse and 4 reported mixed findings (Shah et al., 2018). 2 recently published studies also suggest a negative EoL premium (Mason et al., 2018; McHugh et al., 2018). These results evidence the plurality that exists around preferences for EoL-LE treatments and does not support claims that society places special value on EoL-LE health gains.
Preferences have been elicited using a wide variety of methods and study design. For example, discrete choice experiments (DCEs) (Rowen et al., 2016; Shah et al., 2015; Skedgel et al., 2015), budget allocation (Linley & Hughes, 2013), person trade-off (PTO) (McHugh et al., 2018; Pinto-Prades et al., 2014) and willingness to pay (WTP) (Pennington et al., 2015; Pinto-Prades et al., 2014; Shiroiwa et al., 2013). Consequently, it is difficult to uncover patterns in the literature. However, of 4 studies using WTP, 3 find support for EoL health gains (Kvamme et al., 2010; Pennington et al., 2015; Pinto-Prades et al., 2014). The WTP studies were also the only studies to elicit preferences from an individual rather than a societal perspective[footnote 8]; another unpublished study eliciting preferences from an individual perspective using a risk-risk trade-off method also found that EoL health gains were preferred (Nielsen et al., 2016). The findings of the WTP studies could be linked to individuals’ marginal utility of wealth and health at the end of life. The opportunity cost of spending money on perceived health gains at the end of life might be low compared to other life stages and hope may increase the value of extensions to life if death is expected and raise expectations of a cure being found during this extra time (Becker et al., 2007).
Within the EoL literature, a subset of studies has explored the relative value of health gains within EoL. Of 4 studies, 3 suggest that quality of life improvements within EoL may be more preferred (McHugh et al., 2018; Pinto-Prades et al., 2014; Shah et al., 2014) and only Shah et al. (2015) find the opposite that life extensions are preferred. This is important as NICE EoL-LE Guidance only prioritises life extensions at the EoL.
4.4.4. Lifestyle and culpability
12 studies were identified as having explored whether issues relating to a person’s lifestyle or responsibility for their ill health could impact the value assigned to health gains (Gu et al., 2015; Whitty et al., 2014b). The vast majority of studies suggest that individuals deemed as being to blame in some way for their illness should receive lower priority. However, there should be some caution around the interpretation of this result as the studies were spread over a wide array of different topics and different comparator scenarios were used. For example, from a PTO study Singh et al. (2012) find that people valued interventions preventing hospital acquired infections more than interventions for lifestyle diseases and sports injuries. The contexts used in this study were set-up around perceived blame/responsibility; either that of health care providers/the health care system or the patient. This is quite different to studies which only focus on aspects of an individuals’ lifestyle or behaviour i.e. smoking, drinking or healthy eating (Norman et al., 2013; Schwappach, 2003). Additionally, assigning blame or responsibility to an individual for their illness is recognised as being notoriously difficult and, consequently, whether an individual is deserving (or not) should not influence whether they receive health care (NICE, 2008).
4.4.5. Socio-economic status (SES)
Whether the SES of beneficiaries plays a role in prioritisation decisions was explored by twelve studies (Gu et al., 2015; Whitty et al., 2014b). Ten of these studies indicate that respondents generally prefer those with a low SES than individuals’ with a high SES. However only 5 of these studies were conducted in the UK (Charny et al., 1989; Dolan & Tsuchiya, 2011; Green, 2009; Linley & Hughes, 2013; Tsuchiya & Dolan, 2007); 2 of which found no evidence for SES playing a role in priority setting (Charny et al., 1989; Linley & Hughes, 2013).
4.4.6. Other characteristics of beneficiaries
A number of other characteristics of beneficiaries have been explored in studies. These include carer status, prior medical treatment, gender, employment status, marital status or indigenous people (Gu et al., 2015; Whitty et al., 2014b). However, only a small number of studies have explored preferences for these attributes making it difficult to reach general conclusions.
5. Compatibility between the VOLY and WTP-QALY
Finally, we turn to the theoretical links between the VOLY and WTP-QALY; recalling the theoretical exposition of remaining life expectancy described in RQV as the sum of the probability of surviving each year conditional on having survived the previous year. Using this definition, gains in life expectancy can only be experienced by reducing the hazard rate (or probability of dying) in the coming year or in some future year(s). Each year of remaining life is generally assumed to be in some level of ‘normal’ health. It is therefore not a substantial leap to quantify this level of ‘normal’ health using population norm utility values representing health-related quality of life as outlined in section 2.1. Indeed, this was the approach taken in the Mason et al. (2009) paper which estimated the VOLY and WTP-QALY from the VPF.
Furthermore, there is a direct conceptual connection between the VOLY and the QALY if the health state utility values used to calculate the QALY are estimated using the TTO or SG. For example, if the TTO-based QALY associated with injury/illness X is, say, 0.8 then this means that, on average, people are indifferent between spending one year suffering X and 0.8 years in full health. It then follows that if the symptoms of X actually last for 1.5 years then, on average, people would regard this as generating the same utility as spending 1.5 x 0.8 = 1.2 years in full health. In turn, this means that suffering X for 18 months involves the same loss of utility as losing 1.5 – 1.2 = 0.3 years in full health which, it seems reasonable to interpret as being equivalent to losing 0.3 years of life expectancy. It then follows that if the average WTP to avoid 1.5 years suffering injury/illness X is £V, then this is equivalent to average willingness to pay for a 0.3 year gain in life expectancy being £V and the implied WTP-QALY (or VOLY) would be £V/utility gain. The same kind of argument could be used to justify the derivation of a WTP-QALY or VOLY using health state utility values that are derived from Standard Gamble questions since these scores would be based on increases in the risk of immediate death (and hence losses of life-expectancy) that were judged by respondents to involve the same utility loss as the injury or illness concerned.
6. Overall Summary
In RQIII we have considered how we measure and value (health-related) quality of life and QALYs, so that we can identify where there is compatibility between the VOLY and QALY framework. While assumptions are required to provide a link between CEA and CBA using WTP-QALY, a WTP-QALY value is still needed as an aid to decision making where interventions are assessed in terms of a cost per QALY gained.
2 approaches – ‘chained’ and ‘direct’ – to eliciting a WTP-QALY were outlined. Each approach has its (dis)advantages. For example, chained elicitation procedures are arguably theoretically superior because they deal with marginal health gains while direct approaches are more intuitive as respondents are asked their WTP for a one QALY gain and this approach bypasses issues with respondents’ understanding risk and probabilities. As outlined WTP-QALY values can also be affected by the ‘QALY type’ under consideration and contextual factors, such as age and the severity of the condition.
Conceptually, there appears to be a direct connection between the VOLY and the QALY if the health state utility values used to calculate the QALY are estimated using the TTO or SG. This provides a starting point to elicit a VOLY which is compatible with a QALY framework.
References
Ahlert, M., Breyer, F. and Schewttmann, L. (2016). How you ask is what you get: framing effects in willingness-to-pay for a QALY. Social Science & Medicine 150, 40- 48.
Armijo-Olivo, S., Stiles, C.R., Hagen, N.A., Biondo, P.D., and Cummings, G.G. (2012). Assessment of study quality for systematic reviews: a comparison of the cochrane collaboration risk of bias tool and the effective public health practice project quality assessment tool: methodological research. Journal of Evaluation in Clinical Practice, 18, 12-18.
Baker, R., Bateman, I., Donaldson, C., Jones-Lee, M., Lancsar, E., Loomes, G., et al. (2010). Weighting and valuing quality-adjusted life-years using stated preference methods: preliminary results from the social value of a QALY project. Health Technology Assessment, 14, 1-161.
Balmford, B., Bateman, I.J., Bolt, K., Day, B., and Ferrini, S. (2019). The value of statistical life for adults and children: comparisons of the contingent valuation and chained approaches. Resource and Energy Economics, 57, 68-84.
Becker, G., Murphy, K., and Philipson, T. (2007). The value of life near its end and terminal care. National Bureau of Economic Research.
Birch, S. and Donaldson, C. (2003). Valuing the benefits and costs of health care programmes: Where’s the ‘extra’ in extra-welfarism? Social Science & Medicine, 56, 1121-1133.
Bleichrodt, H. and Pinto-Prades, J.-L. (2006). Conceptual foundations for health utility measurement. Jones, A. (ed.) The Elgar Companion To Health Economics. Edward Elgar, Cheltenham, UK .
Bleichrodt, H. and Quiggin, J. (1999). Life-cycle preferences over consumption and health: when is cost-effectiveness analysis equivalent to cost-benefit analysis? Journal of Health Economics, 18, 681-708.
Brazier, J., Ratcliffe, J., Salomon, J. and Tsuchiya, A. (2007). Measuring and valuing health benefits for economic evaluation. Oxford University Press Oxford.
Brazier, J., Ratcliffe, J., Salomon, J. A. and Tsuchiya, A. (2017). Measuring and valuing health benefits for economic evaluation, Oxford, Oxford University Press.
Brouwer, W. B. F., Culyer, A. J., Van Exel, N. J. A. and Rutten, F. F. H. (2008). Welfarism vs. extra-welfarism. Journal of Health Economics, 27, 325-338.
Brouwer, W. B. F. and Koopmanschap, M. A. (2000). On the economic foundations of CEA. Ladies and gentlemen, take your positions! Journal of Health Economics, 19, 439-459.
Carson, R.T. and Louviere, J.J. (2011). A common nomenclature for stated preference elicitation approaches. Environmental and Resource Economics, 49(4), 539.
Carthy, T., Chilton, S., Covey, J., Hopkins, L., Jones-Lee, M., Loomes, G., Pidgeon, N. and Spencer, A. (1999). On the contingent valuation of safety and the safety of contingent valuation: Part 2 - The CV/SG “Chained” Approach. Journal of Risk and Uncertainty 17(3) 187- 214.
Charny, M.C., Lewis, P.A., and Farrow, S.C. (1989). Choosing who shall not be treated in the nhs. Social Science and Medicine, 28, 1331-1338.
Cher, D., Miyamoto, J. and Lenert, L. (1997). Incorporating risk attitude into markov- process decision models. Medical Decision Making, 17, 340-350.
Cropper, M.L., Aydede, S.K., and Portney, P.R. (1994). Preferences for life saving programs: how the public discounts time and age. Journal Of Risk And Uncertainty, 8, 243-265.
Deeks, J.J., Dinnes, J., D’Amico, R., Sowden, A.J., Sakarovitch, C., Song, F., et al. (2003). Evaluating non-randomised intervention studies. Health Technology Assessment, 7, 1-173.
Department Of Health. (2010). Impact assessment of a proposal for a cancer drugs fund. London: Department Of Health.
Devlin NJ, Shah KK, Feng Y, Mulhern B and Van Hout B (2017). Valuing health-related quality of life: an EQ-5D-5L value set for England. Health Economics, Online First, 1-16.
Diederich, A., Winkelhage, J., and Wirsik, N. (2011). Age as a criterion for setting priorities in health care? A survey of the German public view. Plose One, 6, e23930.
Diederich, A., Swait, J., and Wirsik, N. (2012). Citizen participation in patient prioritization policy decisions: an empirical and experimental study on patients’ characteristics. Plos One, 7.
Dolan, P. and Edlin, R. (2002). Is it really possible to build a bridge between cost- benefit analysis and cost-effectiveness analysis? Journal of Health Economics, 21, 827-843.
Dolan, P., Olsen, J.A., Menzel, P., and Richardson, J. (2003). An inquiry into the different perspectives that can be used when eliciting preferences in health. Health Economics, 12, 545-551.
Dolan, P., Shaw, R., Tsuchiya, A., and Williams, A. (2005). QALY maximisation and people’s preferences: a methodological review of the literature. Health Economics, 14, 197-208.
Dolan, P., and Tsuchiya, A. (2011). Determining the parameters in a social welfare function using stated preference data: an application to health. Applied Economics, 43, 2241-2250.
Donaldson C (1998). The near equivalence of cost-effectiveness and cost-benefit analyses. fact or fallacy? Pharmacoeconomics 13 (4), 389-396.
Donaldson C, et al. (2010). The European value of a quality adjusted life year. Final report. https://research.ncl.ac.uk/eurovaq/EuroVaQ_Final_Publishable_Report_and_Appen dices.pdf.
Green, C. (2009). Investigating public preferences on ‘severity of health’ as a relevant condition for setting healthcare priorities. Social Science and Medicine, 68, 2247-2255.
Gu, Y., Lancsar, E., Ghijben, P., Butler, J.R., and Donaldson, C. (2015). Attributes and weights in health care priority setting: a systematic review of what counts and to what extent. Social Science and Medicine, 146, 41-52.
Gyrd-Hansen, D. (2003). Willingness to pay for a QALY. Health Economics 12(12), 1049-1060.
Gyrd-Hansen, D. (2004). Investigating the social value of health changes. Journal Of Health Economics, 23, 1101-1116.
Gyrd-Hansen, D and Kjaer T (2012) Disentangling WTP per QALY data: different analytical approaches, different answer. Health Economics, 21, 222-237.
Hansson, L., Norheim, O.F., and Ruyter, K.W. (1994). Equality, explicitness, severity, and rigidity: the Oregon plan evaluated from a Scandinavian perspective. The Journal of Medicine and Philosophy, 19, 343-366.
Jelsma, J., Shumba, D., Kristian, H., De Weerdt, W., and De Cock, P. (2002). Preferences of urban Zimbabweans for health and life lived at different ages. Bulletin of the World Health Organization, 80, 204-209.
Johannesson, M. (1995). The relationship between cost-effectiveness analysis and cost-benefit analysis. Social Science and Medicine, 41, 483-489.
Johannesson, M. and O’Conor, R. M. (1997). Cost-utility analysis from a societal perspective. Health Policy, 39, 241-253.
Jones-Lee, M.W., Loomes, G., and Philips, P.R. (1995). Valuing the prevention of non- fatal road injuries: contingent valuation vs standard gambles. Oxford Economic Papers 47, 676-695.
Kind, P., Hardman, G. and Macran, S. (1999). UK population norms for EQ-5D. York: Centre For Health Economics, University Of York.
Kvamme, M.K., Gyrd-Hansen, D., Abel Olsen, J., and Kristiansen, I.S. (2010). Increasing marginal utility of small increases in life-expectancy? Results from a population survey. Journal of Health Economics, 29, 541-548.
Lancsar, E., Wildman, J., Donaldson, C., Ryan, M., and Baker, R. (2011). Deriving distributional weights for QALYs through discrete choice experiments. Journal of Health Economics, 30, 466-478.
Linley, W.G., and Hughes, D.A. (2013). Societal views on NICE, cancer drugs fund and value-based pricing criteria for prioritising medicines: a cross-sectional survey of 4118 adults in Great Britain. Health Economics, Policy and Law, 22, 948–964.
Loomes, G. and McKenzie, L. (1989). The use of QALYS in health care decision making. Social Science and Medicine, 4, 299-308.
Mason, H., Collins, M., McHugh, N., Godwin, J., Van Exel, J., Donaldson, C., et al. (2018). Is “end of life” a special case? Connecting q with survey methods to measure societal support for views on the value of life-extending treatments. Health Economics, 27, 819-831.
Mason, H, Jones-Lee, M and Donaldson, C (2009), Modelling the monetary value of a QALY: a new approach based on UK data. Health Economics, 18(8), 933-950.
McHugh, N., Van Exel, J., Mason, H., Godwin, J., Collins, M., Donaldson, C. and Baker, R. (2018). Are life-extending treatments for terminal illnesses a special case? Exploring choices and societal viewpoints. Social Science & Medicine, 198, 61-69.
Morrell, L., Wordsworth, S., Rees, S., and Barker, R. (2017). Does the public prefer health gain for cancer patients? A systematic review of public views on cancer and its characteristics. Pharmacoeconomics, 35, 793-804.
Murray, C.J.L., and Lopez, A.D. (1994). Global comparative assessments in the health sector: disease burden, expenditures and intervention packages. World Health Organization, Geneva.
NHS England. (2016). Appraisal and funding of cancer drugs from July 2016 (including the new cancer drugs fund) a new deal for patients, taxpayers and industry. NHS England, London.
NICE. (2008). Social value judgements principles for the development of NICE guidance. National Institute for Health and Clinical Excellence, London.
NICE. (2009). Appraising life-extending, end of life treatments. in research and development (eds.). Response To Consultation. National Institute for Health and Clinical Excellence, London.
NICE. (2013) Guide to the methods of technology appraisal 2013. nice.org.uk/process/pmg9. National Institute for Health and Care Excellence, London.
NICE. (2016). Technology appraisal processes - CDF. PMG19 addendum A - Final amendments to the NICE technology appraisal processes and methods guides to support the proposed new cancer drugs fund arrangements. National Institute for Health and Care Excellence, London.
Nielsen, J.S., Chilton, S., Gyrd-Hansen, D., Jones-Lee, M., Liu, J., and Metcalf, H. (2016). Eliciting individual preferences for end-of-life treatments. Washington, DC Paper Presented at the Society of Benefit Cost Analysis Annual Conference.
Nord, E. (1993). The relevance of health state after treatment in prioritising between patients. Journal Of Medical Ethics, 19, 37-42.
Nord, E. (1995). The person-trade-off approach to valuing health care programs. Medical Decision Making, 15, 201-208.
Nord, E., and Johansen, R. (2014). Concerns for severity in priority setting in health care: a review of trade-off data in preference studies and implications for societal willingness to pay for a QALY. Health Policy, 116, 281-288.
Norman, R., Hall, J., Street, D., and Viney, R. (2013). Efficiency and equity: a stated preference approach. Health Economics, 22, 568-581.
Oliver, A. (2005). Testing the internal consistency of the lottery equivalents method using health outcomes. Health Economics, 14, 149-159.
Olsen, J.A., and Donaldson, C. (1998). Helicopters, hearts and hips: using willingness to pay to set priorities for public sector health care programmes. Social Science & Medicine, 46, 1-12.
Palanca-Tan, R. (2013). Age preferences for life-saving programs: using choice modeling to measure the relative values of statistical life. The Singapore Economic Review, 58.
Pennington, M., Baker, R., Brouwer, W., Mason, H., Hansen, D.G., Robinson, A., et al. (2015). Comparing WTP values of different types of QALY gain elicited from the general public. Health Economics, 24, 280-293.
Petrou, S., Kandala, N.B., Robinson, A., and Baker, R. (2013). A person trade-off study to estimate age-related weights for health gains in economic evaluation. Pharmacoeconomics, 31, 893-907.
Phelps, C. E. and Mushlin, A. I. (1991). On the (near) equivalence of cost- effectiveness and cost-benefit analyses. International Journal of Technology Assessment In Health Care, 7, 12-21.
Pinto-Prades, J. L., G. Loomes, et al. (2009). Trying to estimate a monetary value for the QALY. Journal of Health Economics 28(3): 553-562.
Pinto-Prades, J.L., Sánchez-Martínez, F.I., Corbacho, B., and Baker, R. (2014). Valuing QALYS at the end of life. Social Science & Medicine, 113, 5-14.
Pliskin, J., Shepard, D. S. and Weinstein, M. C. (1980). Utility functions for life years and health status. Operations Research, 28, 206-224.
Rawlins, M., Barnett, D., and Stevens, A. (2010). Pharmacoeconomics: NICE’s approach to decision-making. British Journal of Clinical Pharmacology, 70(3), 346- 349.
Robinson, A., Gyrd-Hansen, D., Bacon, P., Baker,R., Pennington, M., Donaldson, C. (2013). Estimating a WTP-based value of a QALY: The ‘chained’ approach. Social Science & Medicine 92, 92-104.
Rowen, D., Brazier, J., Mukuria, C., Keetharuth, A., Hole, A.R., Tsuchiya, A., et al. (2016). Eliciting societal preferences for weighting QALYs for burden of illness and end of life. Medical Decision Making, 36, 210-222.
Ryan, M., Gerard, K., and Amaya-Amaya, M.D.S. (eds.) (2008). Using discrete choice experiments to value health and health care. Springer, Netherlands.
Sackett, D. and Torrance, G. (1978). The utility of different health states as perceived by the general public. Journal of Chronic Diseases, 31, 697-704.
Schwappach, D.L. (2002). Resource allocation, social values and the QALY: a review of the debate and empirical evidence. Health Expectations, 5, 210- 222.
Schwappach, D.L.B. (2003). Does it matter who you are or what you gain? an experimental study of preferences for resource allocation. Health Economics, 12, 255- 267.
Shah, K., Tsuchiya, A., and Wailoo, A. (2015). Valuing health at the end of life: a stated preference discrete choice experiment. Social Science & Medicine, 124, 48-56.
Shah, K.K. (2009). Severity of illness and priority setting in healthcare: a review of the literature. Health Policy, 73, 77-84.
Shah, K.K., Tsuchiya, A., and Wailoo, A.J. (2014). Valuing health at the end of life: an empirical study of public preferences. European Journal of Health Economics, 15, 389- 399.
Shah, K.K. (2017). Is willingness to pay higher for cancer prevention and treatment? Journal of Cancer Policy, 11, 60-64.
Shah, K.K., Tsuchiya, A., and Wailoo, A.J. (2018). Valuing health at the end of life: a review of stated preference studies in the social sciences literature. Social Science & Medicine, 204, 39-50.
Shiroiwa, T., Igarashi, A., Fukuda, T., and Ikeda, S. (2013). WTP for a QALY and health states: more money for severer health states? Cost Effectiveness And Resource Allocation, 11,11-22.
Singh, J., Lord, J., Longworth, L., Orr, S., Mcgarry, T., Sheldon, R. and Buxton, M. (2012). does responsibility affect the public’s valuation of health care interventions? a relative valuation approach to health care safety. Value in Health, 15, 690-698.
Skedgel, C., Wailoo, A., and Akehurst, R. (2015). Societal preferences for distributive justice in the allocation of health care resources: a latent class discrete choice experiment. Medical Decision Making, 35, 94-105.
Spencer, A. (2003). A test of the QALY model when health varies over time. Social Science and Medicine, 57, 1697-1796.
Torrance, G. (1986). Measurement of health state utilities for economic appraisal. Journal of Health Economics, 5, 1-30.
Towse, A., and Barnsley, P. (2013). Approaches to identifying, measuring, and aggregating elements of value. International Journal of Technology Assessment In Health Care, 29, 360-364.
Tsuchiya, A., and Dolan, P. (2007). Do NHS clinicians and members of the public share them same views about reducing inequalities in health? Social Science & Medicine, 64, 2499-2503.
Tsuchiya, A., and Watson, V. (2017). Re-thinking “the different perspectives that can be used when eliciting preferences in health”. Health Economics, 26, e103-e107.
Wakker, P. (1996). A criticism of healthy-years equivalents. Medical Decision Making, 16, 207-214.
Whitty, J.A., Ratcliffe, J., Chen, G., and Scuffham, P.A. (2014a). Australian public preferences for the funding of new health technologies: a comparison of discrete choice and profile case best-worst scaling methods. Medical Decision Making, 34, 638-654.
Whitty, J.A., Lancsar, E., Rixon, K., Golenko, X., and Ratcliffe, J. (2014b). A systematic review of stated preference studies reporting public preferences for healthcare priority setting. The Patient-Patient-Centered Outcomes Research, 7, 365-386.
Williams, A. (1997). Intergenerational equity: an exploration of the ‘fair innings’ argument. Health Economics, 6, 117–132.
Appendix A: Health state valuation techniques
There are several techniques that can be used to determine the utility of a given health state. The 3 most common, involving direct elicitation of preferences from individuals, are the standard gamble, the time trade-off and the visual analogue scale (Torrance, 1986). An overview of these approaches is presented here, summarised from Torrance (1986), Drummond et al. (2015) and Brazier et al. (2017) (see references for a more in-depth discussion).
Standard Gamble
The standard gamble (SG) technique is the only method which is directly based on the axioms of expected utility theory as set out by von Neumann and Morgenstern (1944). Respondents are faced with a choice between a certain intermediate outcome and a gamble where respondents could receive a better or worse outcome based on varying probabilities. In health, the gamble (see Figure 1) typically involves a choice between a certain health state (ha) and a treatment which could result in full health for a certain number of years (t)[footnote 9] with probability P or immediate death with probability 1-P.
Figure 1: Example of a SG for a chronic health state (ha) that is preferred to being dead (Drummond et al., 2015)
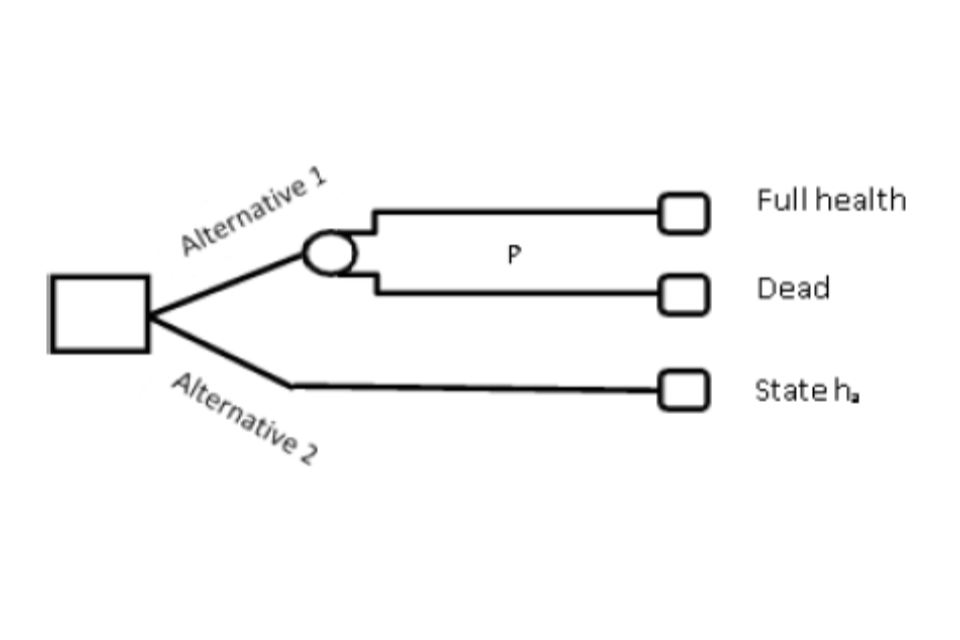
Two alternative routes of an SG for a chronic health state (ha). Alternative 1 has two routes of full health or dead. Alternative 2 has one route of state ha.
The probability of full health, P, is altered until a point of indifference between the 2 alternatives is reached; at which point, P is equivalent to the utility of ha i.e.
U (state ha) = P x U(full health) + (1-P) x U(death)
U(state ha) = P
The above approach can be used to generate values for all chronic health states that are better than dead (death<ha<full health). Health states worse than being dead and temporary health states require this approach to be altered. To elicit values for health states considered worse than being dead the certain outcome (alternative 2) is immediate death. The gamble (alternative 1) is between returning to full health for a certain number of years (t) with probability P or being in a chronic health state ha with probability 1-P for a certain number of years (t) following treatment (ha<death<full health). Once a point of indifference is reached the utility of ha = -P/(1-P).
For temporary health states it is necessary to use a 2-stage process. The first involves a SG in which all outcomes last for a specified period of time followed by full health or another health state. The certain outcome (alternative 2) is the intermediate health state (ha) for a defined period of time followed by full health; the gamble (alternative 1) involves a choice between returning to full health with probability P or living in the worst health state hb for the same period of time as the other alternative before returning to full health (hb<ha<full health). P is again varied until a point of indifference is reached and the utility of ha = P + (1-P) hb. The second stage involves the calculation of hb so that it can be used in the aforementioned formula. Essentially the same approach as illustrated in Figure 1 is applied; hb is transformed into a short-term chronic health state and the patient, with certainty, remains in hb following treatment for time period (t) followed by death (alternative 2). Alternative 1 remains the same as Figure 1. Once a point of indifference is reached, P is the utility of hb for time t and this is used in the calculation for temporary ha.
Time Trade-off
A technique developed specifically for use in health care is the time trade-off (TTO). As in the SG respondents are presented with a choice but this time the choice is between 2 certain options. For chronic health states (see Figure 2) TTOs are presented as a choice between living in a health state ha (full health>ha>dead) for a certain time period (t) (alternative 1) or living in full health for a shorter time period (x) (alternative 2); x<t. A point of indifference is reached by varying x. The value assigned to ha = x/t.
Figure 2: Example of a TTO for a chronic health state (ha) that is preferred to being dead (Brazier et al., 2017)
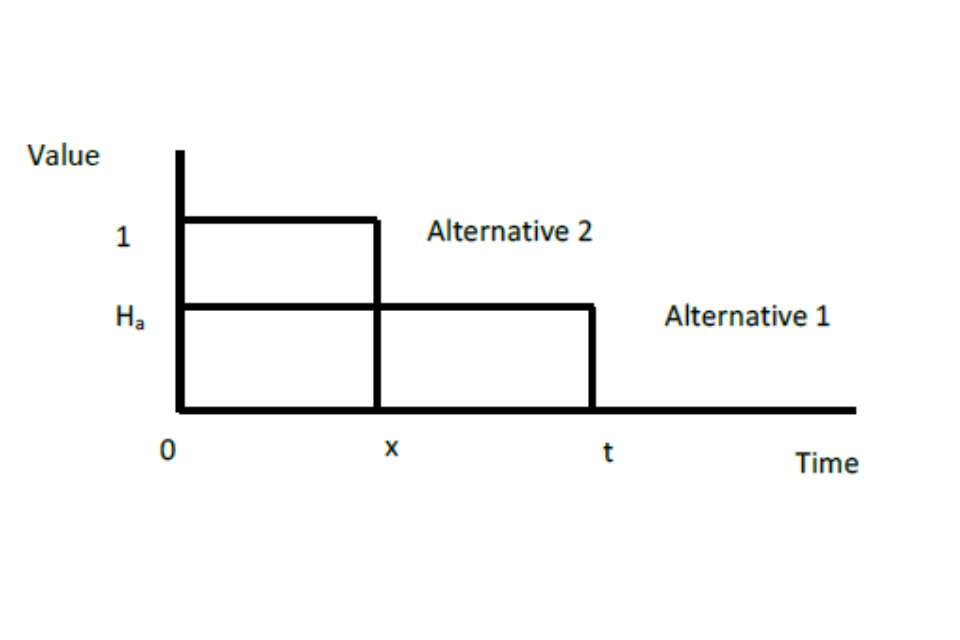
TTOs presented as a choice between living in a health state ha for a certain time period or living in full health for a shorter time period.
As with the SG it is possible to alter this approach to value states worse than being dead and temporary health states. For the former, the choice is between immediate death (alternative 1) and being in health state hb (hb<dead) for a stated period of time (y) before returning to full health for a certain time (x) (alternative 2); t=y+x. Again x is varied until a point of indifference is reached. The value assigned to hb = -x/y. A 2-stage process is necessary for temporary health states. The first choice is living in health state ha (full health>ha>dead) for a certain time period (t) before returning to full health (alternative 1) or living in a worse health state hb (ha>hb>dead) for a shorter time period (x) before returning to full health (alternative 2). Again a point of indifference is reached by varying x. The value of ha = 1-(1- hb)x/t. If hb=0 then ha = 1 – (x/t). If hb>0 then a second-stage is need to elicit the value of hb. This involves the conventional TTO approach outlined for chronic health states which means hb = x/t.
Visual analogue scale
A visual analogue scale (VAS), or rating scale, is a line with clear end-points that has interval properties. This means that on a scale of 0 to 100 (which represent the end- points) the difference between, for example, 25 and 32 is the same as the difference between 61 and 68. Respondents indicate their preferences for health states on the line and the distance between different health states (measured by intervals) corresponds to respondents’ relative preferences. The end-points on a VAS are labelled and can be variable, for example, ‘best imaginable health state’ to ‘worst imaginable health state’ or ‘full health’ to ‘death’. Importantly, these labels must be consistent and clear so that comparisons can be made across a sample of respondents which means terms like ‘full health’ would need to be defined. During a VAS exercise respondents are presented with different health states and are first asked to value the best and worst health states; one of the options presented to respondents is being dead.
When being dead is viewed as the worst heath state and placed at 0, on a 0 to 100 scale, then the value attached to other health states corresponds to their location on the scale and these ratings are transformed onto an equivalent 0 to 1 scale. If health states are viewed as worse than dead and placed below being dead on the scale, the value of health state ha = (Ra – Rdead)/(Rbest – Rdead) where Ra is the rating of the health state ha; Rdead is the rating of being dead; and Rbest is the rating of the best health state. For the valuation of temporary health states, the same process is followed, the only difference is respondents’ are informed that each of the health states will only last for a defined period of time (which is less than life expectancy).
A note on health state valuation techniques
Health state valuations are typically elicited from an individual perspective i.e. the 3 techniques described. However, it is possible to use a social perspective, namely, via a Person Trade-off (PTO) (Nord, 1992). For example, a respondent is first asked to choose between curing x patients with health state ha or y patients with health state hb (at this point x=y); if curing patients with health state ha is preferred then the number of patients (y) with health state hb is increased until a point of indifference is reached. At this point hb is x/y times the value of ha. Repeating this for all health states under consideration allows the value of all health states to be calculated by relating them to each other.
It is important that the health states used in the valuation tasks are clearly defined. For example, in a SG Drummond et al. (2015) describe the better health state in the gamble as ‘perfect health’ whilst Torrance (1986), for the corresponding health state, use ‘normal health’; these health states are not equivalent. It has also become common to describe health states using the EQ-5D descriptive system, for example, the EuroVaQ project defined ‘full health’ as 11111 using the EQ-5D-3L (Donaldson et al., 2010). However, 11111 is not necessarily full health as this signifies, for example, that an individual has no problems in walking about or with self-care. These issues are also relevant for the TTO and are important when valuation tasks are used in the elicitation of a VOLY or a WTP-QALY.
In terms of ease of use a VAS is recognised as the simplest technique followed by a TTO as probabilities are not utilised; probabilities are recognised as being difficult to explain to respondents (Brazier et al., 2017). However, as previously mentioned SGs are the most theoretically sound technique as they provide a measure of utility, represented by strength of preferences under uncertainty while a TTO provides a measure of value, represented by strength of preference under certainty (Brazier et al., 2017; Torrance et al., 2001). VAS is theoretically the weakest approach, primarily because there is no sacrifice or trade-off involved – respondents simply indicate a point on the scale. Preference based techniques are based on measurable trade-offs, in SGs in terms of the risk of death and in TTOs in future years of life.
All 3 techniques face difficulties with health state values for states worse than being dead. While there is an upper bound score of 1, the formula used to calculate health states valuations gives more weight to negative values which means there is no negative lower bound limit. It is possible to transform these values to fit on a bounded scale, this approach is criticised for not being based on theory and for the interpretation of these values being different to health states valued as being better than being dead as they are not measured on the same original scale (Feeny et al., 2002; Rowen & Brazier, 2011). Alternative approaches have been developed for valuing states worse than death via TTO: modelling (Craig & Busschbach, 2009), lead- time TTO (Robinson & Spencer, 2006); and lag-time TTO (Augustovski et al., 2013); see references for further discussion of these approaches.
In practice, SGs and TTOs tend to be more favoured (Drummond et al., 2015; NICE, 2013). However, both techniques are affected by biases. Bleichrodt (2002) outlined 4 possible sources of bias – utility curvature, probability weighting, loss aversion and scale compatibility – which affect these techniques in different ways (see this review for further discussion). Consequently, the elicitation of values using different techniques will generally result in different preference scores; it is common for SG scores to be greater than TTO scores which are greater than VAS scores (for heath states preferred to death) (Drummond et al., 2015). It is important that these issues are recognised when selecting a technique for use in a study.
References
Augustovski, F., Rey-Ares, L., Irazola, V., Oppe, M., and Devlin, N.J. (2013). Lead versus lag-time trade-off variants: does it make any difference? European Journal of Health Economics, 14, 25-31.
Bleichrodt, H. (2002). A new explanation for the difference between time trade off utilities and standard gamble utilities. Health Economics, 11, 447-456.
Brazier, J., Ratcliffe, J., Salomon, J.A., and Tsuchiya, A. (2017). Measuring and Valuing Health Benefits for Economic Evaluation. Oxford: Oxford University Press.
Craig, B.M., and Busschbach, J.J. (2009). The episodic random utility model unifes time trade-off and discrete choice approaches in health state valuation. Population Health Metrics, 7.
Donaldon, C. and the EuroVaQ team. (2010). European Value of a Quality Adjusted Life Year. Final Publishable Report. Sixth Framework Programme.
Drummond, M.F., Sculpher, M.J., Claxton, K., Stoddart, G.L., and Torrance, G.W. (2015). Methods for the Economic Evaluation of Health Care Programmes. Oxford: Oxford University Press.
EuroQoL. (2015). EQ-5D-3L User Guide: Basic information on how to use the EQ-5D- 3L instrument. In M. van Reenen, & M. Oppe (Eds.), Version 5.1.
Feeny, D., Furlong, W., Torrance, G.W., Goldsmith, C.H., Zhu, Z., DePauw, S., et al. (2002). Multiattribute and single-attribute utility functions for the health utilities index mark 3 system. Medical Care, 40, 113-128.
NICE. (2013). Guide to the methods of technology appraisal. London: National Institute for Health and Care Excellence.
Nord, E. (1992). Methods for Quality Adjustment of Life Years. Social Science & Medicine, 14, 559-569.
Robinson, A., and Spencer, A. (2006). Exploring challenges to TTO utilities: valuing states worse than dead. Health Economics, 15, 393-402.
Rowen, D., and Brazier, J. (2011). Health utility measurement. In S. Glied, & P.C. Smith (Eds.), The Oxford Handbook of health economics. Oxford Handbooks online 33.1-33.4.
Torrance, G. (1986). Measurement of health state utilities for economic appraisal. Journal of Health Economics, 5, 1-30.
Torrance, G.W., Feeny, D., and Furlong, W. (2001). Visual analog scales: do they have a role in the measurement of preferences for health states? Medical Decision Making, 21, 329-334.
von Neumann, J., and Morgenstern, O. (1944). Theory of games and economic behaviour. New Jersey: Princeton University Press.
-
The term cost effectiveness is used throughout the rest of this report to represent the method of economic evaluation that expresses benefits in health related units including QALYs. ↩
-
NICE currently recommends the use of both the 3 and 5 level instruments, with utility values calculated using the 3 level tariff (NICE, 2017). ↩
-
The SVQ study comprised 2 main phases, a relativities study and the monetary value of a QALY study. In section 3.1, when describing the SVQ study we make reference only to the latter. ↩
-
These calculations are based on estimating the mean WTP and mean SG values for the whole sample (known as the ratio of means approach) rather than the calculating WTP-QALY per participant and estimating the mean of this (mean of the ratios approach). The mean of the ratio approach would be considered the more theoretically correct, but it is more susceptible to extreme values in either the WTP or SG element of the calculation with 115 SVQ participants giving either WTP or SG values that resulted in a WTP-QALY of over £1 million. ↩
-
13 scenarios are reported in the EuroVaQ report but only 5 are reported in the Pennington et al.(2015) which are detailed in RQI. The additional scenarios cover methodological tests and so are noted here. ↩
-
A recent study (Balmford et al., 2019) which has implications for WTP-QALY valuation in any new study, compared the validity of the chained method and the direct method In the context of a VPF concluded that the former generated more reliable estimates of an adult VPF. However, child VPFs were also elicited but results were inconclusive since both methods - as applied in that study - were problematic. The authors suggested that the child VPF (relative to a parental VPF) elicited using a chained approach was much larger than might be expected based on the literature. They speculated that this might be due to double counting whereby a parent is both WTP a larger amount and take smaller risk of a bad outcome for their child relative to themselves. By chaining these preferences together the ‘premium’ is included twice. However, they provide no direct evidence of this and it is an open question as to by how much responses to both SG questions are impacted by the ‘certainty’ effect and whether it dominates or not the double counting effect. ↩
-
The treatment is indicated for patients with a short life expectancy, normally less than 24 months; there is sufficient evidence to indicate that the treatment offers an extension to life, normally of at least an additional 3 months, compared to current NHS treatment; and the treatment is licensed or otherwise indicated, for small patient populations (NICE, 2009). ↩
-
Pinto-Prades et al. (2014) also includes a PTO study with preferences elicited from a societal perspective. ↩
-
For chronic health states this would usually be for the rest of the patient’s life. ↩