Note on the interpretation of negative re-test results
Published 21 March 2024
Applies to England

© Crown copyright 2024
This publication is licensed under the terms of the Open Government Licence v3.0 except where otherwise stated. To view this licence, visit nationalarchives.gov.uk/doc/open-government-licence/version/3 or write to the Information Policy Team, The National Archives, Kew, London TW9 4DU, or email: psi@nationalarchives.gov.uk.
Where we have identified any third party copyright information you will need to obtain permission from the copyright holders concerned.
This publication is available at https://www.gov.uk/government/publications/uk-health-security-agency-joint-modelling-team-papers/note-on-the-interpretation-of-negative-re-test-results
Preface
This note, written at a time when polymerase chain reaction (PCR) testing was used to provide a second opinion (confirmatory testing) for lateral flow device (LFD) positive results, investigates the apparent anomaly where:
- a person has an initial positive test result for SARS-CoV2 (usually from a LFD test)
- is subsequently re-tested (also referred to as confirmatory testing), usually using a PCR -based test, that gives a negative result
- subsequent repeated LFD or PCR tests may continue to return positive results
We note that although such testing occurred in the population, it wasn’t in line with the extant guidance at the time.
We find that this behaviour is predictable from the known characteristics of the available tests and is explainable due to the relatively high negative predictive value of the re-testing procedure.
This document takes a modelling approach to investigating this behaviour of the testing system using illustrative, rather than calibrated sensitivities and specificities.
The paper was originally authored by Nick Gent, and Thomas Finnie from the UKHSA Joint Modelling Team in October 2021.
The original paper was updated to include this preface in June 2023 and adapted for publishing by the Public Health and Clinical Oversight (PHCO) team which included Chris Kenny, Tom Fowler, Andy Dodgson, Nick Germanacos, Raghavendran Kulasegaran and Edward Blandford with inputs from Emma Bennet in the Data, Analytics and Surveillance (DAS) team.
Key principles
If it is assumed that both LFD and PCR tests perform as expected, the predictive value of these tests is dependent on the prior probability that disease is present, that is the prevalence of infections in the pool of people being investigated.
The positive predictive value (PPV) declines quickly, and in a non-linear way at low prevalence, and the negative predictive value declines quickly, again in a non-linear way, at high prevalence. The curves in Figure 1 below are illustrative of the likely performance of a PCR based test.
For these purposes we have assumed that the initial test sensitivity is 80%, the re-test sensitivity is 90%, and the specificity for both tests 99.7%. However, the principles underlying the observed effects are relatively insensitive to these illustrative values.
(See Peto T, UK COVID-19 Lateral Flow Oversight Team. ‘COVID-19: Rapid antigen detection for SARS-CoV-2 by lateral flow assay: a national systematic evaluation of sensitivity and specificity for mass-testing’ EClinicalMedicine 2021: volume 36, page 100924. doi: 10.1016/j.eclinm.2021.100924. Epub 30 May 2021. PMID: 34101770. PMCID: PMC8164528.)
Figure 1. PPV and negative predictive value (NPV) of PCR-based tests against increasing levels of prevalence
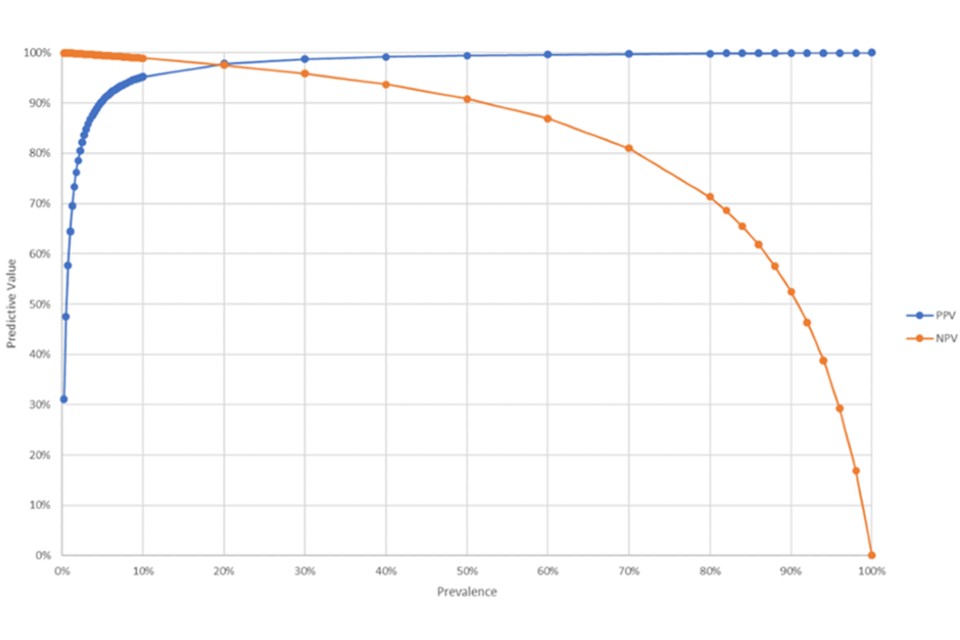
When prevalence is relatively low, PPV is poor and the proportion of false positive results rises.
Re-testing or confirmatory testing reduces the overall risk of a false-positive test by taking all of the initial group of people who tested positive, to form a new pool of people being tested whose prior probability of infection is now relatively high, and who are, therefore, at a more favourable point in the PPV/prevalence curves.
However, this comes at the expense of pushing the performance of the re-test, confirmatory tests into an adverse part of the NPV/prevalence curve.
Illustrative findings
Working this through as an illustrative flow diagram for a prevalence of 1% we get the following outcomes from 10,000 tests:
Flowchart 1. Breakdown of the different outcomes from testing 10,000 individuals based on 1% prevalence of infection
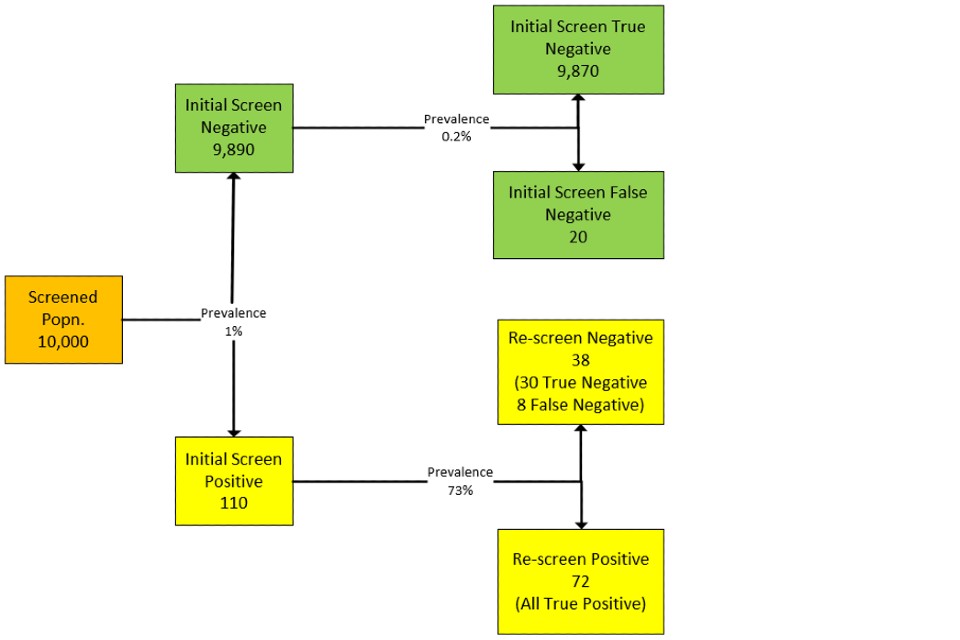
Note the relatively high ratio of false to true negatives in the re-tested group.
Text equivalent of flowchart 1
Screened population of 10,000 at prevalence 1% leads to 9,890 negatives and 110 positives.
Path 1. Re-screening or re-testing of the initial screen negatives of 9,890 at 0.2% prevalence would result in 9,870 true negatives and 20 false negatives.
Path 2. Re-screening or re-testing of initial screen positives 110 at prevalence of 73% would result in 38 re-screen negatives (30 true negative, 8 false negative) and 72 re-screen positives (all true positive).
End of text equivalent of flowchart 1
If these negatives are then tested again, then as the residual prevalence is high in this group, then there is a very high probability that these false negatives will re-test as true positives (of the 8 false negatives 6 to 7 will test positive on a third round of testing by either LFD or PCR).
Note also that as the prevalence is very high in the re-test group then the PPV of the re-test is going to be more than 99.8% (where the underlying population prevalence is 1% or more), and the re-test positives are for all intents and purposes true positives.
Odds of having an infection given a negative confirmatory or re-screen test result
The scale of these effects will vary by population prevalence and a range of probable outcomes.
Generalising, the performance of the confirmation or re-test will fall as the general population prevalence rises.
Using the test performance noted in the introduction, Table 1 presents the expected outcomes for 10,000 tests with prevalence in the range of 0.25% to 10%
Table 1. Probable testing performance outcomes for different population prevalence
| Population prevalence | Initial test negatives | Initial false negatives | Initial test positives | Re-test negatives | Re-test true negatives | Re-test false negatives | Re-test odds ratio for infection present given a negative re-screen test result | Re-test Positives (≈ true positive) |
|---|---|---|---|---|---|---|---|---|
| 0.25% | 9,950 | 5 | 50 | 32 | 30 | 2 | 0.07 | 18 |
| 0.5% | 9,930 | 10 | 70 | 34 | 30 | 4 | 0.13 | 36 |
| 1% | 9,900 | 20 | 110 | 38 | 30 | 8 | 0.27 | 72 |
| 2% | 9,811 | 40 | 189 | 45 | 29 | 16 | 0.55 | 144 |
| 5% | 9,572 | 100 | 429 | 68 | 28 | 40 | 1.43 | 360 |
| 10% | 9,173 | 200 | 827 | 107 | 27 | 80 | 2.96 | 720 |
Third or subsequent tests
If a discordant result (initial positive/re-test negative) is then subject to a third test, then that test will be performed in a group at a third prevalence that is intermediate between the underlying population prevalence and the re-test pool prevalence. This is likely to be sufficiently high that the PPV will still be extremely high, and the NPV will be less problematic. This will tend to give a test result that is concordant with the initial test result and expose the false-positive confirmatory or re-test result.
Extending the illustration given for the overall 1% population prevalence flow diagram above, we now get:
Flowchart 2. Extended breakdown of the different outcomes from testing 10,000 individuals based on 1% prevalence of infection
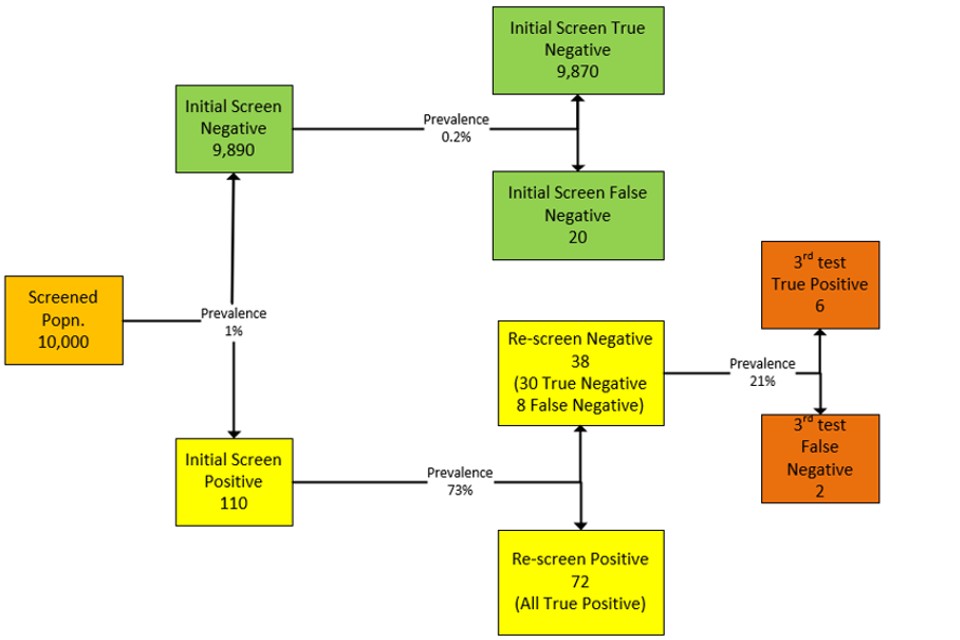
Text equivalent of flowchart 2
Screened population of 10,000 at prevalence 1% leads to 9,890 negatives and 110 positives.
Path 1. Re-screening or re-testing of the 9,890 initial screen negatives at 0.2% prevalence would result in 9,870 true negatives and 20 false negatives.
Path 2. Re-screening or re-testing of the 110 initial screen positive at prevalence of 73% would result in 38 re-screen negatives (30 true negative, 8 false negative) and 72 re-screen positives (all true positive).
Of 38 re-screen negatives (30 true negative, 8 false negative) at prevalence of 21%, a third test of 8 false negatives would result in 6 positive (third test true positive), and 2 third test false negatives.
End of text equivalent of flowchart 2
This suggests that the correct interpretation for a sequence of tests that run positive–negative–positive, is that the confirmatory or re-test result was a false negative.
Generalised performance curves
Generalising these results for population prevalence in the range 0% to 10% we can derive a likely value for the NPV of the confirmatory or re-test.
Figure 2. PPV for LFD test alone and LFD with PCR combination against population prevalence
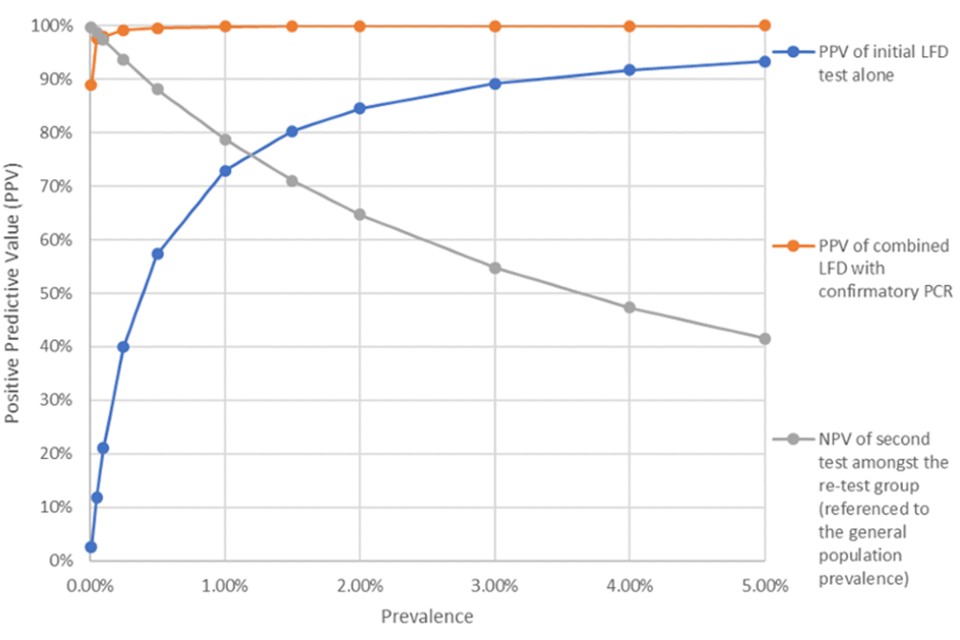
We have not plotted the PPV for the second test as this will lie in the region above 99.8% where the general population prevalence is 1% or above.
Summary
The performance of the confirmatory or re-test element of the large-scale testing programme will vary according to the general population prevalence, and in general a negative confirmatory or re-test will be less reliable as the general population prevalence rises.
A positive confirmatory or re-test will remain reliable.
A discordant negative confirmatory or re-test (usually PCR) in a series of positive LFD tests is almost certainly due to a false negative confirmatory or re-test.