SPI-M-O: Consensus view on the potential relaxing of social distancing measures, 4 May 2020
Updated 13 May 2022

© Crown copyright 2022
This publication is licensed under the terms of the Open Government Licence v3.0 except where otherwise stated. To view this licence, visit nationalarchives.gov.uk/doc/open-government-licence/version/3 or write to the Information Policy Team, The National Archives, Kew, London TW9 4DU, or email: psi@nationalarchives.gov.uk.
Where we have identified any third party copyright information you will need to obtain permission from the copyright holders concerned.
This publication is available at https://www.gov.uk/government/publications/spi-m-o-consensus-view-on-the-potential-relaxing-of-social-distancing-measures-4-may-2020/spi-m-o-consensus-view-on-the-potential-relaxing-of-social-distancing-measures-4-may-2020
Note added for publication
This paper contains estimates of R for some regions of the UK. Please note that these are estimates from individual modelling groups, and not agreed consensus estimates from SAGE. The estimates cited in this paper are for specified scenarios, and are not forecasts.
R is an average value that can vary in different parts of the country, communities, and subsections of the population. It cannot be measured directly so there is always some uncertainty around its exact value. Regional estimates are subject to greater uncertainty given the lower number of cases and increased variation.
1. 4 modelling groups (Bristol, Imperial, London School of Hygiene and Tropical Medicine [LSHTM], and Warwick) studied the impact of potential future changes to social distancing measures as follows. The changes in in the below table were based on the safer workplaces workstream.
| Work contacts | Leisure contacts | Children in school | |
|---|---|---|---|
| Phase 1 (from 11 May) | 20 percentage point increase on current level. | No change to current level. | 11% (vulnerable children and children of key workers.) |
| Phase 2 – scenario 1 (from 1 June) | 10 percentage point increase on phase 1. | 10% increase on current levels. | 25% total (add in transition years). |
| Phase 2 – scenario 2 (from 1 June) | 10 percentage point increase on phase 1. | 10% increase on current levels. | 50% total (add in all primary schools). |
| Phase 3 (from 1 July) | 10 percentage point increase on phase 2. | 30% increase on current levels. | 60% total (transition years plus all primary). |
| Phase 4 (from 15 August) | 10 percentage point increase on phase 3. | 75% increase on current levels. | 100% (from September). |
These phases were run under 2 scenarios of either a maximum of 15 contacts per index case or a maximum of 30 contacts per index case, both with highly effective contact tracing which could reach 80% of contacts within 48 hours.
2. Note that modelled changes in contact patterns may not reflect the final policies under consideration. The list of policies was not finalised in time for SPI-M to be commissioned to model them directly. However, assumptions and approximations will always need to be made when translating the real world into models, and it will never be possible to provide a direct read across. Insights can be drawn from modelling to inform a range of policy scenarios as they develop.
3. The different modelling groups have different assumptions about the current overall reproduction number in the UK, reflecting true uncertainty. Whilst the groups all thought that R in the UK overall was less than one, LSHTM’s modelled estimates were of R currently being about one in some regions of England, particularly the East of England, and the North East and Yorkshire. Estimation of current R is complicated by the presence of interacting epidemics in the community, hospitals, and care homes. LSHTM’s figure may be an overestimate of R in the community due to the impact of transmission in hospitals on their overall estimates of R.
Phase 1
1. All groups found that changes in line with phase one would make only a modest impact on the current reproduction number, so R remains below one and incidence continues to fall in most areas, although with some regional variation.
Phase 2
2. There were differences in findings for scenario 2, with results depending on the assumptions made around susceptibly of children to infection and the role in transmission of people who are asymptomatic or pre-symptomatic.
3. There was consensus that high quality contact tracing would be needed during this phase in order to keep R below one.
4. Bristol, Warwick and LSHTM’s results had little variation between schools re-opening for primary school children and those from transition years. Imperial’s results suggested that the latter would result in a larger increase in R, primarily due to there being a greater proportion of parents able to return to work.
5. Bristol and Warwick found that, with effective contact tracing, either scenario would be consistent with maintaining R less than one. LSHTM found that even with effective contact tracing, in either scenario R would be equal to or greater than one in some regions. In those regions, incidence does not fall. Imperial found that scenario one would allow R to remain below one, but scenario 2 would not, although incidence would only slowly increase.
Phases 3 and 4
6. Phases 3 and 4 have not been discussed in detail by SPI-M, however most models showed in a rapid exponential increase in numbers of cases in phase 4.
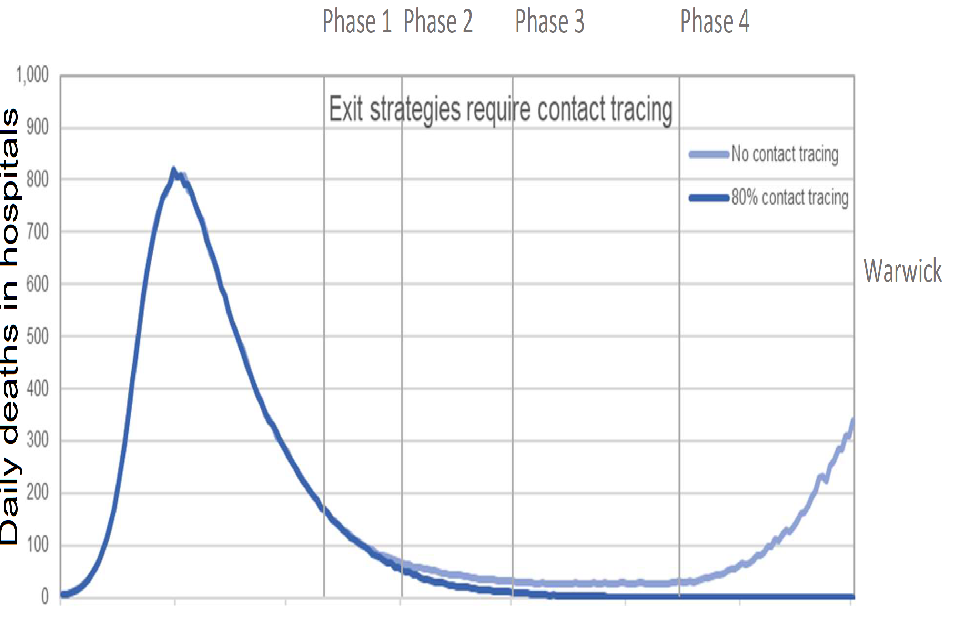
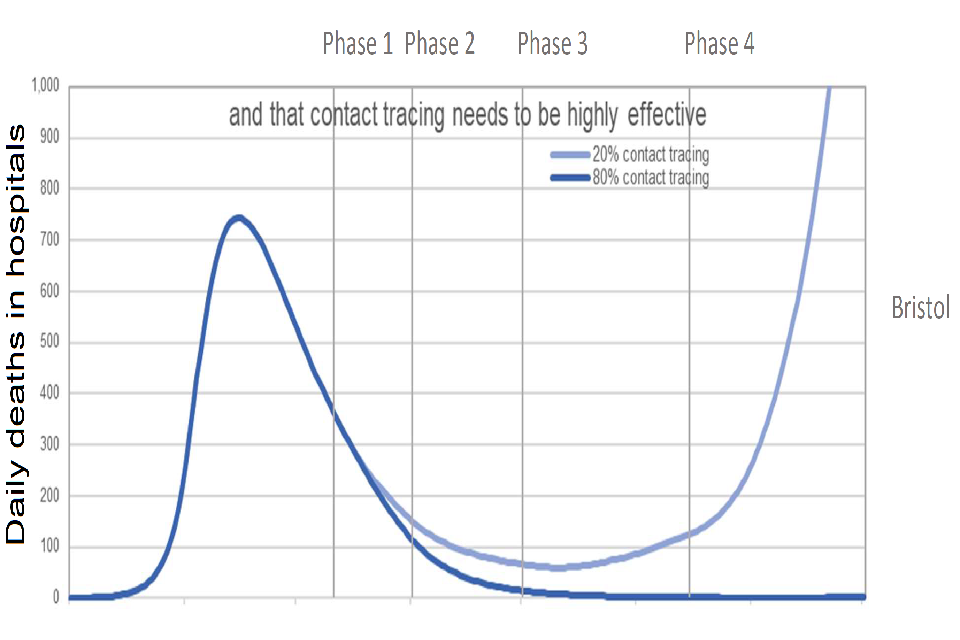
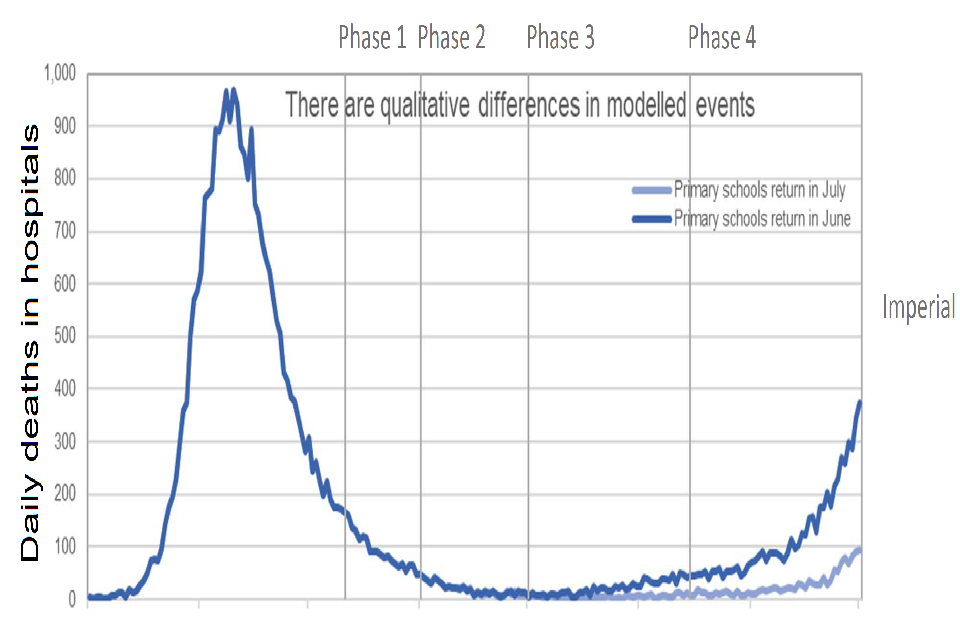
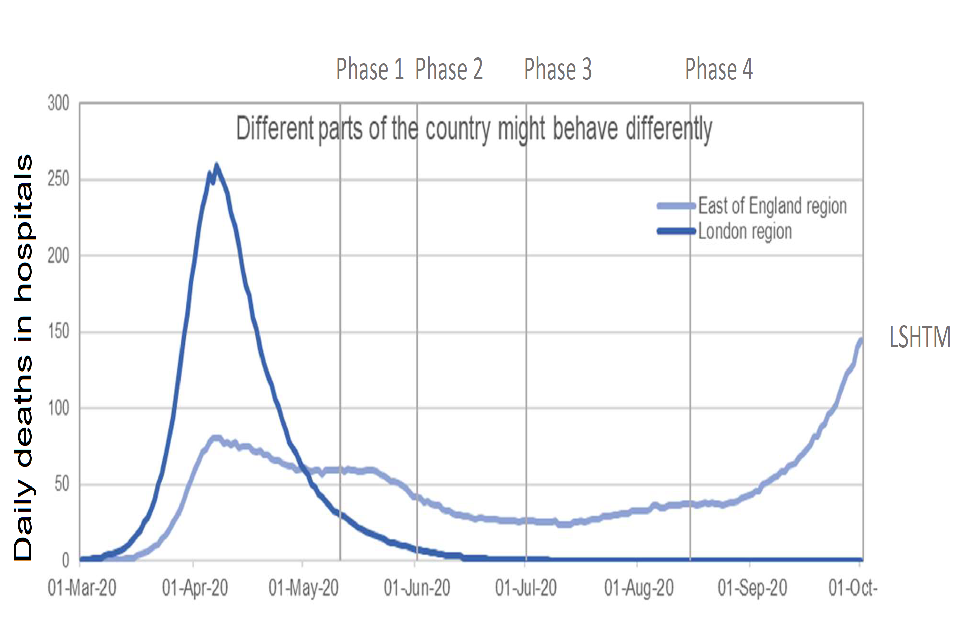
4 graphs of daily deaths in hospitals from 1 March to 1 October 2020. Graphs present data from different modelling groups: Warwick; Bristol, Imperial and LSHTM. Each has two plotted trajectories: a dark and light blue line.
General conclusions
7. High levels of health care acquired infections and cases in care homes makes it very difficult to accurately estimate the current value of R due to community transmission, and therefore the impact of future policy changes on the trajectory of the epidemic.
8. Behavioural changes in the levels of adherence rates are critically important, likely more so than the exact policies implemented, in determining whether the reproduction number remains below one. Such changes cannot be forecast and therefore have not been included in these models. Even with contact tracing in place, there will need to be sustained, deep reductions in contacts outside work and schools to keep the reproduction number below one.
9. The changes in phase one are likely to allow R to remain below one, if adherence rates do not drop. Any changes in adherence rates or behavioural changes could have a much larger impact than specific policies. For example, R would increase if more children going to school resulted in more workplace contacts for their parents.
10. Assumptions made about the cases currently taking place in hospital settings and care homes has a big impact on any conclusions that can be drawn on the changes made in phase 2.
11. Very effective contact tracing is essential for any changes that take place after phase 2.
12. There is regional variation in both current incidence and current reproduction numbers which will need to be monitored very closely. There will also be more localised variation, which could cause localised outbreaks, even if the reproduction number remains below one overall nationally.
13. Some potential policy changes, such as permitting more outdoor activities that maintain social distancing (such as sitting outside alone or as a household), will have a negligible impact on R. People working in businesses involving close, sustained contact with many people, however, could have levels of infection as high as those seen in social care, as well as increasing transmission in the community. Such businesses could include hairdressers, nail bars, and other personal care services.