SPI-M-O: Comments on social distancing measures, 22 June 2020
Updated 13 May 2022

© Crown copyright 2022
This publication is licensed under the terms of the Open Government Licence v3.0 except where otherwise stated. To view this licence, visit nationalarchives.gov.uk/doc/open-government-licence/version/3 or write to the Information Policy Team, The National Archives, Kew, London TW9 4DU, or email: psi@nationalarchives.gov.uk.
Where we have identified any third party copyright information you will need to obtain permission from the copyright holders concerned.
This publication is available at https://www.gov.uk/government/publications/spi-m-o-comments-on-social-distancing-measures-22-june-2020/spi-m-o-comments-on-social-distancing-measures-22-june-2020
1. The following comments are provided to SAGE for their meeting on 23 June, to form part of the response to a commission received from Cabinet Office on 18 June. They have been signed off by the SPI-M co-chairs following work by, and discussion with a subgroup of SPI-M-O members. Paragraphs 2 to 8 give a view on what could be done on reintroduction of measures at a national level in response to question. Paragraphs 9 onwards provide some input into question 5 in the commission.
Question 4: SAGE is asked to provide a view on which measures would have the biggest impact on reducing the rate of infection, and should therefore be considered for reintroducing first at a national level?
2. The choice of which measures to reintroduce in order to reduce transmission depends on which interventions have been relaxed, and the subsequent behavioural response to this. As such, monitoring and collecting data on behaviour as measures are relaxed is critical. SPI-M-O suggest that such data are reviewed and gathered in one place for easier analysis.
3. Contact tracing and outbreak investigation are likely to be the best source of information on where and when transmission is occurring and within which groups, providing that all relevant data or fields are collected. This will be more informative than further modelling at this point. Although we believe that questions about occupation have been added to the contact tracing data, SPI-M-O have not been granted access to the necessary detailed line list data as yet. Data about history of location of the cases in the previous 5 to 8 days could also be very informative.
4. Rather than focusing on re-introduction or relaxation of individual measures in isolation, it is necessary to consider a package of interventions as a whole and what implications one measure may have for the choices in other areas. This could include the use of ‘ready reckoners’ that explore the impact on transmission from one intervention to be weighed against other impacts – for example, closing schools may have a similar impact to closing retail at that point, and a choice between 2 very unappealing options may be necessary.
5. SPI-M-O do not believe it is possible to return to a ‘pre-COVID’ normality, without levels of contact tracing and COVID-19 security effectiveness that would be difficult to achieve, without some sort of additional increase in immunity, either through vaccination or infection. As a result, thought should be given to the triggers for when measures should be reintroduced, what metrics should inform this, and what further data and information may need to be collected.
6. National reintroduction of measures will only be necessary if transmission gets out of control over wide geographical areas or in many sectors simultaneously. Reacting early and appropriately to local outbreaks should be sufficient if incidence is kept generally low and there is enough data to quickly detect outbreaks. Generally, more stringent measures (for example closing schools and retail simultaneously) will need to be in place for a shorter time than less stringent measures (for example closing retail only) to achieve the same reduction in incidence.
7. There is another dimension to consider – time. Any changes in social distancing measures (either relaxation or reimplementation) do not need to balance immediately. A short period of time with R above one would not result in a second wave. If R is kept below one over the summer, leading to a decrease in incidence, there will be more scope for changes later in the year.
8. Although the specific question is on national measures, the geographical scale of the metrics and reintroduction of measures could be regional rather than national and requires further consideration.
Question 5: SAGE is asked to provide an updated ‘ready reckoner’ figure, setting out how R increases as social contacts increases, based on the current understanding of NHS Test and Trace capacity?
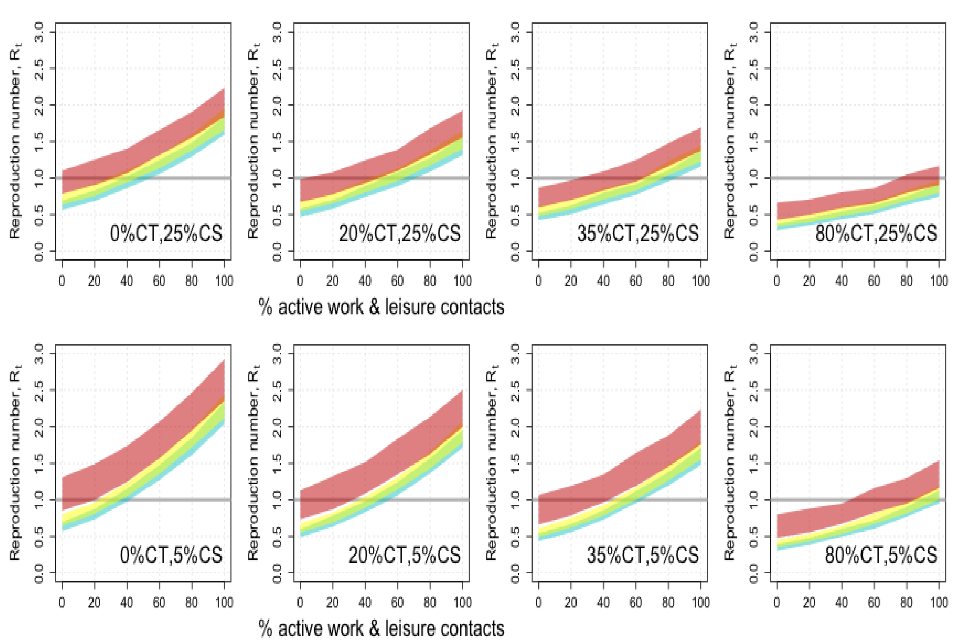
9. Each of the 16 graphs below demonstrate the relationship between the reproduction number R (vertical axis) and the proportion of pre-COVID contacts made outside home and school (horizontal axis) with bands representing 3 different school opening policies. The different columns show different levels of contact tracing [CT] efficacy. The different rows show different levels of ‘COVID security’ [CS] (see paragraph 11).
10. ‘Contact tracing efficacy’ is defined as the percentage of onward transmission events that do not take place because a symptomatic case had been followed up by the contact tracing capability. There is assumed to be no limit on the number of contacts traced per index case (consistent with NHSTT’s handling of ‘complex cases’). CT efficacy increases from 0% in the left-hand column to 80% on the right.
11. ‘COVID security’ refers to the effectiveness of risk mitigation measures at reducing transmission for a given contact. Although specific measures cannot be modelled this represents factors such as, but not limited to, the wearing of facemasks, the physical distancing guidance and increased levels of cleaning. ‘X% COVID secure’ means that a given contact between an infected person and a susceptible one is X% less likely to result in the latter becoming infected, compared to a situation with no mitigation in place. In collaboration with the chairs of SAGE’s Environmental Modelling Group, we have agreed that it is not plausible that this reduction could be higher than 75%.
12. The different coloured bands in each graph refer to 3 school opening scenarios. The widths of the bands represent 95% confidence intervals created by bootstrapping across individuals surveyed in the underlying behavioural study.
13. This work is driven by assumptions about a number of unknown parameters: the degree of infectiousness of children of different ages, the efficacy of contact tracing, the extent to which transmission outside the home can be controlled, and the balance between transmissions within a household versus those in the world to name a few. Although different models with the same input parameters give qualitatively similar results, these graphs should be used to give general guidance only and do not provide a precise prediction, particularly for the impact of school closures on transmission. Despite these ongoing uncertainties we believe this figure can help in considering the routes from uncontrolled spread, through successful lockdown to a sure-footed return to a vibrant and secure communal life.
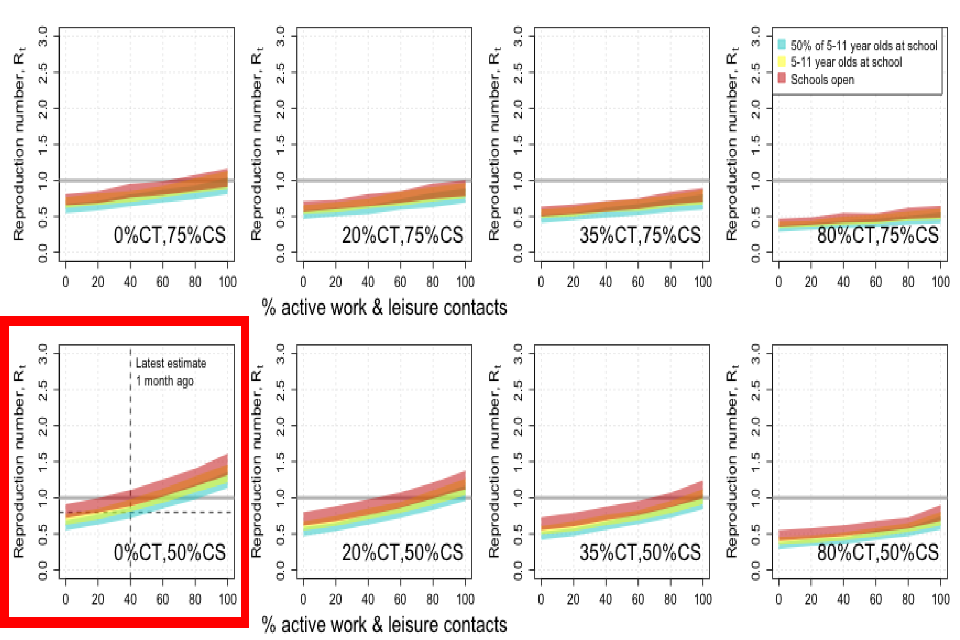
14. SPI-M-O believes that neither the top row nor the right-hand column of this figure is likely to be achievable in a sustainable manner for all communities across the UK. Current, admirable, initial operating capacity of NHSTT is roughly around 20% by this metric of CT efficacy.
15. There is a lag of several weeks between infections occurring and their being reflected in healthcare data and, therefore, estimates of R. As a result, current consensus estimates of R reflect the situation as it was around the start of June. As a result, the highlighted plot shows our best assessment of the situation at that point, before any ‘step 2’ social distancing changes came into effect and with minimal contact tracing. Whilst it is impossible to quantify the level of COVID-19 security with any degree of accuracy, our best assessment is that the population has around 40% of its normal contacts and approximately 50% COVID-19 security, in line with R of around 0.8. The dashed lines on the highlighted graph represent this.
16. This modelling demonstrates that even with highly effective contact tracing (the rightmost column), significant levels of social distancing (stopping us moving to the right-hand side of each plot) or COVID-security (stopping us moving to the bottom rows) must be kept in place to keep R below one and therefore prevent a large second wave.
17. In order to be able to re-open schools in September without causing a second wave, it therefore critical that some measures remain in place, so that the reproduction number remains below one at the start of September when all children return to school (the red band).
18. As can be seen from the plots, successful COVID-19 security has the largest impact on the changes in R when contacts are high, more so than improving contact tracing, reopening schools, or increasing active work and leisure contacts. There is an interaction between COVID-19 security and contact tracing; the more effective COVID-19 security is, the lower rates of transmission will be and therefore the smaller the impact that contact tracing can have. As the former works more effectively, there is less scope to reduce transmission still further through contact tracing and so more leeway would be available to open other parts of society.
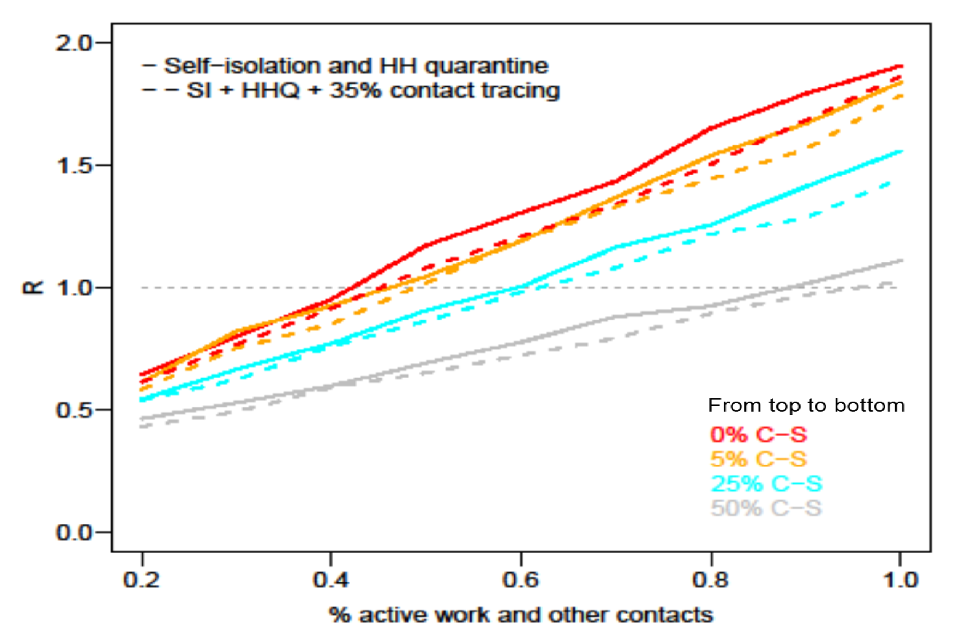
19. These results are robust across 3 independent surveys of contacts between people. These separate contact survey data sets have been used in the analyses run by SPI-M-O contributors and all showed very similar patterns. Another group who used a different set of contact survey data showed that when self-isolation and household quarantine are in place, contact tracing in which 35% of contacts are traced and isolated within 72 hours of the index case self-isolating has relatively little additional impact (compare solid and dotted lines below).This study replicates the finding that good COVID-19 security has a large impact.
20. Completely opening schools now could lead to R increasing to around one. In order to open schools and allow a higher level of work and leisure contacts than is currently possible, COVID-19 security would need to improve, and highly effective contact tracing would be needed. Contact tracing is less likely to be effective when incidence is high, so a sustained period where R is below one would make it more likely that schools could open safely in September. Furthermore, if incidence is lower, a longer period of R greater than one would be needed before healthcare capacity would be overwhelmed in a second wave.
21. In all these scenarios, it was assumed that children were as susceptible to infection and as infectious as adults. It is possible that children are less susceptible and or less infectious than adults. In that case, the increase of the reproduction number from school opening would be smaller. The red, yellow, and green bands would be lower down and overlap even more with the blue band.