SPI-M: Mass testing of the whole population, 25 November 2020
Updated 13 May 2022
Date: 10 November 2020, updated with further work on 18 November and 25 November.
Final version
This note gives high-level advice on the role that a single round of mass testing of the whole population could have on the epidemic. There has been considerable previous work from SAGE on mass testing, including contributions from SPI-M. This can be read here (TFMS: Consensus statement on mass testing, 27 August 2020) and here (SPI-M-O: Statement on population case detection, 9 September 2020). This note does not replace that advice.
If done successfully, mass testing of a large proportion of the UK’s population could identify a large number of infected people. This alone will not reduce transmission – this will only happen if people who are early in their infection successfully isolate (and if these people would not have isolated otherwise, or would have isolated later). A one-off period of mass testing should not be thought of as reducing R, but as reducing post-testing prevalence compared to what it otherwise would have been. Once the testing period is over, if no additional control measures are put in place, the epidemic will return to its previous growth rate from a reduced level of infection.
Focused, more frequent testing of people who are at higher risk of being infected and of infecting others (such as key workers, health and social care workers and people in high prevalence areas) is likely to have a bigger impact than less frequent testing of the whole population. It is plausible that targeting groups who are less likely to have symptoms (and therefore less likely to be picked up from symptomatic testing), such as younger adults, may have a greater effect but we are not aware of any work evaluating such a strategy. More work is required to identify the groups and places that would maximise the yield and impact of mass testing.
As previously noted in the TFMS paper, mass testing of asymptomatic people, even with a highly specific test, will result in a high proportion of false positive tests. If people who test positive are required to immediately take a second test and are only required to isolate after 2 positive tests, the number of people required to isolate unnecessarily would be greatly reduced. If mass testing were undertaken with a prevalence of 0.3% and a test with 70% sensitivity and 99.5% specificity, only around 29% of those who test positive once would actually be infected with SARS-CoV-2. With 2 tests, this would rise to around 98% if the probability of each false positive was independent and somewhat lower if it were not (which would be less likely if the second test was PCR). Even at 1% prevalence (akin to the start of the national measures implemented in England on 5 November), only 58% of single positive tests would be true positives if test sensitivity were 70% and specificity were 99.5%.
An alternative use of repeated testing would be to identify those people who were infected at the time of their first test but not yet infectious and not yet testing positive. This would be done by giving a second test several days later to everyone who initially received a negative result. This would, of course, require considerably more tests to be performed. The interval between these tests should be shorter than the duration of infectiousness, which is around a week. Although such a strategy would identify a greater proportion of infections, it would greatly increase the number of people who are asked to isolate.
If mass testing of asymptomatic people were to be followed as a strategy, it is critically important that the right set of incentives are put in place to support people to isolate on receipt of a positive test. It is also critically important that data on those being tested are collected so that the impact of the programme can be determined. This should include keeping a record of the details of people who test negative as well as positive, and how many tests they have undertaken. The people who come forward for testing may not be representative of the general population so overall prevalence of infection should be estimated using the ONS and REACT surveys, not mass testing.
How long does the benefit of mass testing last?
The below is a deliberately simple estimate of the plausible effect of mass testing. More detailed modelling of any proposed strategy should be undertaken to support any policy.
Assuming that the scale of a mass testing approach means that it is not feasible to trace the contacts of those testing positive, the reduction in prevalence (amongst the population in general circulation) resulting from mass testing of asymptomatic people would be approximately the percentage of total infected population that are identified during mass testing who then isolate. This would be improved if the whole household were required to isolate if anyone within it received a positive test result. This would effectively increase the sensitivity of the test (so a greater proportion of infected people are asked to isolate) at the cost of decreasing its specificity (so a greater proportion of those isolating are doing so in response to a false positive test).
A one-off period of mass testing can be thought of as akin to a circuit breaker. If contacts and household members of those who test positive are not required to isolate, then to estimate how much time buys requires knowing 3 numbers:
- the proportion of the population who come forward to be tested (x)
- the sensitivity of the test (y)
- the proportion of people who isolate if they get a positive test (z)
Then if isolation prevented all further transmission, the proportion of infectious people still in circulation and transmitting after a single round of testing is 1 – xyz. Let p = 1 – xyz
What happens next depends on the underlying context
1. If the underlying epidemic is growing.
- if p = 1/2 then we get back to our starting number after 1 doubling
- if p = 1/4 then we get back to our starting number after 2 doublings
- in general, the time to get back to day zero numbers is Log2(1/p) multiplied by doubling time
2. If the underlying epidemic is flat.
- if p = 1/2 then we carry on with a half-sized epidemic
- if p = 1/4 then we carry on with a quarter-sized epidemic
3. If the underlying epidemic is shrinking.
- if p = 1/2 then we gain 1 half-life
- if p = 1/4 then we gain 2 half-lives
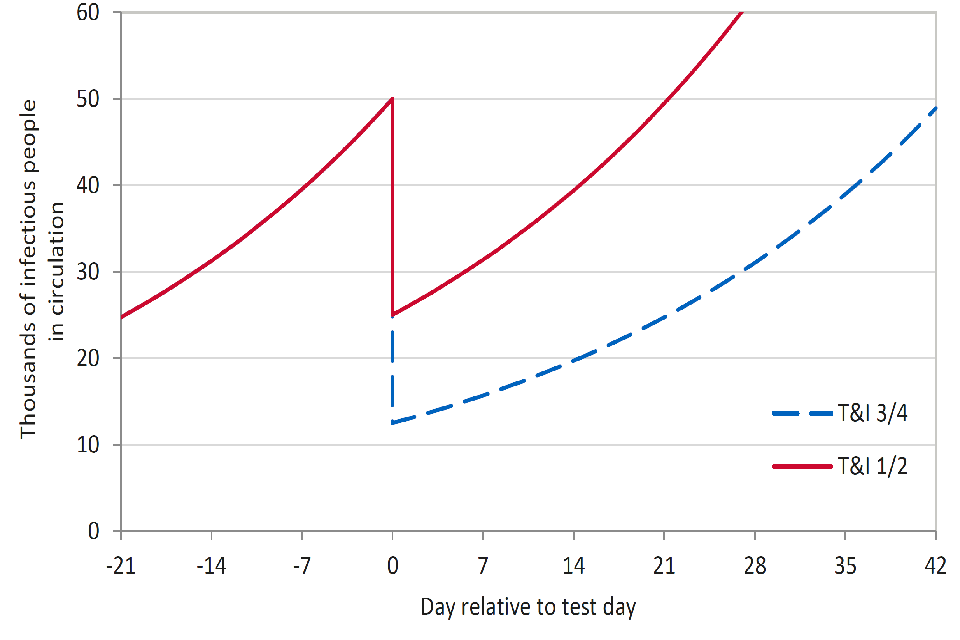
Figure 1: Imagine an epidemic growing with a doubling time of 3 weeks. On day zero, we test and isolate 75% (p = 1/4, blue dash), or 50% (p=1/2, red) of infectious people. With 75% of infectious people tested and isolated, the number infectious who are out and about drops to 25% of what it was. It then takes 42 days (2 doubling times) to get back to the number on test day. If only half of those who are infectious are found and isolated, the return to test day number happens after 21 days (1 doubling).

Making x, y and z as big as possible is crucial to getting durable benefit from mass testing. Test sensitivity, y, needs to be maximised in the real-world context and is likely to be lower than laboratory assessment. The proportion testing, x, and the proportion isolating, z, however, are population specific factors and can be influenced by appropriate communication.
To illustrate the scale of this challenge, if the entire population is offered a single test with 70% sensitivity, 80% of people take up the offer, and 90% of people who test positive completely isolate, then p is approximately 0.5 (red line in Figure 1). Even with these highly optimistic assumptions, this would only effectively buy 1 doubling time – SPI-M’s estimate of doubling time in England as of 4 November, before national measures were implemented, was 19 to 28 days. If mass testing were rolled out in conjunction with restrictions that are looser than were in place pre-lockdown, the doubling time would be shorter and therefore less time would be gained.
Behavioural considerations
SPI-M’s expertise does not lie in behavioural science. Any strategy of mass testing should consult experts in this field to determine:
- how to enable as many people as possible who test positive to isolate
- how to encourage as many people as possible to come forward for testing, particularly in the hardest to reach groups, who may lack the ability, capacity, or the inclination to engage
- whether tying tiers to mass testing (namely, using mass testing in places with higher prevalence and growth rate to try and avoid them entering higher tiers) would improve uptake
The extremely high reported uptake of mass testing in Slovakia is likely to be at least partly the result of requiring people who did not take part to isolate.
Additional comments, 18 November
Further work has provided quantitative estimates of the potential impact of mass testing on the prevalence of infection. Once test assay characteristics, viral kinetics, test sample variations, and within-household transmission from isolated infected people are accounted for, a reduction in prevalence of 15% to 20% might be a realistic ‘best-case’ goal for a single round of highly effective untargeted mass testing. For context, the ONS Community Infection Survey estimates that swab positivity (akin to prevalence) increased by 6% between 31 October and 6 November compared to the week before, and by 50% between 2 October and 8 October compared to the week before. Mass testing, therefore, may only buy us around a week.
Repeated rounds of mass testing, additional comments from 25 November
An alternative approach to a single round of mass testing could be for people in high prevalence areas to be offered repeated rounds of testing over several weeks. The scale of the reduction in prevalence seen under such an approach would be dominated by behavioural factors that are beyond the expertise of SPI-M, but evidently the impact would be greatest if high uptake and compliance to isolation were maintained throughout the testing programme.
Some groups contribute more to the spread of the epidemic than others, due to both high prevalence and high onward transmission. In Liverpool, positivity of mass testing might be lower than one might expect, based on estimated regional prevalence. This may imply that those coming forward for mass testing are less likely to be infected than average. If such a pattern were to be repeated in a programme of repeated rounds of mass testing with the same low-risk individuals being tested in each round, the cumulative reduction in prevalence would be much lower than if people presented for testing at random. This experience is familiar from neglected tropical diseases where it is not uncommon for those at highest risk to be least likely to present for repeated testing rounds, a principle known as ‘systematic non-adherence’. Similarly, studies in the UK [footnote 1] and Sweden [footnote 2] have found that cervical screening attendance was higher in women who are vaccinated against HPV than in those who are not.
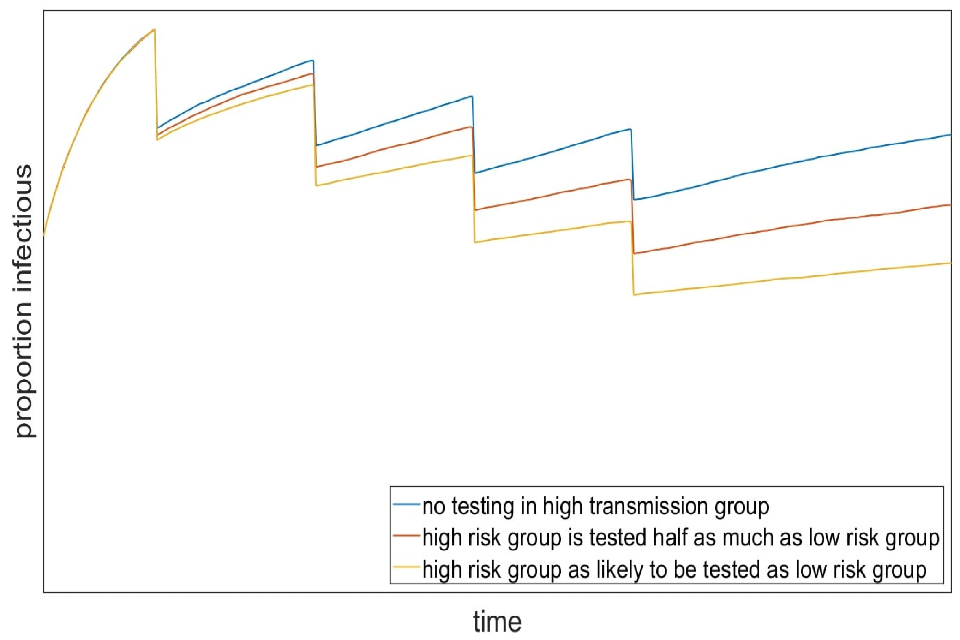
This is demonstrated in work from a SPI-M group using an illustrative model of prevalence under repeated rounds of extremely effective mass testing. This is presented as a qualitative evaluation of this phenomenon and not a quantitative prediction of the expected effects of mass testing. In this scenario, combined test uptake, sensitivity and compliance are sufficiently good that 20% of infected people would isolate. In addition, we assume the population is risk-structured such that one-fifth of the population are twice as likely to transmit or contract the virus as the rest of the population. Figure 2 shows that if people in the high transmission group are less likely to come forward for testing (blue line) then the impact of each round of mass testing is progressively reduced from 20%.
Figure 2: Illustrative scenario showing prevalence over repeated rounds of mass testing where 20% of the population are twice as likely to transmit or contact the virus, and those people are not tested (blue), tested half as much as the low transmission group (red) or as likely to be tested as the low transmission group.

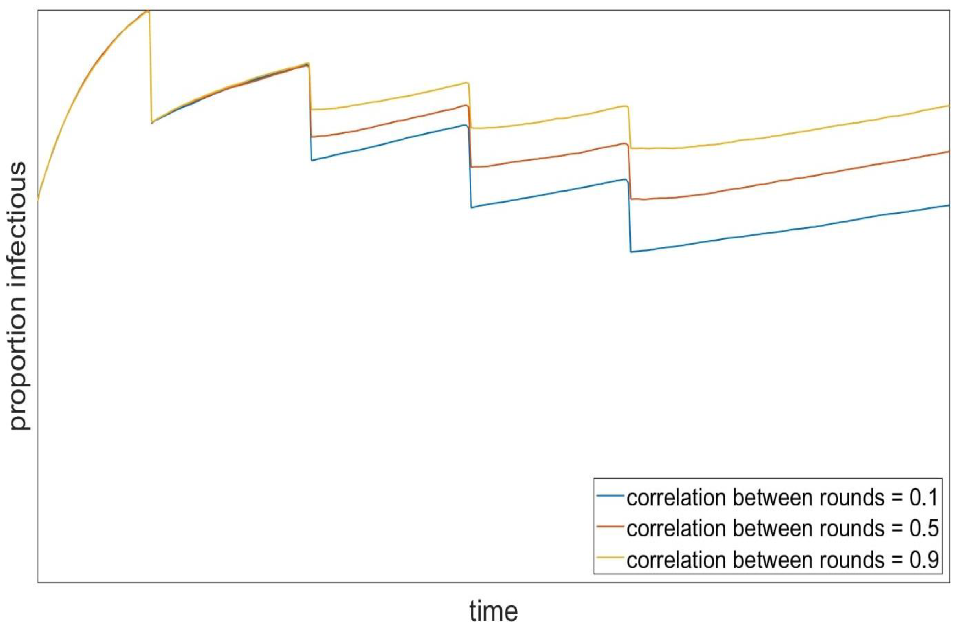
Similarly, the relative benefit seen in later rounds of testing would be smaller if the same people are more likely to repeatedly come forward for testing, regardless of whether they in the higher or lower transmission group. This is illustrated by Figure 3, where the yellow line shows a scenario where the same people are much more likely to be tested in each round and the blue line shows one where this relationship is much weaker.
Figure 3: Illustrative scenario showing prevalence over repeated rounds of mass testing where the correlation between who presents for testing is low (blue = 0.1), medium (red = 0.5) and high (yellow = 0.9).

