FQSSG fingerprint interpretation workshop summary (accessible version)
Published 3 February 2022

© Crown copyright 2022
This publication is licensed under the terms of the Open Government Licence v3.0 except where otherwise stated. To view this licence, visit nationalarchives.gov.uk/doc/open-government-licence/version/3 or write to the Information Policy Team, The National Archives, Kew, London TW9 4DU, or email: psi@nationalarchives.gov.uk.
Where we have identified any third party copyright information you will need to obtain permission from the copyright holders concerned.
This publication is available at https://www.gov.uk/government/publications/fqssg-fingerprint-interpretation-workshop-summary/fqssg-fingerprint-interpretation-workshop-summary-accessible-version
Introduction
This document contains a summary of the presentations given and discussions had at the workshop for fingerprint interpretation hosted by the Forensic Science Regulator on the 8 October 2021 as part of the work programme for the Fingerprint Quality Standards Specialist Group (FQSSG).
Acknowledgements
Many thanks are given to those who presented at the workshop for your time and insight, and to those who participated in the workshop through questions and contributions in breakout rooms. Thanks also go to the Forensic Science Regulator Secretariat and members of the Forensic Science Regulation Unit for organising and facilitating the workshop.
Evaluative opinion: what it means for fingerprints
Presentation by Professor Christophe Champod, from the School of Criminal Justice, Faculty of Law, Criminal Justice and Public Administration, University of Lausanne
Currently, outcomes of fingerprint examinations can be reported as ‘identified’, ‘excluded’, ‘insufficient’, or ‘inconclusive’. The conclusion of an identification is based on training, knowledge, and experience, but is not traditionally explicitly supported with statistics. The Forensic Science Regulator (FSR) document on fingerprints is clear that the identification opinion should be reported as an opinion, not a statement of fact; the FSR document on Evaluative Opinions (FSR-C-118) provides insight into how outcomes can be reported robustly without being categorical.
The key issues to be addressed when examining fingerprint matters can be issues at source level (who does the print belong to) and activity level (how or when did the print become deposited). The content of the presentation considered source level only. For source level issues there is always a pair of propositions:
- Hp = Prosecutor allegation – the finger mark came from the person of interest (POI)
- Hd = Defence allegation – the finger mark came an unknown person other than the POI
The FSR document on Evaluative Opinions (FSR-C-118) states that the role of the expert is to consider the probability of the observations (O, made between the mark and the known print) given the propositions, not the probability of the propositions in the light of the observations. The assignment of probabilities will be based on a range of knowledge, of which experience partly constitutes if there is concrete documentation for that experience. Statistical models can also provide support for the assignments of these probabilities.
The likelihood ratio (LR) encapsulates a simple proposal in a mathematical form; the weight of the findings is derived from a simple division between two probabilities:
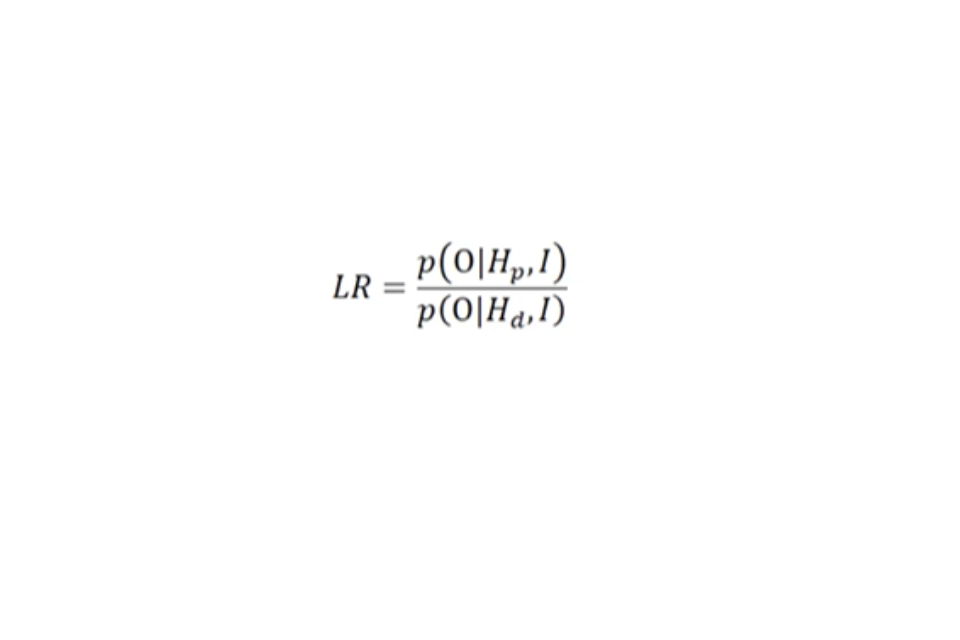
The numerator (top part of the equation of the LR) is the probability of the observations given that the prosecution proposition is true.
The denominator (bottom part of the equation of the LR) is the probability of the same observations but given that the defence proposition is true.
Two questions are at the core of any assessment of findings:
- a. What is the probability of observing the features in the mark (given their tolerances) if the mark originates from the suspect? This speaks to the reproducibility of features.
- i. The more probable these observations are, the higher (closer to 1) the numerator value.
- ii. If differences can’t be explained by distortion or other mechanisms the probability will be low and the numerator will be a low value (closer to 0).
- b. What is the probability of observing the features in the mark (given their tolerances) if the mark originates from an unknown individual? Alternatively, this could be phrased, what is the probability that you will find another person who will produce a print with features in agreement with the mark within the tolerance you have allowed? This speaks to the rarity or discriminability of features.
The balance between reproducibility (numerator) and discriminability (denominator) speaks to the weight of the evidence. This encapsulates a process of thought that is already done, just in words that we may not be accustomed to in the fingerprint domain.
Data driven approaches can help to quantify the strength of such an association. XENA is an AFIS based score likelihood model used at the University of Lausanne, which computes a likelihood ratio by:
- a. Constructing the ‘red curve’, (Figure 1) which reflects the distribution of the scores you obtain if you take the print and simulate pseudomarks – a model of distortion of a finger that produces potential marks as if you would touch an object. The more distorted the mark compared to the print, the further it is from the expected mean.
- b. Constructing the ‘blue curve’, (Figure 1) which is a distribution obtained from comparisons of the mark against all the entries in the database which is free from the person of interest. These scores are much lower because of the selectivity of the fingerprint pattern.
- c. If the within source variability (red curve) can be separated from between sources variability (blue curve), it means that you can statistically distinguish entities coming from the same or different sources.
- d. Compute the score between the mark and print, and check where it lies.
- e. Calculate the likelihood ratio by dividing the height of the density under the red curve by the density under the blue curve.
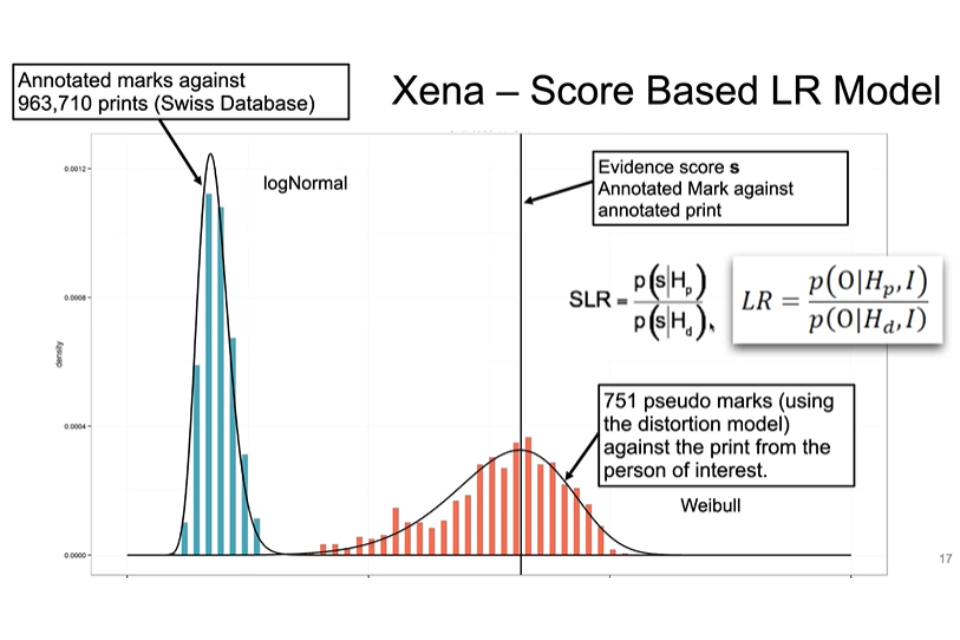
Figure 1. Score based LR Model
A statement properly expressing the likelihood ratio obtained would be, “the observations made are of the order of 185,000 times more likely if the mark and the print share a common source, as opposed to different sources”.
There is a relationship between the likelihood ratio and an opinion of identification, but it is not direct. The expert will decide an identification when the likelihood ratio is judged as sufficiently high in their opinion to safely take that decision bearing in mind some assumed other evidence.
Toward Probabilistic Approaches in the Finger mark Examination: The United States Experience
Presentation by Henry Swofford, Principal forensic analyst at HJS Consulting, LLC
In the US fingerprint examination is mostly performed by small law enforcement agencies, and a wide number of people are impacted by best practice standards. Committees have reviewed the scientific foundations of fingerprint examination, and provided opinions that, whilst favourable in some respects, ultimately raised questions in the US about the underlying validity and reliability of fingerprint examination.
Conclusions that claim certainty cannot be supported, so to ensure enduring admissibility of expert testimony there is consensus that pattern evidence needs to move towards a probabilistic framework. Switching from a categorical to a probabilistic approach does not require sophisticated software or statistical tools but could be based on expertise and a semantic change to ensure experts are not making claims in court that cannot be supported. However, statistical tools can support the examination process and strengthen examiners’ conclusions. There is a strong consensus that likelihood ratios are an appropriate framework for expressing fingerprint conclusions and a consistent approach will be important.
In 2015, the US Army Criminal Investigation Laboratory (USACIL) moved away from ‘identification’ terminology towards more probabilistic language. Then, in 2017 the USACIL implemented FRStat, a software that is publicly accessible and freely downloadable , to provide an empirical foundation to experts’ conclusions. The FRStat calculates a statistic summarising the similarity between feature configurations on two separate images of friction ridge skin impressions. Using this statistic, the FRStat calculates the conditional probabilities of a given similarity statistic value or more extreme among datasets of values from mated and non-mated impressions of friction ridge skin. Although this approach is not a likelihood ratio, it provides a numerical value representing the strength of an association for quality assurance purposes.
In 2018, OSAC (Organization of Scientific Area Committees for Forensic Science) Friction Ridge Subcommittee (FRS) voted to move away from the categoric framework and towards a probabilistic framework. The terminology of ‘source identification’ was retained due to its familiarity but redefined to aligned with the new approach. OSAC FRS recognise that conclusions can be expressed in 1 of 3 ways, with none being more preferable but all being important:
- a. Expert opinions utilising knowledge, training, and experience
- b. Expert opinions utilising quantitative support from a probabilistic model
- c. Conclusions derived directly from and entirely dependent on a probabilistic model
In 2018, very few (approximately 2%) practitioners were expressing observations probabilistically. The main reasons for not reporting probabilistically were concern that conclusions would be misused to create doubt in the case, or that there would be misunderstanding of how to interpret conclusions. However, research has shown that adult jurors can make distinctions between probabilistic evidence, and value it the same as categorical evidence. This suggests the concern that a probabilistic framework will confuse juries or undervalue fingerprint evidence is unfounded.
A beneficial by-product of moving to a probabilistic approach was that it expanded the conclusion scale, introducing two new conclusions of ‘support for different sources’ and ‘support for same sources’, which broke up the inconclusive band. An expanded conclusion scale allows consideration of marks that were previously ‘inconclusive’, thus preventing the value of some marks being masked.
To ensure the long-term sustainability of probabilistic reporting, training to establish foundational knowledge in statistics and probability theory is needed to support examiners’ confidence and competence.
Many examiners do not have strong backgrounds in core scientific principles or understanding of probability and statistics, which blurs focus on why these changes are necessary as fear of ‘messing up’ and damaging professional representation hinders understanding of how the changes will strengthen fingerprint evidence rather than weaken it. Although explaining probabilistic reporting to lay factfinders may be challenging, probabilistic reporting is beneficial because:
- a. It is necessary to promote enduring admissibility
- b. It provides more appropriate representations of the strength of evidence
- c. It may increase the information provided to courts – e.g. marks previously considered no value
Ultimately, adopting probabilistic reporting will require that policy makers mandate probabilistic reporting, and lab managers to invest in training practitioners to promote comfort in using probabilistic reporting when providing testimony.
End-User Validation of “Xena”
Presentation by Dr Glenn Langenburg, from Elite Forensic Services, LLC
The Score Based Likelihood Ratio Model Xena is being validated from a mathematical perspective, but end users won’t know how to do mathematical validations. Assuming that the theoretical validation is done, it is important to consider how the end user would demonstrate whether the model is fit for use.
The likelihood ratio is a ratio of two probabilities under two competing propositions (the donor of the print is the source of a mark vs the donor of the print is not the source of a mark). To get these probabilities, two questions are asked:
- a. How different can latent prints look when from Mr X? - considering natural range of variability, distortion, tolerance.
- b. How similar can latent prints look when not from Mr X? – considering how close they can be from two different people, specificity, random match probability.
There are limitations of Xena to consider, including that it does not consider palms, joints, fingertips, or feet but only what would be on a standard 10-print record. The tool is also strongly influenced by human input and variability, cannot account for missing minutia and large open fields, and uses a score based AFIS approach and probability density functions, not ‘true’ likelihood ratios and frequencies.
The model can provide insight into the discriminability of the arrangement of minutia which is more critical in examination outcomes rather than the number of minutia. Statistical models for fingerprint evidence have generally shown that fingerprint minutiae are highly discriminating.
An important aspect of model performance, the rate of misleading evidence, is how often you get a negative likelihood ratio when the mark comes from the same source, and how often you get a positive likelihood ratio when coming from different sources.
XENA has been tested in the way it would be used in casework, by running trials of marks of various quantity and quality. Each mark trialled had a ground truth mate, and a close non-match mate found from running the mark through a database excluding the source. Each mark was assessed from 4-13 minutia, and often there would be a high degree of similarity. However, the model cannot see absent minutia differences, and can only see corresponding mated minutia pairs.
Xena is currently undergoing testing to evaluate these corresponding likelihood ratios for mated pairs and non-mated pairs, including rates of misleading evidence. Additional testing will include reproducibility and repeatability tests across multiple users for the same mark.
Development of software tools to study the frequencies of occurrence of fingerprint features in the Dutch Population
Presentation by Dr Arent De Jongh, from the Department of Digital Technology and Biometry, Netherlands Forensic Institute
At the Netherlands Forensic Institute, fingerprint examiners report conclusions probabilistically. To investigate the rarity of fingerprint features, research is establishing the frequencies of features in a dataset of fingerprints from the Dutch population. Research has looked at fingerprint pattern and core-delta distance and is now considering minutiae shape and location.
Software tools make encoding large sets of fingerprints easier, and frequency tools can provide support for the expert findings of examiners. The Pattern Encoding Tool (PET) was developed to encode patterns in fingerprints. Development followed the stages of:
- a. Define the features to be encoded, including arch, loop, and whorl patterns, through literature searches and observing data.
- b. Create the tool using icons to represent the classification scheme
- c. Classify patterns. Approximately 24,000 prints were classified, allowing frequencies of different patterns to be established. For example, left/right plain loop occur often (Approximately 1 in 3 fingerprints), whereas inverted loops are more discriminative (Approximately 1 in 2191 fingerprints for left inverted loops)
The Core-Delta Distance Tool (CDDT) was developed following the same procedure. It was decided to count the ridges in between the core and delta point, which involved thinking about where ridges start. Classification provides frequency data that provides lots of evidential value when combined with pattern frequency data.
The Minutia Encoding Tool (MET) is currently in development. Deciding what to count and where to count was considered as different areas in a fingerprint will have different amounts of minutia; extra software support to define areas in the fingerprint might be developed. 400 loop patterns have been classified with different colours for different minutia types, with ridge endings and bifurcations the most common minutia.
Towards an appreciation of the weight of evidence for a hierarchy of propositions
Presentation by Dr Anjali Mazumder, AI and Justice and Human Rights Lead, and Dr Ruoyun Hui, Research Associate, at the Alan Turing Institute.
Increasingly, fingerprint examiners are being asked to address activity level propositions about how a finger mark may have been deposited. This requires considering a set of questions, constructing probabilistic statements, and accounting for uncertainty.
The project being carried out aims to develop a logical and probabilistic framework for dealing with activity level questions, building on the case assessment and interpretation framework, understanding the hierarchy of propositions, and using probabilistic graphical models.
For activity level propositions where there is no dispute at source level, questions about orientation and location, which are possibly correlated due to the constraints of the human body and physical environment, are often considered; how do the activities proposed by the prosecution and defence relate to contact events between the hand and the surface?
Each additional finger mark would raise more questions, about whether the marks are from the same finger, hand, and contact event.
In graphical models, it is easier to work with discrete states, meaning consideration needs to be given to what is a reasonable discretisation of the states for orientation and location, considering the ease of eliciting probabilities and the information provided that will distinguish propositions.
Activity level questions can be represented in a graphical model in the form of a Bayesian Network (Figure2). These can be difficult to make, as you need to determine variables of interest, their states, and an appropriate experiment to determine probabilities. Experiments and expert judgement provide probabilities to populate the Bayes Net.
Chain Event graphs (event trees, Figure 3) are another graphical model representation of activity level propositions that can help to formulate the story.
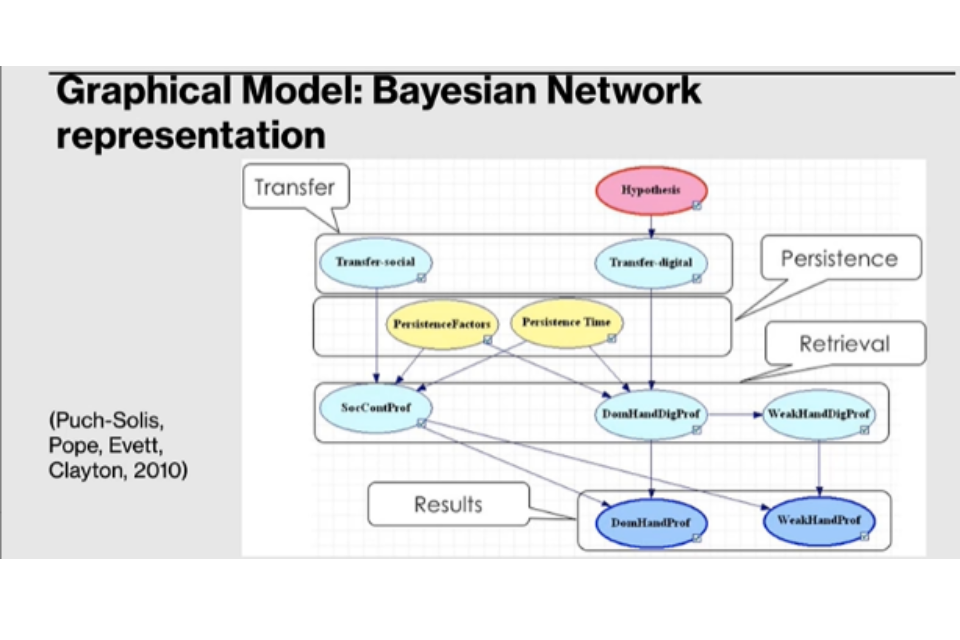
Figure 2. Graphical Model: Bayes Network
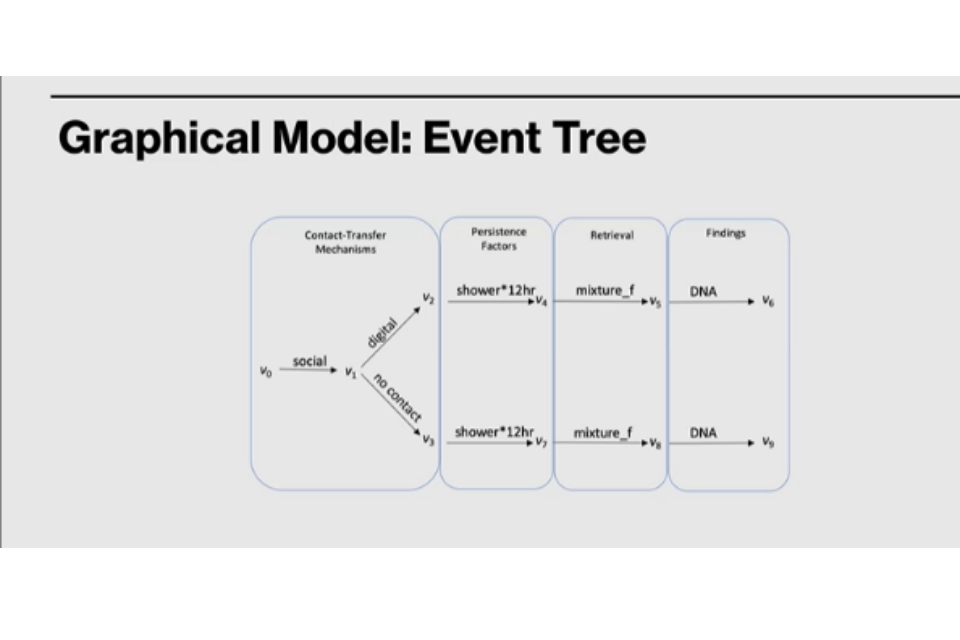
Figure 3. Graphical Model: Event Tree
Using Bayes Nets and Chain Event graphs as a tool for experts encourages the elicitation of expert knowledge of, and hence probabilities for, the various outcomes of an examination in relation to location, orientation, and multiplicity of marks.
Perspectives, challenges, and limitations toward the evaluative approach – Practitioner focused
Presentation by Caroline Gibb, from the Faculty of Electrical Engineering, Mathematics and Computer Science (EEMCS), Data Management & Biometrics (DMB), University of Twente, Enschede, The Netherlands.
Moving to an evaluative approach for reporting fingerprint examination observations is about strengthening decisions.
The expert witness has an overriding duty to the court, to be balanced, transparent, and impartial. An awareness of this role for the expert witness in maintaining public safety and supporting the criminal justice system is a key stepping-stone for moving towards an evaluative approach.
The tools to assist with the shift from categorical to evaluative approaches are in development, and now we need to consider what needs to be done to help the community move forward collectively.
Barriers to moving to an evaluative approach include:
- a. Cultural – there is a need to shift beliefs and the terminology that is used, for example, moving away from ‘absolute certainty’.
- b. Educational – hybrid systems mean there is a huge variability in the skills and experience of examiners, and changes will be needed in training.
- c. Personal – there is concern amongst examiners that their expertise will be negated by computer/statistical approaches, which is not the case as computer assisted methods only strengthen the interpretative process of the examiner.
- d. Professional – statistical anxiety or uncertainty about how to apply and communicate unfamiliar approaches presents a barrier.
- e. Process – to move from a categorical approach to an evaluative approach, the limits of the categorical approach need to be recognised and understood.
A gradual journey needs to occur where there is a shift from a categorical to an evaluative approach and understanding why this shift is needed is important. Recognising the limitations of expert opinions and issues of reliability, error, and variability can facilitate the understanding of why an evaluative approach is needed.
Involving fingerprint examiners and demonstrating that computer assisted approaches are there to inform judgements, not replace judgements, will be important for maintaining the intrinsic motivation that drives fingerprint examiners. Access to training and education will be critical in overcoming statistical anxiety.
Workshop Discussion Summary
In what way have the presentations changed any preconceptions you had about the application of statistical methods for interpreting friction ridge detail?
The responses to this question were varied; some respondents felt more informed, others felt the presentations strengthened their existing thoughts that statistical methods would be useful, and others felt more sceptical or still nervous.
In general, there was agreement that the presentations had provided information that was helpful.
What benefits do you think could come from introducing a statistical approach?
The point was made that some fingerprint examiners would like to introduce a statistical approach, and the benefits identified by respondents were as follows:
- a. Increased transparency and justification of decision making
- b. Consistent reporting
- c. Alignment with other fields of expertise, allowing logical combination of evidence
- d. Wider means to discuss results, and ability to discuss marks that are currently not reported that could benefit the CJS through supportive evidence
- e. Greater understanding of specificity, common configuration, and rarity
- f. Improved validity of opinion
- g. Call attention to the strength of evidence
- h. Better meet the requirements of legislation – e.g. the standards implicit within the CPR
What drawbacks could there be if a statistical approach was introduced?
The drawbacks identified by respondents were as follows:
- a. Getting buy in from staff could be difficult, and senior staff may leave
- b. Training will need to be considered and adapted
- c. Could add time to/delay the reporting process
- d. Could put pressure on resource constraints
- e. If not consistently applied the approach could be confusing
- f. Lack of understanding amongst practitioners could prevent effective articulation of findings
- g. Conclusions currently presented as identifications could be weakened in the eyes of the jury if presented as less conclusive
- h. Resistance from the courts
- i. Defence fingerprint experts may unfairly struggle if they lack understanding to challenge
- j. Sources of data are currently from the US/Netherlands, but we would require UK specific data to base approach and interpretation upon
- k. Might end up relying more on statistics than experience
- l. Miscarriage of justice associated with statistical evidence could damage the reputation of the discipline
Assuming a statistical approach was to be introduced, what would be needed to validate and verify this?
A large ground truth/known source database would be needed.
Assuming a statistical approach was introduced, how might interpretations and opinions be expressed?
There was a suggestion that avoiding the word statistical would be beneficial and using the terminology of probabilistic approach would be better.
An awareness that the presentations highlighted that the fingerprint expert can use their opinion but back it up with the statistical approach was acknowledged.
Assuming a statistical approach was to be introduced, what education and training would be required to enable this?
Discussion highlighted that significant training would be needed to ensure sufficient understanding of the concept and ensure it could be delivered in practice.
It was suggested that national guidelines for what should be covered in training would allow a consistent approach.
Investment into systems/algorithms/training would be needed to get practitioners to where they would need to be.
Assuming a statistical approach was to be introduced, what would competency and proficiency testing look like?
It was thought that competency and proficiency testing wouldn’t look too different, but that an appropriate framework and guidance documents would need to be developed before decisions could be taken on competence and proficiency training.
Ideas for competency and proficiency testing included:
- a. Competency testing could be required for laboratory analysis and courtroom delivery of evidence.
- b. Competency should test how the conclusion was reached.
- c. National guidance would be needed.
- d. Competency should focus on the use of software involved in a statistical approach.
- e. Proficiency testing could use near match marks to test the boundaries of conclusions.
- f. The quality of finger-marks used will be key, and how they will be sourced and graded needs considering.