Environmental influence on transmission, 28 April 2020 (updated 2 May 2020)
Updated 13 May 2022

© Crown copyright 2022
This publication is licensed under the terms of the Open Government Licence v3.0 except where otherwise stated. To view this licence, visit nationalarchives.gov.uk/doc/open-government-licence/version/3 or write to the Information Policy Team, The National Archives, Kew, London TW9 4DU, or email: psi@nationalarchives.gov.uk.
Where we have identified any third party copyright information you will need to obtain permission from the copyright holders concerned.
This publication is available at https://www.gov.uk/government/publications/environmental-influence-on-transmission-of-covid-19-28-april-2020/environmental-influence-on-transmission-28-april-2020-updated-2-may-2020
SAGE – Environmental and Modelling Group
Executive summary
1. We consider transmission through airborne, droplet and contact routes and consider the evidence relating to time spent in an environment, distance to the source (2 metres rule), transmission on surfaces and ventilation as a mitigating factor. This paper is based on evidence available as at 26 April 2020.
2. Transmission depends on both the amount of virus present and the duration and method of exposure, and hence it is important that both factors are considered when evaluating risk.
3. The risk of short range transmission through aerosol and droplets decreases with distance and there is evidence that 2 metres is a distance where risk drops to an acceptable level for face-to-face interactions.
4. The risk of short range transmission through aerosol and droplets also increases with time. For example a 6 second exposure at 1 metre is comparable to a 1 minute exposure at 2 metres. Longer duration exposures increase the relative viral exposure proportionally.
5. Exposure to cough is theoretically significantly more risky than exposure to someone talking; exposure to 1 cough at 2 metres is comparable to talking for 1 minute at 1 metre distance and talking for 30 minutes at 2 metres distance.
6. Calculating actual viral exposure is currently difficult to do with any certainty, although could be estimated from viral data from nasal and throat swabs. Studies to date sampling aerosols in hospital environments show very low or undetectable concentrations.
7. It may be possible to put measures in place to enable closer distancing in some circumstances. This will need careful consideration of the approaches with some further evaluation of any residual risks after additional mitigation.
8. Improving ventilation for poorly ventilated areas where it is technically feasible to do so may be an appropriate precautionary measure. EMG will share some clear statements on this to support departments.
9. Preliminary analysis suggests surface contacts are likely to be the most significant transmission route. Evidence to date suggests virus can persist on surfaces at a level that may pose a risk for up to 48 hours, while it is unlikely to persist in air for more than 30 minutes. Hence cleaning and hygiene measures are an important mitigating action.
10. We recommend that further data is collected on occupations and environments where there is a high rate of transmission to enable understanding of transmission routes and where mitigations need to be targeted. We also recommend that further research into the presence of the virus in the environment (air and surfaces) and survival of the virus on surfaces in realistic conditions (including outdoor) is undertaken.
11. EMG are developing a risk assessment approach to enable environmental factors to be incorporated into plans for reopening workplaces, schools and other environments.
Introduction
12. EMG has considered 4 groups of questions around transmission focusing on:
- the relationship between time spent in an environment and risk
- the role of ventilation as a mitigating factor
- the relationship between the 2 metres rule and transmission risk
- the risk of transmission from contact with surfaces
We have considered these in terms of published evidence (and some from pre-prints), some early findings from simulations and some simple risk models.
13. For the purposes of this work, ‘Environment’ is taken to mean the surroundings inhabited by individuals including work, outdoor and indoor settings. We do not consider the natural environment. We consider evidence from healthcare environments and many of the findings are relevant to healthcare; however this paper is not specific to high risk spaces such as hospitals.
14. We have considered transmission through airborne (inhalation), droplet and contact routes, and mitigation measures for these; however it should be noted that the relative importance of these 3 routes is unknown and may vary with the setting and the infectious person. The evidence to date suggests it is highly likely that short range droplet and aerosol and contact transmission dominate in most settings. It would be beneficial to collect more detailed data on environments where contract tracing shows transmission has occurred in order to analyse the transmission mechanisms post event.
Consensus from EMG and key recommendations
How does the length of time spent in an environment affect the rate of transmission?
15. Transmission risk can be considered using a Risk equals Hazard multiplied by Exposure methodology, where the risk depends on both the amount of virus present and the duration and method of exposure. For all transmission routes the duration of time a susceptible individual spends in an environment where virus is present will increase the probability of receiving a higher dose and hence an increased transmission risk. Short duration contacts even at less than 2 metres are highly likely to be low risk; a brief (6 second) conversation at 1 metre is estimated to be comparable to a 1 minute exposure at 2 metres. Many real world close encounters (such as passing someone in the street) will be even shorter than this.
16. For all transmission routes, the longer an infectious person spends in an environment, the greater the contamination they will leave in that environment for others to come into contact with. Laboratory studies demonstrate that surface contamination could persist for over 72 hours, although there is a substantial reduction after 48 hours. Although the virus has been shown to survive in the aerosol state, any aerosol particles (smaller than 5 micrometres in diameter) are unlikely to persist at a significant level for more than 30 minutes unless the ventilation is very poor. Larger droplets will quickly deposit on surfaces within 2 metres of the source. As well as enabling social distancing and hence limiting short range transmission, reducing the number of people in an environment and the time they spend there also reduces viral load on surfaces and in air.
17. It is feasible to estimate the influence of time on both exposure and contamination rate as a relative effect for different transmission routes. Estimating actual infection risk is more challenging; while data on other corona viruses can be used as a first estimate, there are not sufficient data on SARS-CoV-2 to confidently estimate infection risks at this time. Quantifying risk and contamination will require time to develop models and is specific to particular environments. It would be beneficial to understand which environments are the highest priority to model. Data on location and/or job role of those infected may help to identify the highest risk environments.
Can you rank workspaces by risk, for example warehouse, factory floor, office? How does this change depending on the number of people and activity?
18. A combination of environmental and human factors act to influence the 3 transmission routes and we suggest that appropriate mitigation measures should be assessed through a Hazard multiplied by Exposure risk matrix approach. We suggest a framework based on human health risk assessment methods (namely approaches such as that set out by the US EPA) that could be adapted for different work and public environments and activities. We suggest that this follows work tasks and spaces rather than industry sectors. Environmental factors need to consider the physical layout in terms of how this creates or limits interactions, systems such as the ventilation and sanitation which provide environmental connections between people and operational aspects such as cleaning which mitigate risk. EMG are currently developing a risk matrix approach to evaluating environments and activities which will be shared as soon as possible.
How can ventilation be used as a mitigation measure?
19. Ventilation acts to mitigate potential aerosol risk at distances beyond 1 to 2 metres. Only occasional low concentrations of aerosol have been thus reported for SARS-CoV-2. Ventilation has very limited effects on short-range aerosol and droplet and contact transmission, other than to possibly slightly reduce the rate of surface contamination. In a well-mixed environment, ventilation rate relative to the room size (usually measured in air changes per hour) together with the number of infectious people are the dominant factors. Where air change rates are low and occupant density is high, airborne exposure will be higher.
20. Improving ventilation is highly likely to have the greatest effect on airborne exposure in poorly ventilated environments with high occupant density, and increasing fresh air change rates is recommended where practical. It is feasible to use CO2 sensors as a proxy for sufficient ventilation in some environments, although occupancy must be considered when evaluating fresh air change rates. Airflow patterns can be an important factor and transfer of air between spaces should be discouraged. Current guidance issued by REHVA (EU) and ASHRAE (USA) recommends minimising recirculation of air between spaces, with systems set to run on a full fresh air mode where possible.
21. Use of air cleaning and filtration devices may reduce airborne exposure in spaces where ventilation can’t be improved; however this needs to be carefully considered in the context of the particular environment and the device. The use of these devices should not give a false sense of security and lead to the abandonment of other mitigation methods such as social distancing and cleaning. HEPA filter and UV-C based devices are probably the most suitable technologies, but must be sized appropriately for the space and may not perform as well in practice compared to laboratory tests. Devices that emit ozone or other toxic chemicals, or are otherwise harmful, should not be used in occupied spaces.
22. Ventilation is a precautionary measure that is likely to have a small impact on transmission but can be improved in many environments with minimal negative consequences. To date there is no evidence of airborne transmission in well ventilated buildings. Dilution in outdoor environments means that aerosol risk from respiratory sources is very low. EMG recommends that a summary of guidance is developed for the UK government website and that professional bodies such as CIBSE provide specific guidance for the industry (CIBSE updated their guidance on 27 April 2020).
How effective is the 2 metres rule?
23. The 2 metres rule mitigates droplet and short-range aerosol transmission. The 2 metres rule is not an absolute figure; risk decreases with distance and 2m is a distance where risk is considered by many to be sufficiently low to be tolerated. Evidence from modelling studies and simple calculation in a room without ventilation flow suggests that exposure could be 10 to 30 times higher at 1 metre compared to 2 metres. Risk is directional with face-to-face considerably higher risk unless there is a significant effect of the airflow. For those behind and to the side of a source, the concentrations they are exposed to at much closer distances (1 metre) will be governed by the ventilation flows and are likely to be similar to those at 2 metres for face-to-face. Coughing and sneezing is significantly higher risk than simply talking and hence those who have symptoms should make greater effort to maintain the 2 metres distance and contain coughs and sneezes appropriately.
24. For most circumstances the 2 metres rule is simple and is a good measure of the distance where the direct person-to-person transmission risk drops significantly although should be seen as a ballpark guide to distancing rather than an absolute value. EMG recommends that this rule is retained for public guidance, however they could be reassured that short duration closer contacts (such as passing a person in the street or in the supermarket) especially in outdoor environments are highly likely to be associated with a low exposure risk.
25. It is likely that in some cases it will be possible to put control measures in place to enable distancing at less than 2 metres. This is likely to be more straightforward where people are not face-to-face or are only at a closer distance for a very short period of time. Face coverings, local ventilation control, additional local cleaning and physical partitioning are possible options that could enable this. These options would need further exploration to determine what is most appropriate and where they could be applied.
What is the risk of transmission via surface contacts?
26. Evidence from previous coronavirus outbreaks, supported by preliminary modelling for the SARS-CoV-2 outbreak within EMG suggests that the infection can be transmitted by touching objects and there is a realistic possibility that this may be the dominant route. Recent work suggests differences in surface survival depending on the material (based on a single paper: van Doremalen et al., 2020) with SARS-CoV-2 surviving longest (up to 72 hours) on plastic and stainless steel, with a significant reduction in infectious titre over this timescale, followed by cardboard (viable up to 24 hours) and copper (viable less than 4 hours). EMG recommends that further data on presence of virus and survival on surfaces in realistic settings, including indoor and outdoor environments, are needed to make quantitative risk assessments for different cases. EMG would like to be provided with data on the survival of SARS-CoV-2 in the external environment or under simulated conditions (such as in the presence of UV light).
27. The evidence suggests that cleaning with appropriate materials does significantly reduce virus survival. Exposure is dependent on a wide range of issues: source of infectious agent, cleaning regime, nature of building environment, training or staff and so on. The risk factors for each environment should be identified to enable prioritisation by risk and feasibility of mitigation. It is important that a systems approach is taken to understand the interaction between risk factors as this will ultimately determine the overall risk and the opportunity to mitigate. Safe use of cleaning products is also a consideration in developing new approaches. EMG suggests that cleaning is likely to be a major factor in reducing risk in workplace and public settings and that work should be carried out across the SAGE working groups to understand the impact of cleaning in greater detail and to develop guidance for different buildings and settings.
Overview of evidence summary
Relationships between transmission, occupancy and exposure time
i. How does the length of time spent in an environment affect the rate of transmission?
28. Evaluating human health risks is commonly carried out using a Risk equals Hazard multiplied by Exposure approach. In this case the Hazard is related to the amount of virus present in a particular environment and the Exposure is related to the duration of exposure and potentially the method of exposure (droplet, aerosol or contact). Assessing risk in this way is widely used in human health risk assessments for chemical and biological exposure, food safety and in areas such as sanitation and hygiene. Some approaches also include vulnerability, however this is potentially difficult for COVID-19 – whereas some groups are clearly more vulnerable, the groups which are less vulnerable may be facilitating infection and hence including a vulnerability measure may give a false sense of protection.
29. In considering different environments it is necessary to consider the interactions that happen between people: whether these are between employees only, or employees and the public; the frequency and duration of these interactions; and whether interactions involve transfer of information (knowledge work), physical objects (retail) or personal interactions (hairdressers, dentists). It should also be recognised that, within a working environment, different types of spaces, activities and interactions can happen, including circulation spaces, bathrooms and eating areas, and hence it is not appropriate to simply assess the risk within a whole business as a single environment.
30. Assessing the detailed role of the environment on risk of infection could be carried out using a Quantitative Microbial Risk Assessment (QMRA) framework. This is a modelling methodology that relates the type and duration of exposure to a pathogen with a dose response model and uses a probabilistic method to quantify risk ranges in particular settings. This is a longer-term approach and requires more data; however, initial models have been carried out for contact transmission which show it may be possible to estimate infection risks.
31. The likelihood of any infection can be described through a dose-response relationship for the pathogen, where the probability of infection increases as the exposure increases. This is typically a beta-Poisson or exponential relationship and may vary with route of exposure. Data do not exist for SARS-CoV-2; however, dose-response for SARS-CoV-1 and HCoV-229E follow these type of relationships (Watanabe et al., 2010).
Ventilation as a mitigating factor - reduces potential for aerosol transmission
i. What are the key factors that differentiate aerosol risk of transmission indoors? For example, level of ventilation, size of room, level of furnishings.
ii. Are there specific mitigations that could work in different types of spaces?
iii. Are there air filters that could make a difference?
32. The use of ventilation as a mitigating factor is a precautionary measure for airborne transmission (see Figure 1. below, from REHVA (2020)) as the role of the airborne route has not yet been established for SARS-CoV-2. It is recommended that the approaches below should be explored and developed until further evidence is available.
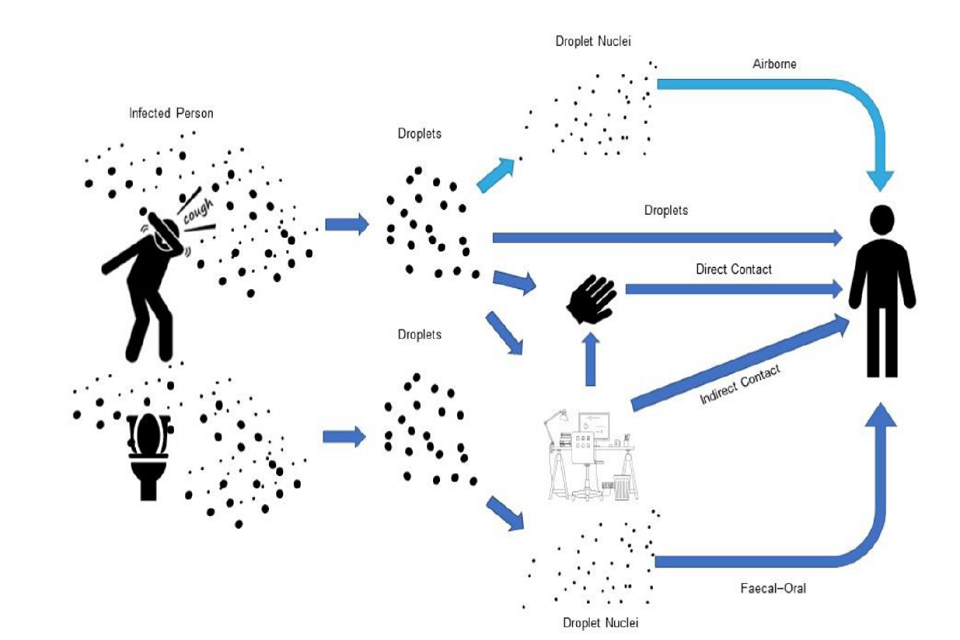
Figure: WHO reported exposure mechanisms of COVID-19 SARS-CoV-2 droplets (dark blue colour). Light blue colour: airborne mechanism that is known from SARS-CoV-1 and other flu, currently there is no reported evidence specifically for SARS-CoV-2 (figure: courtesy Francesco Franchimon).
33. Exposure to aerosols (beyond 2 metres) is primarily governed by the generation rate of the aerosol, the ventilation of the environment, the effective breathing rate of the occupant (which can be treated as reduced with appropriate PPE) and the duration of exposure. Infection risk is typically modelled as a beta-Poisson or exponential relationship with time (Noakes and Sleigh, 2009); doubling the ventilation rate or halving the duration of exposure will theoretically halve the rate of transmission by airborne routes. Evidence for airborne transmission is limited and hard to get, and there is little quantitative data available. Analysis of a restaurant outbreak in China points to possible airborne transmission associated with an extended duration of exposure (approximately 1 hour) and very poor ventilation (0.75 to 1.04 litres per second per person compared to the recommended 8 to 10 litres per second per person) resulting in 5 new cases.
34. Occupant density indoors is a key factor in transmission. Higher numbers of occupants increase the likelihood of an infectious individual being present and the number of occupants who may be exposed. Occupant number is also often related to ventilation rate as a result of design guidance for building ventilation. CIBSE Guide B2 makes reference to fresh air volume per unit time per occupant from BS EN 13779: 2007, with a value of 8 litres per second per person for moderate indoor air quality.
35. Although building design guidance typically specifies ventilation rates per occupant, the fresh air change rate (ACR) (the flow rate of outdoor air divided by the volume of the space expressed in units of reciprocal hours or air changes per hour (ACH)) is the key parameter that controls exposures. Larger values of the fresh air change rate will reduce concentrations and exposures. Conversely, where air change rates are low and occupant density is high, airborne exposure will be higher. The greatest exposure is likely to be seen when low air change rates are combined with longer residence times indoors and these environments should be the focus of any precautionary mitigating actions.
36. Guidance issued by the Federation of European Heating, Ventilation and Air Conditioning Associations (REHVA) (REHVA, 2020) and summarised by CIBSE (Smith, 2020) suggests a number of strategies for reducing risk from potential airborne transmission. These include: increasing air supply and exhaust ventilation, using more window-driven natural ventilation in buildings without mechanical ventilation and not using recirculation of air in centralised air handling units. The role of local recirculating air movement is less clear. Although (REHVA, 2020) suggest that local (room level) air recirculation should be avoided where possible, it may be required to supply fresh air to the whole of a ventilated space in some cases, as well as to provide cooling where necessary. The guidance indicates other specific advice for ventilation systems found in some buildings and also indicates measures that are not recommended such as modification to humidity or duct cleaning.
37. The identification of environments with low fresh air ventilation and high occupancy may not be straightforward. Ventilation rates are often difficult to determine, particularly in the absence of central air handling and building management systems. However, monitoring of CO2 levels may be an effective way of evidencing good ventilation in relation to occupancy. CO2 has also been used to define the risk of airborne infection (Rudnick and Milton, 2003) including for tuberculosis transmission in South African communal areas and public transport, identifying high risks in prisons and for drivers of transportation (Richardson et al, 2014; Andrews et al, 2013). There is a general acceptance that CO2 levels above 1000 parts per million (ppm) are indicative of poor ventilation rates. The provenance of this is clearly evidenced (Porteous, 2011) and corresponds well with a ventilation rate of 8 litres per second per person (Appleby, 1990). CO2 levels set at 1000 ppm in communal areas such as offices and schools have been set as indicators of sufficient per person ventilation rates to provide perceived good indoor air quality and counter human sourced emissions including moisture (BS EN 15251:2007; ASHRAE 62.2 FAQs, 2014). In the case of reduced occupancy, care should be taken that fresh air changes rates remain high if using CO2 as a measure.
38. Building management decisions will need to be informed by knowledge of specific buildings and will require the building operator to effectively implement any changes. In larger buildings there may be Facilities Management teams who carry out that role, but in smaller workplaces building occupants may be responsible for operations. As a result, clear guidance and messaging is key. However, professional opinion is complex and is continuing to develop over time. It is recommended that building operators are directed to seek more detailed advice through CIBSE (CIBSE, 2020) and may find helpful guidance from REHVA (REHVA, 2020) and ASHRAE (ASHRAE, 2020).
39. Air cleaning and disinfection devices may be beneficial in environments where it is difficult to improve the ventilation; the addition of local air cleaning or disinfection devices, such as air filtration or ultraviolet germicidal irradiation (UVGI) may be an alternative solution. However ensuring that devices perform to stated efficiency may be problematic and these should only be used as a last resort.
40. Local air cleaning systems, have been shown to be effective in reducing concentrations and exposures when properly sized for the targeted space (using Clean Air Delivery Rate and floor area or volume for example). The Ontario Medical Health Secretariat (2005) considered both portable air cleaning systems as well as fixed local air cleaning systems and concluded that, although not effective at preventing the spread of droplet-transmitted diseases (such as influenza and SARS), they may be deployed in situations with a novel or emerging infectious agent whose epidemiology is not yet defined and where airborne transmission is suspected. A range of different technologies are marketed for air cleaning including filtration, UVGI, ion generation, and electrostatic precipitation. Care should be taken to choose products that do not introduce additional problems such as generating ozone, a respiratory irritant. Other practical issues may be important such as noise levels for sufficiently sized units.
41. UVGI in particular can be applied as upper-room devices (Xu et al 2003) creating a zone of UV-C light above the heads of occupants. Airflows carry pathogens through the field inactivating microorganisms without causing harm to room occupants. A modelling study, carried out assuming a similar UV inactivation to that measured for a coronavirus, showed equivalent risk reduction to that which would be achieved by doubling the ventilation rate (Noakes et al 2015). Small consumer air cleaning devices may be beneficial in smaller rooms, although it should be recognised that many of these devices do not have a sufficient flow rate to effectively control bioaerosol concentrations in larger spaces. UVGI application within ventilation ducts may also be a practical approach for contaminated exhaust or in cases where it is not possible to stop recirculation of ventilation flows; however, they are of little benefit against person-to-person transmission when installed in the supply of a full fresh air system.
Mitigation through the 2 metres rule - reduces droplet and short-range aerosol transmission
i. Is the ‘2 metres rule’ an absolute rule related to the maximum travel distance of the virus through air or is it based on an assessment of risk? If the latter, how would this change depending on the likely level of infection in the population?
ii. What is the relationship with the length of time spent at distances below 2 metres with a source of infection?
iii. Does the ‘2 metres rule’ vary depending on whether you are outside or inside?
iv. Does the ‘2 metres rule’ vary depending on positioning (face-to-face, side-by-side, in front or behind)?
v. Does the ‘2 metres rule’ vary depending on volume of people? (For example, 200 people 2 metres apart better or worse than 2 people 1 metre apart)?
vi. Is it better to have a simple (2 metres) rule or a more nuanced rule that allows flexibility but may be harder to explain?
42. Exposure to large droplets (20 micrometres and greater) and short-range aerosol (less than 20 micrometres) at distances 2 metres and below is primarily governed by the generation rate from the respiratory activity and the duration of time in proximity to the source. Only a small number of studies have explicitly considered dispersion of respiratory sources and quantitatively explored the relationship with distance; these are all based on chamber experiments with manikins, computational fluid dynamics (CFD) and analytical modelling.
43. The physics of aerosol and droplet dispersion is very complex, depending on the velocity of the exhaled air (a cough or sneeze is more violent than breathing and talking), the number and size distribution of the particles in the exhalation, the temperature, humidity and airflow speeds in the surrounding air, and the effects of buoyancy through the thermal plume that surrounds the person. The behaviour of the jet of air released from a person will vary between people and behave differently in different environments.
44. Application of simple turbulent jet mixing theory to fine aerosol particles (treating as a gas) suggests that the concentration at would be reduced by around 90% at 1.5 metres and 93% at 2 metres, compared to the concentration 5 centimetres. However this calculation doesn’t consider droplets or the complex interactions between aerosols and droplets. A visualisation and experimental study shows that these can travel as a turbulent cloud or plume which enables travel over a longer distance than expected (Bourouiba, et al, 2014).
45. Liu et al. (2017) shows through ventilated chamber experiments that exposure to aerosols (smaller than 5 micrometres) decreases with distance. At 0.5 metres they indicate aerosol exposure is 4 to 7 times greater than in the room air, while by 1.5 to 2 metres the concentration of aerosols is comparable to that in the room air. The concentration in room air is inversely proportional to the ventilation rate. The same study modelled droplet deposition onto the body and showed it reduced significantly with distance. They did not model exposure, but indicated that, at locations under 2 metres, exposure is the combination of the short range aerosol, which can be inhaled plus the droplet deposition onto the person as illustrated in Figure one.
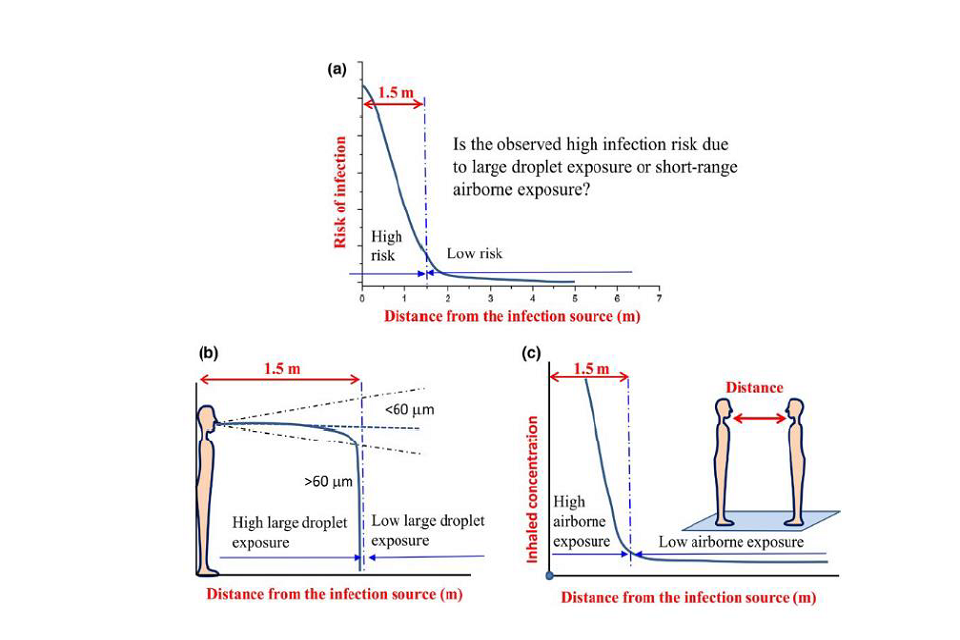
Figure 1: Mechanisms for short-range exposure from (Liu et al., 2017)
-
Chen et al. (2020) quantifies short range exposure through inhalation and deposition onto facial mucous membranes for still air using an analytical model and assuming a face to face scenario. They suggest exposure reduces by over 99.99% at 1.5 to 2 metres compared to 0.1 metres. Coughing results in around 20 to 50 times the exposure at 1.5 to 2 metres compared to talking. Estimates suggest exposure at around 1 metre may be 10 to 30 times higher than at 2 metres. Even at 1 metre, reduction with talking is 10 times less than at 0.5 metres, and is 5 times safer than a cough at 2 metres. The study did not consider a sneeze, but data on sneeze particle generation suggests this would be over 1,500 times greater than talking. The reduction in risk with distance is still comparable, however other studies have shown a sneeze can project further. It should be noted that this study considers no ventilation flow.
-
By taking the analysis in Chen et al. (2020) and multiplying the talking and cough exposures by time, enables a relative exposure with time and distance to be estimated (Figure 2). This is calculated relative to the exposure to talking at a distance of 2 metres for 1 minute. For talking, a shorter exposure (6 seconds) at 1 metre is comparable to the 1 minute exposure at 2 metres. Longer duration exposures increase the relative viral exposure proportionally. Exposure to cough is significantly more risky with exposure to someone coughing at 2 metres for 1 minute is comparable to talking for 1 minute at 1 metre and talking for 30 minutes at 2 metres. While this gives some initial estimates of order of magnitude difference with exposure, these calculations should be treated with caution as the model does not include the effects of ventilation or buoyancy.
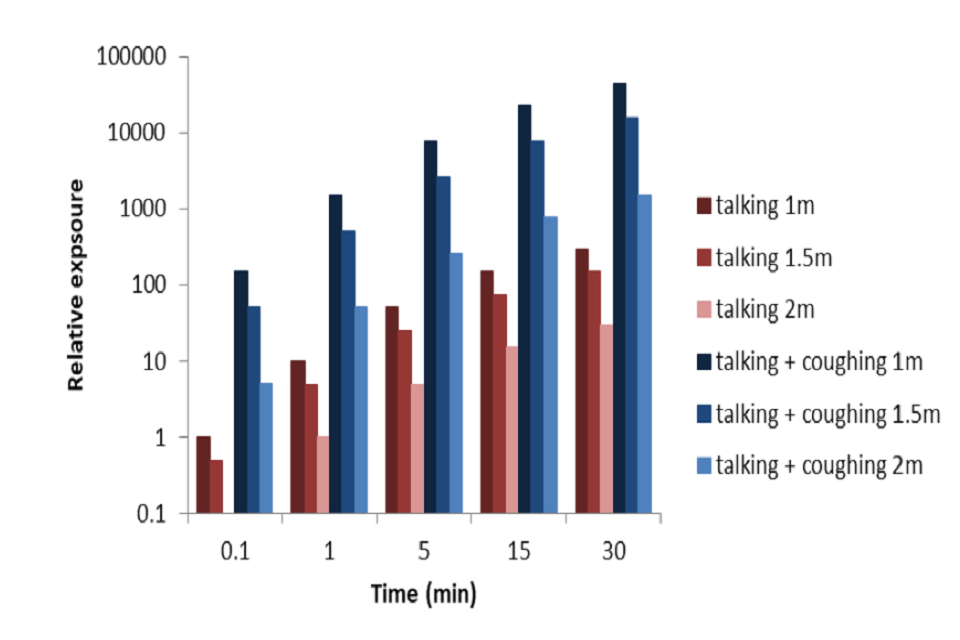
Figure 2: Estimated relative exposure with time based on exposure-distance model (Chen et al., 2020). Cough assumes 1 cough per minute. Note log scale. (NOTE Preliminary calculations – not peer reviewed).
48. Assessing infection risk from this is challenging. SARS-CoV-2 emission rates in exhaled aerosol have been estimated through calculation based on aerosol mass and a high range sputum concentration of 108 virus per millilitre to range from 10.5 virus particles per hour for breathing to over 1000 virus particles per hour for speaking during light activity (pre-print Buonanno, et al, 2020). Extending this approach to the droplet models presented in (Chen et al., 2020) could allow a preliminary calculation of viral exposure. However it should be noted that this approach assumes that the viral load is proportional to droplet size; data for other infections suggests that this may not be the case, and the viral load may be proportionally higher in the smaller droplets (Milton et al., 2013). It should also be noted that Buonanno et al (2020) used a viral load at the higher end of those measured to date. Values measured by (Pan et al., 2020) from 80 people suggest values between 641 and 1.3 x 10¹¹ virus per millilitre with median values around 8 x 10⁴ virus per millilitre in throat swabs, 7.5 x 10⁵ virus per millilitre in sputum swabs. Viral loads at onset were typically around 106 virus per millilitre. As the infectious dose, and dose-response is unknown it is not possible to state whether estimated values would lead to infection.
49. Short range exposure at distances below 2 metres in locations with a low air speed is dominated by the plume of particles in the cough (exhaled) jet and hence is significantly affected by relative location. A face-to-face close exposure will be much greater than side by-side or someone located behind. Preliminary CFD data suggests cough particles are predominantly within 50 centimetres either side of the source and move with the dominant flow direction, although this has not been modelled for cross-flow conditions. At distances beyond 1 to 2 metres in indoor environments, the concentration and hence the exposure is increasingly influenced by the ventilation of the room; in a well-mixed room at 6 ACH Pantelic et al (2015) showed exposure decreased linearly at around 20% per metre from 1 to 4 metres. This means that providing there isn’t a directional flow, a person located behind the source or to the side will be exposed to the mixed air concentration in the room rather than the higher concentration in the exhaled jet even if they are closer than 2 metres. This presumes the occupants are static; the risk may be increased where occupants are active.
50. Higher flow rates in outdoor environments can potentially transport larger droplets further than 2 metres. Preliminary analysis through CFD modelling shows the increased transport of larger droplets released in a cough scenario at 2 metres, however the majority of these would deposit on the lower part of the body, and exposure is constrained to a narrow band directly downwind from the source. As discussed above, time will be a significant factor; a fleeting exposure to a small number of cough droplets outdoors is likely to be far less significant than prolonged exposure in an indoor environment. More detailed analysis is possible through CFD modelling, however these models will take time to set up and run.
Mitigation through surface hygiene – limits contact transmission through contaminated surfaces.
i. What does ‘environment’ mean? Does this mean it lives on all surfaces for 48 hours? How can you mitigate this?
ii. How easy is to catch the virus from touching objects?
iii. Is there a difference between materials? For example, is metal safer than soft furnishings?
iv. How prolonged does exposure need to be? Will it live for 48 hours on a door handle?
v. How does cleaning impact virus survival?
51. Exposure via touching contaminated surfaces depends on the concentration of virus on the surfaces, the proportion of surfaces in an environment that are contaminated, the transfer efficiency from surfaces to hands, the frequency with which people touch their face (assuming this is the route for inoculation) and the frequency and efficacy of hand hygiene.
52. Van Doremalen et al. (2020) analysed the aerosol and surface stability of SARS-CoV-2 in comparison to SARS-CoV-1 on various surfaces, using a Bayesian regression model to analyse decay rates. Their samples were generated by nebuliser and the inoculum used was comparable to samples obtained from the upper and lower respiratory tract in humans. Surfaces tested were plastic, stainless steel, copper and cardboard. SARS-CoV-2 was more stable on plastic and stainless steel than on copper and cardboard. A reduction in viable virus titre was observed for plastic after 72 hours (from 2.5 x 10³ to 5 x 100 TCID50 per millilitre of medium), and after 48 hours with stainless steel (from 5.01 x 10³ to 4 x 100 TCID50 per millilitre). No viable SARS-CoV-2 was measured after 24 hours on cardboard, or after 4 hours for copper. These results were similar to SARS-CoV-1, which the authors suggest indicates that the variation in epidemiological characteristics of SARS-CoV-2, in comparison to SARS-CoV-1, is probably due to other factors. They conclude that fomite transmission of SARS-CoV-2 is plausible since the virus can remain viable and infectious on surfaces for up to 3 days in laboratory conditions (depending on the material). Both FSA and PHE have previously reviewed this issue and PHE have previously recommended a practical precautionary value of 48 hours. Survival data for a variety of coronaviruses has been summarised in the FSA’s qualitative risk assessment (March 2020) as shown in Figure 3.
Summary of published studies on coronavirus survival on surfaces:
| Surface | Virus | Time | Conditions | Reference |
|---|---|---|---|---|
| PVC | HCoV 229E | 5 days | 21oC, 30-40% Relative Humidity | Warnes et al 2015 |
| PTFE (Teflon) | HCoV 229E | 5 days | 21oC, 30-40% Relative Humidity | Warnes et al 2015 |
| Ceramic | HCoV 229E | 5 days | 21oC, 30-40% Relative Humidity | Warnes et al 2015 |
| Glass | HCoV 229E | 5 days | 21oC, 30-40% Relative Humidity | Warnes et al 2015 |
| Rubber (silicon) | HCoV 229E | 3 days | 21oC, 30-40% Relative Humidity | Warnes et al 2015 |
| Stainless steel | HCoV 229E | 5 days | 21oC, 30-40% Relative Humidity | Warnes et al 2015 |
| Brass (>70% Copper) | HCoV 229E | <40mins | 21oC, 30-40% Relative Humidity | Warnes et al 2015 |
| Nickel | HCoV 229E | <120mins | 21oC, 30-40% Relative Humidity | Warnes et al 2015 |
| Plastic plate | SARS-CoV-1 | 5 days | 22-25oC, 40-50% Relative Humidity | Chan et al 2011 |
| Polystyrene plate | HCoV 229E | 72 hours | 21-25oC | Rabenau et al 2005 |
| Polystyrene plate | SARS-CoV-1 | 9 days | 21-25oC | Rabenau et al 2005 |
| Paper | SARS-CoV-1 | 24 hours* | Room Temperature | Lai et al 2005 |
| Plastic gown | SARS-CoV-1 | 2 days* | Room Temperature | Lai et al 2005 |
| Cotton gown | SARS-CoV-1 | 24 hours* | Room Temperature | Lai et al 2005 |
| Metal | SARS-CoV-1 | 5 days | Room Temperature | Duan et al 2003 |
| Wood | SARS-CoV-1 | 4 days | Room Temperature | Duan et al 2003 |
| Paper | SARS-CoV-1 | 4-5 days | Room Temperature | Duan et al 2003 |
| Glass | SARS-CoV-1 | 4 days | Room Temperature | Duan et al 2003 |
| Copper | SARS-CoV-2 | 4 hours | 21-23oC, 40% Relative Humidity | Van Doremalen et al 2020 |
| Cardboard | SARS-CoV-2 | 24 hours | 21-23oC, 40% Relative Humidity | Van Doremalen et al 2020 |
| Stainless steel | SARS-CoV-2 | 48 hours | 21-23oC, 40% Relative Humidity | Van Doremalen et al 2020 |
| Plastic | SARS-CoV-2 | 72 hours | 21-23oC, 40% Relative Humidity | Van Doremalen et al 2020 |
*Times vary by viral titre, these are the maximum survival times based on the highest initial viral titre.
Survival time is defined as the time after which the viral titre dropped below the detectable level (detectable level was variable depending on the experiment). For less precise end times this was due to the viral titre reaching the required log fold reduction before that time point was measured.
Figure 3: Survival of coronaviruses on surfaces.
53. Assessing the risk of infection from touching contaminated objects can be evaluated through a QMRA approach considering touch at different times followed by touching nasal mucous membranes. While this has several uncertainties, based on current data on survival on surfaces, the preliminary analysis in Figure 4 (not peer-reviewed) suggests that inoculation could be significant.
54. Kampf et al. (2020) analysed 22 studies describing the persistence of human coronaviruses such as Severe Acute Respiratory Syndrome (SARS) coronavirus, Middle East Respiratory Syndrome (MERS) coronavirus or endemic human coronaviruses (HCoV) on inanimate surfaces like metal, glass or plastic. Persistence was identified for up to 9 days depending on the virus, but their review of the literature identified that coronaviruses can be efficiently inactivated by surface disinfection procedures with 62% to 71% ethanol, 0.5% hydrogen peroxide or 0.1% sodium hypochlorite within 1 minute. Other biocidal agents such as 0.05% to 0.2% benzalkonium chloride or 0.02% chlorhexidine digluconate proved to be less effective.
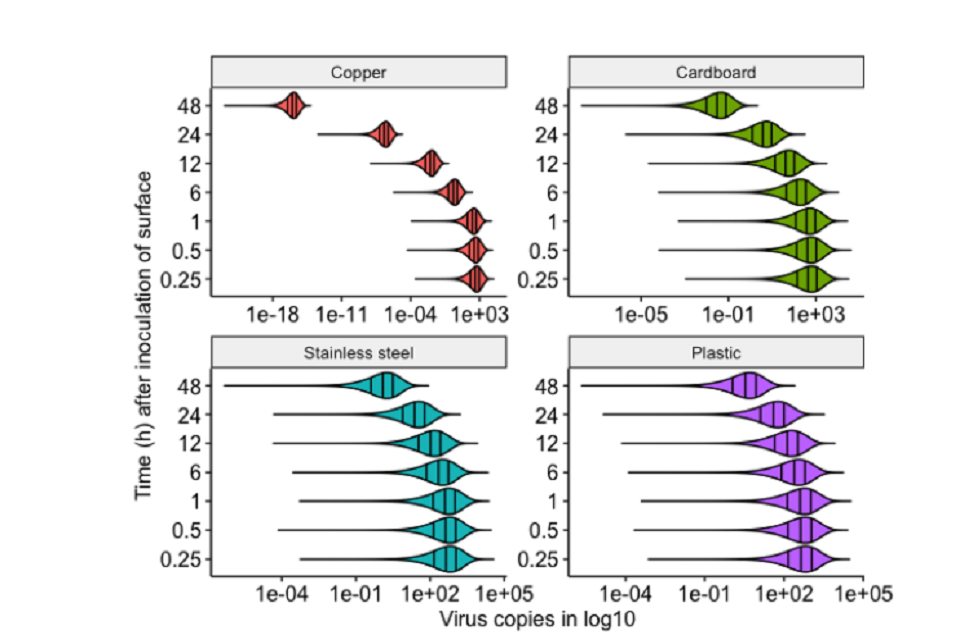
Figure 4: Modelled dose (in viral copies) received by an individual after touching a surface at different times after initial surface contamination, and subsequently touching their nasal mucous membrane during 1 hour. Note that the different horizontal scales and extensive log range. (NOTE preliminary calculations, not peer reviewed).
55. In studies looking particularly at SARS-CoV-2, Wang et al (2020) used quantitative real-time reverse transcription PCR (qRT-PCR) methods to confirm the existence of SARS Cov-2 on 36 surfaces wiped with 1000 milligrams per litre chlorine containing disinfectant. They also looked at sewage outlet samples. Viral culture was performed for any samples positive for SARS-Cov-2 RNA. The authors did not find any SARS-Cov-2 RNA on the 36 surface samples after cleaning. However 3 sewage samples from the inlet of a pre-processing disinfection pool were positive for SARS-CoV-2 RNA and a sample from the outlet of pre-processing disinfection pool was weakly positive. All of the 5 sewage samples from various points were negative by viral culture of SARS-CoV-2. The monitoring data in this study suggested that the strict disinfection and hand hygiene could decrease the hospital-associated COVID-19 infection risk of the staff in isolation wards.
56. Hirotsu et al. (2020) reported that all areas cleaned after housing an infectious patient with SARS-CoV-2 were free from viral RNA, suggesting that thorough cleaning is sufficient for SARS-CoV-2 decontamination. However, the study did not take any swabs prior to cleaning so the results are equivocal. Chang et al. (2020) observed a 20.4% increase in calls to the USA’s National Poison Data System in the period January to March 2020 compared to the same period in 2020. This followed CDC advice that, with precautions, the proper cleaning and disinfection of high-touch surfaces should be used to help mitigate the transmission of SARS-CoV-2. Through investigating a small number of these cases they suggested that the COVID-19 pandemic advice was leading to increased inappropriate use of cleaners and disinfectants such as using more than directed on the label, mixing multiple chemical products together, not wearing protective gear, and applying in poorly ventilated areas. The authors suggest that effective communication, labelling and training should be used to reduce this risk.
57. We note that hand hygiene methods may have a significant effect on hand contamination and subsequent surface contamination. Experiments conducted using a bacteriophage surrogate showed that substantially more contamination was found on touch surfaces and volunteers clothing following drying hands using jet air dryers compared to paper towels (Wilcox, Moura 2019). Previous work has also shown jet dryers to cause significant contamination in bathroom environments (Best et al., 2018). Simply recommending regular hand washing may not be enough and the method of drying may also be important too. Given that contamination in bathroom environments appears to be higher than in many other spaces, this should be an important environment for consideration. This has implications for workplace environments which often only have jet dryers.
58. It may be feasible to use other mitigation approaches such as novel surface materials in high-risk areas. For example alcohol release door plates have been shown to reduce contamination for bacterial pathogens and may be a viable option for reducing viral transmission (Best, Parnell and Wilcox, 2017). Innovations to reduce contact through devices such as automatic door opening and contactless operation of systems may also be useful for reducing transmission. It is important that any such measures focus on the priority areas of high touch sites rather than all surfaces and systems.
References
Andrews, Jason R., Carl Morrow, and Robin Wood. ‘Modelling the role of public transportation in sustaining tuberculosis transmission in South Africa.’ American journal of epidemiology 177.6 (2013): 556-561.
ASHRAE 2020, ASHRAE Position Document on Infectious Aerosols, 14 April 2020, ASHRAE,
Best, E. et al. (2018) ‘Environmental contamination by bacteria in hospital washrooms according to hand-drying method: a multi-centre study’, Journal of Hospital Infection. Elsevier Ltd, 100(4), pp. 469–475. doi: 10.1016/j.jhin.2018.07.002.
Best, E. L., Parnell, P. and Wilcox, M. H. (2017) ‘The potential of alcohol release doorplates to reduce surface contamination during hand contact’, Journal of Hospital Infection. Elsevier Ltd, 97(4), pp. 424–429. doi: 10.1016/j.jhin.2017.07.027.
Bourouiba, L., Dehandschoewercker, E. and Bush, J. W. M. (2014) ‘Violent expiratory events: On coughing and sneezing’, Journal of Fluid Mechanics, 745, pp. 537–563. doi: 10.1017/jfm.2014.88.
Buonanno, G., Stabile, L. and Morawska, L. (2020) ‘Estimation of airborne viral emission : quanta emission rate of SARS-CoV-2 for infection risk assessment’.
Chang, A. et al. (2020) ‘Cleaning and Disinfectant Chemical Exposures and Temporal Associations with COVID-19 - National Poison Data System, United States, January 1, 2020 to March 31, 2020.’, MMWR. Morbidity and mortality weekly report, 69(16), pp. 496–498. doi: 10.15585/mmwr.mm6916e1.
Chen, W. et al. (2020) ‘Short-range airborne route dominates exposure of respiratory infection during close contact’, Building and Environment. Elsevier Ltd, pp. 1–33. doi: 10.1016/j.buildenv.2020.106859.
van Doremalen, N. et al. (2020) ‘Aerosol and Surface Stability of SARS-CoV-2 as Compared with SARS-CoV-1’, New England Journal of Medicine. Massachusetts Medical Society. doi: 10.1056/nejmc2004973.
Hirotsu, Y. et al. (2020) ‘Environmental cleaning is effective for the eradication of severe acute respiratory syndrome coronavirus 2 (SARS-CoV-2) in contaminated hospital rooms: A patient from the Diamond Princess cruise ship.’, Infection control and hospital epidemiology, pp. 1–8. doi: 10.1017/ice.2020.144.
Kampf, G. et al. (2020) ‘Persistence of coronaviruses on inanimate surfaces and their inactivation with biocidal agents’, Journal of Hospital Infection. W.B. Saunders Ltd, pp. 246–251. doi: 10.1016/j.jhin.2020.01.022. 15
Liu, L. et al. (2017) ‘Short-range airborne transmission of expiratory droplets between two people’, Indoor Air, 27(2), pp. 452–462. doi: 10.1111/ina.12314.
Milton, D. K. et al. (2013) ‘Influenza Virus Aerosols in Human Exhaled Breath: Particle Size, Culturability, and Effect of Surgical Masks’, PLoS Pathogens. Public Library of Science, 9(3). doi: 10.1371/journal.ppat.1003205.
Noakes, C. J. and Andrew Sleigh, P. (2009) ‘Mathematical models for assessing the role of airflow on the risk of airborne infection in hospital wards’, Journal of the Royal Society Interface, 6(SUPPL. 6). doi: 10.1098/rsif.2009.0305.focus.
Pan, Y. et al. (2020) ‘Viral load of SARS-CoV-2 in clinical samples’, The Lancet Infectious Diseases. Elsevier Ltd, 20(4), pp. 411–412. doi: 10.1016/S1473-3099(20)30113-4.
Pantelic, J., Tham, K. W. and Licina, D. (2015) ‘Effectiveness of a personalized ventilation system in reducing personal exposure against directly released simulated cough droplets’, Indoor Air, 25(6), pp. 683–693. doi: 10.1111/ina.12187.
Wang, J. et al. (2020) ‘SARS-CoV-2 RNA detection of hospital isolation wards hygiene monitoring during the Coronavirus Disease 2019 outbreak in a Chinese hospital.’, International journal of infectious diseases : IJID : official publication of the International Society for Infectious Diseases. International Society for Infectious Diseases, 94(January 2019), pp. 103–106. doi: 10.1016/j.ijid.2020.04.024.
Watanabe, T. et al. (2010) ‘Development of a dose-response model for SARS coronavirus’, Risk Analysis, 30(7), pp. 1129–1138. doi: 10.1111/j.1539-6924.2010.01427.x.
Wilcox M, Moura I. Investigating the dispersal of microbes in a hospital setting following hand drying using either paper towels or a jet air dryer. Final Report.
Xu P, Peccia J, Fabian P, Martyny JW, Fennelly KP, Hernandez M, Miller SL. Efficacy of ultraviolet germicidal irradiation of upper-room air in inactivating airborne bacterial spores and mycobacteria in full-scale studies. Atmospheric Environment (2003): 37; 405-419.